

Introduction
Today, the use of antibiotics in healthcare, business, agriculture, and animal husbandry is widespread. Tetracycline is a broad-spectrum antibiotic that is particularly effective against infections brought on by gram-positive and gram-negative bacteria, mycoplasma, and parasites brought on by protozoan [1-3]. However, most antibiotic residues are not completely adsorbed but are released about 60-90% into the medium. The pollution and accumulation of tetracycline is increasing day by day, so it has an increasingly serious negative impact on the environment and human health. Therefore, the development of effective treatment technology is imperative to remove tetracycline from wastewater. Many methods have been studied, but the adsorption method is the most used due to the advantages of efficiency and adsorption efficiency [4, 5].
Aerogel composite materials are materials that combine aerogels with other substances to enhance their properties or create new functionalities. Aerogel composites have found applications in various industries and fields. For example, they have been used in aerospace for lightweight insulation, in construction for thermal insulation, in energy storage devices for improved battery performance, and in environmental applications for filtration or adsorption of pollutants. The unique properties of aerogels, combined with the added benefits of other materials, make aerogel composites versatile and valuable in a wide range of applications. Researchers around the world are also studying the use of aerogel composite materials as potential adsorbents. Yuan Zhuang et al. (2015) have improved and synthesized 3-D graphene-protein composites (GS0) aerogel materials to adsorb tetracycline antibiotics. The protein composition in the material has little adsorption effect but is cheap and non-toxic, the graphene-soybean protein composite aerogel has markedly improved in its use as adsorbent or biological applications [6]. Jie Ma and her team (2020) enhanced the removal of antibiotics by carbon nanotubes/graphene oxide/hydrogel nanocomposite tri-lattice of sodium alginate in aqueous solution. Compared with traditional hydrogels and double lattice hydrogels currently under development, this triple lattice composite hydrogel can exploit their three-dimensional structure to improve adsorption capacity [7]. Mengist Minale (2021) and colleagues enhance the removal of the antibiotic oxytetracycline (OTC) from water using a manganese dioxide-impregnated hydrogel composite (adsorption and oxidative degradation pathways). The present study is the first attempt at using a poly (sodium acrylate) manganese dioxide (MnO2@PSA) hydrogel to address the potential threats posed by the antibiotic oxytetracycline (OTC) in aquatic environments [8]. Quan Liao (2022) studied glutaraldehyde used as a hydrophobic regulator to cross-link polyvinyl alcohol (PVA), and copper ion immobilized by sodium alginate (SA). Polyvinyl alcohol-copper alginate (PVA-CA) gel beads were prepared by a one-step process, and used to absorb and remove tetracycline (TC) from aqueous solution [9]. Realizing the potential of aerogel composites, our study on aerogel composites based on PVA/Maltodextrine/Agar combined with montmorillonite can remove Tetracycline antibiotic from water.
Experimental
PVA/Maltodextrine/Agar-based composite hydrogels materials can be synthesized according to the following steps: first stir 3% PVA until dissolved in 12 hours, stir 2% Agar at 80ºC until visible transparent, stir 2% Maltodextrin at 60ºC until dissolved. Next, pour Agar into PVA and then Maltodextrin stir at 60ºC for 3 hours. Then add 0.6% glycerol, continue stirring at 60ºC for 2 hours. Continue to put the sample on the stove stirring to evaporate the water. Finally, pour it into a 96-well tray and put it in the fridge overnight. Then sublimation drying until the material is dry.
The structural properties of the materials were measured by the following methods: XRD (X-ray diffraction), FTIR (Fourier Transform Infrared spectroscopy), SEM (scanning electron microscopy), BET (Brunauer-Emmett-Teller). The factors affecting the adsorption process: concentration, time, solution pH and volume on the adsorption efficiency of tetracycline antibiotic (TCC) were performed in this study. Weigh 0.001 g of raw material into 10 mL of antibiotic-forming solution at different concentrations from 20 to 160 mg/L. Stir at constant temperature 200 rpm. Timed sampling, centrifugation to remove solids from solution using a centrifuge (5000 rpm, 10 min). Measure residual antibiotic concentration by UV-Vis. The expected product will be a highly efficient antibiotic adsorption process. The tasks to be performed include time survey (from 10 to 400 minutes), survey of organic pigment concentration (20-160 mg/L), survey of solution pH (2, 4, 6, 8, 10), survey the volume of raw materials (0.05; 0.1; 0.2; 0.3 g/L). The experimental data of the study were evaluated to be consistent with the kinetic and isothermal models of adsorption.
Results and Discussion
Analysis of Surface Morphology
X-ray Diffraction Analysis
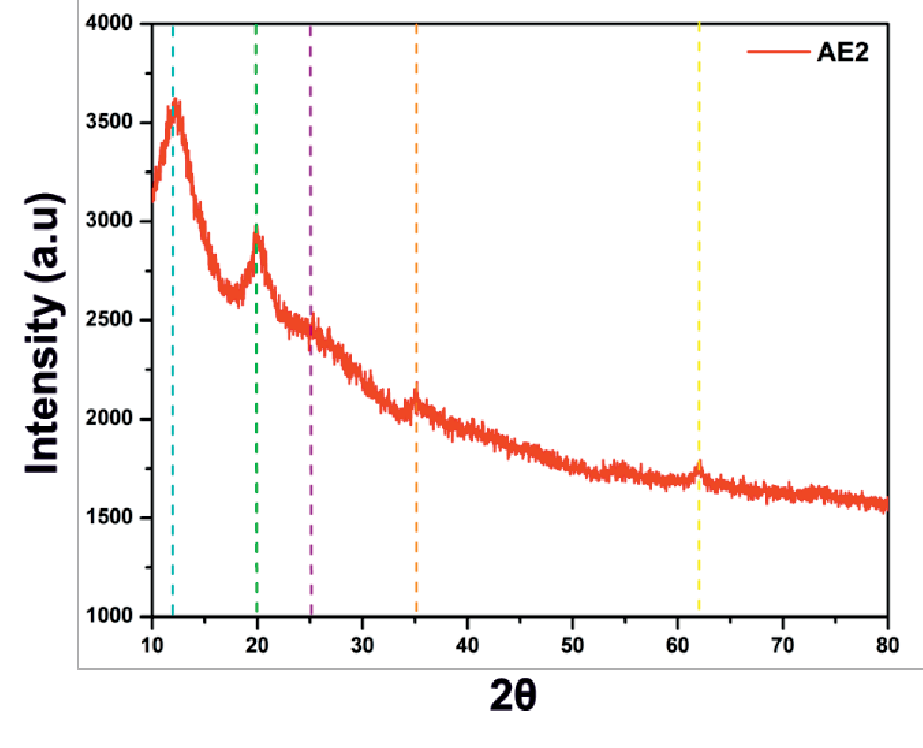
To evaluate the effect of agar and maltodextrin on the structure of PVA, X-ray diffraction (XRD) analyzes were used and observed in Fig. 1 For the AE2 substrate, a wide peak at 2θ = 20º characterizes the crystalline structure of the matrix [10, 11]. After combining with agar and maltodextrin, the XRD spectrum of the film appears a crystal peak at 2θ = 12.2o, which correlates with a shoulder of agar [12]. The maximum intensity at 2θ = 25o, 35.1o, 61.9 o characterizes the crystalline structure in clay (MMT) [13]. A significant reduction in intensity can be observed due to the agar and maltodextrin content [14, 15]. This change implies that the amorphous regions increase significantly with the addition of agar and maltodextrin due to the existence of free radicals present in the structure. Therefore, the incorporation of agar and maltodextrin into arogel composites can affect the crystalline order of the molecules; As a result, the mechanical and thermal properties of the composite material may be affected.
Infrared Spectrum Analysis
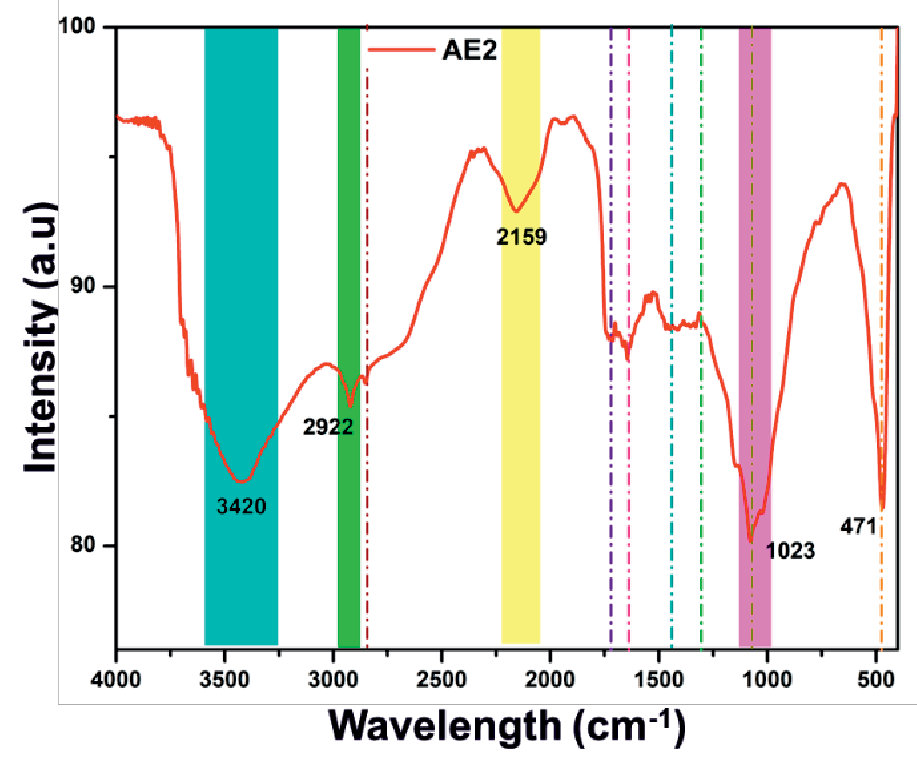
The FTIR results of the sample in Fig. 2 show that there are two main absorption regions at low wave numbers in the range 450-1750 cm-1 and at higher wave numbers corresponding to about 2100-3500 cm-1.
The absorption tip at 3400 cm-1 is related to stretching vibrations of the OH group, the absorption tip at 2922 cm-1 is attributed to Agar-specific methoxyl groups and corresponds to asymmetric and sym-lipid CH2 respectively [16] prolongation of Maltodextrin. The characteristic absorption nose in the range 1500-1750 cm-1 corresponds to the vibrations of the aromatic ring. In addition, two spectral peaks at 1650-1730 cm-1 were observed for the sample representing the C=O oscillations of the vinyl acetate group of PVA, the absorption peak at 1443 cm-1 related to the vibrational oscillation of O–H, 1203 cm-1 is related to the bending vibration of C–H, 1040 cm-1 is attributed to the tensile vibration of C–O and the peak at 826 cm-1 is attributed to the tensile vibration of C–C [17]. When mantodextrin and agar were incorporated into the PVA circuit, a significant reduction in the peak intensity of the O–H and C=O tension oscillations could be observed. In addition, the peak intensity at 1038 cm-1 of C–O tension oscillation increased significantly in the composite film compared with PVA [18]. Comparing AE2 samples, there is a clear difference between the signals of the spectral peaks: the AE2 sample loses signal at 1730 cm-1, the tip at 1120 cm-1 appears clearly in the AE2 sample as oscillation. stretching C-O-C. In AE2 sample, the absorption band at about 3600 cm-1 is due to the stretching oscillation of the structural OH groups of montmorillonites, bands corresponding to AlAlOH and AlMgOH bending vibrations are observed at 916 cm-1 first. A complex band at 1040 cm-1 is related to the stretching vibrations of the Si-O group, while the bands at 480 cm-1 are due to the Al – O – Si and Si – O – Si bending vibrations, respectively. Noses below 500 cm-1 are typical for quartz.
Analysis of the Surface Morphology of the Material
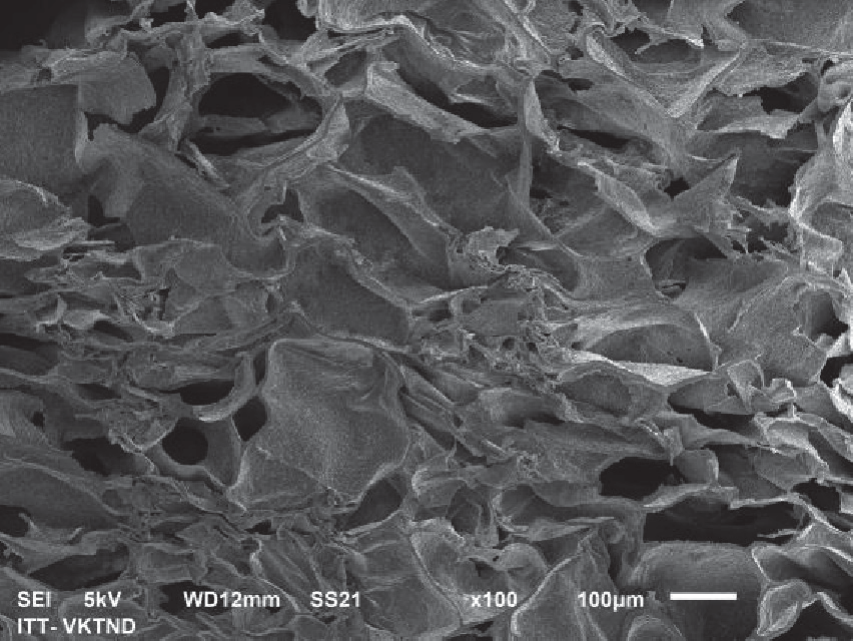
The microstructural and morphological characteristics of the materials were characterized by scanning electron microscopy (SEM) shown in Fig. 3. Overall, the SEM results show a complex matrix, they are randomly arranged without a certain order but overlap with a rather rough surface. At the same time, the SEM image also shows that the fibers with different sizes are closely linked to form a homogeneous mass. The image also shows that the synthesized sample has a hollow structure with pores inside the material, which is consistent with the morphological structure of the airgel material.
Analysis of Nitrogen Adsorption and Desorption Characteristics
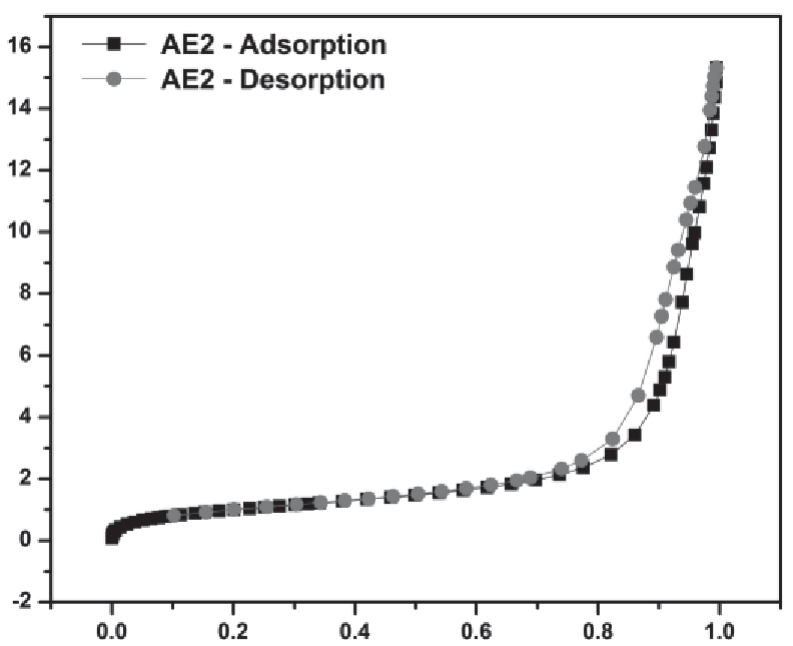
Fig. 4 depicts nitrogen adsorption and desorption curves of AE1 and AE2 aerogel composites. The results show that the isotherm curves belong to type IV according to IUPAC classification, so that most of the pores of the material are medium in size and have a very uniform pore size distribution. The AE2 material has a surface area of 6.02 m2/g and a total pore volume of 0.014 cm3/g. The AE2 material has an increased pore surface area.
The pHpzc Value of the Material
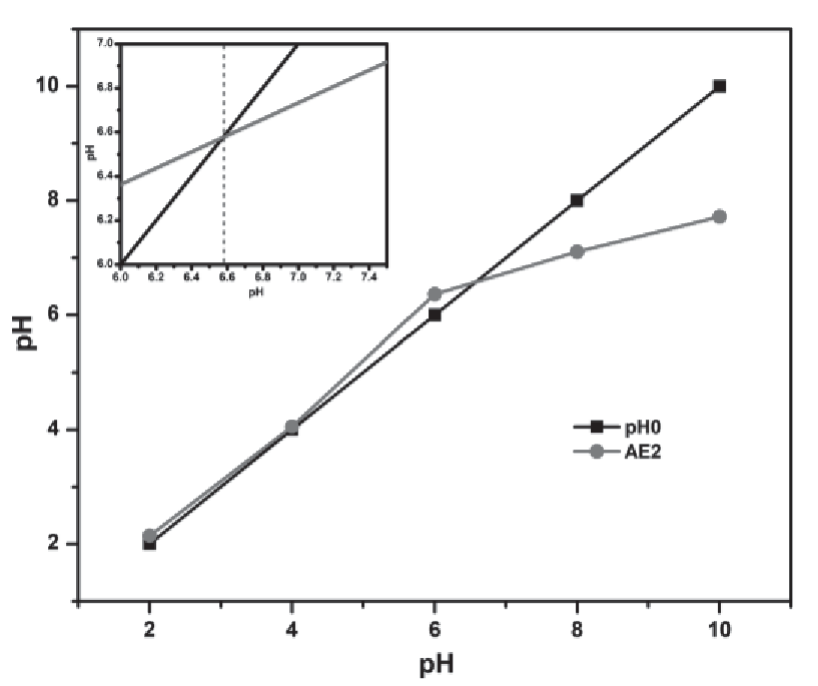
The pHpzc parameter of the material describes the state that the charge density on the surface when the pH variation reaches a value of zero. Fig. 5 shows that the pHpzc value of AE2 material reached the value of 6.6. Note that when the pH of the solution is lower than the pHpzc value, the surface of the material is positively charged, resulting in electrostatic forces between the anions and the positively charged functional groups on the surface. In contrast, when the surface is negatively charged at pH>pHpzc, there is a tendency to attract positively charged cations from the solution.
Evaluation of Factors Affecting the Adsorption Process of Materials
Effect of Adsorption Time
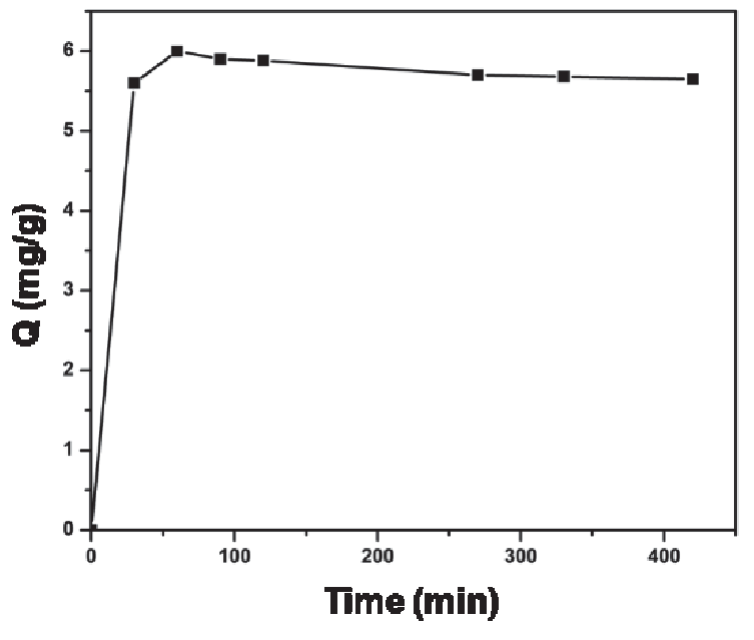
Time is one of the important physical factors that directly affect the adsorption of materials. Fig. 6 shows that the material reached equilibrium at 270 min (5.65 mg/g) and reached the highest value of adsorption capacity at 60 min (6.05 mg/g). After about 90 minutes, the material began to reach equilibrium, the adsorption capacity decreased insignificantly. In the initial stage (0-30 minutes), the material is not stable, so the adsorption takes place very quickly. After that, the material continued to adsorb but tended to decrease until reaching the maximum point. The process of desorption takes place soon after and is gradually brought back to equilibrium.
Effect of pH
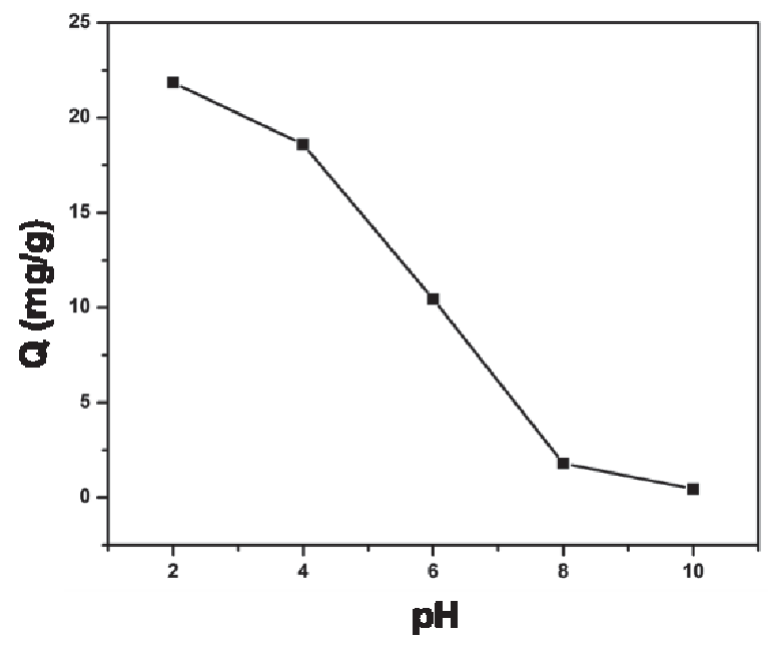
The pH value is one of the important factors determining the adsorption capacity of a material because it affects the molecular form of TCC in solution. In this experiment, we will investigate the effect of pH on the TCC adsorption capacity of the materials in the pH range from 2-10. Based on the graph of Fig. 6, we can easily see that the adsorption capacity decreases with higher pH. The material reached its maximum adsorption at pH 2 (21.85 mg/g) and at pH 10 it seemed that no adsorption occurred. Therefore, we choose pH 2 as the best pH value to conduct the next experiments. In general, the formation of the surface charge on the adsorbent and the ionization of the adsorbent in solution are the two factors that are influenced by the pH value. The main principle is based on the electrostatic interaction between the adsorbent and the adsorbent [19].
Effect of the Amount of Adsorbent
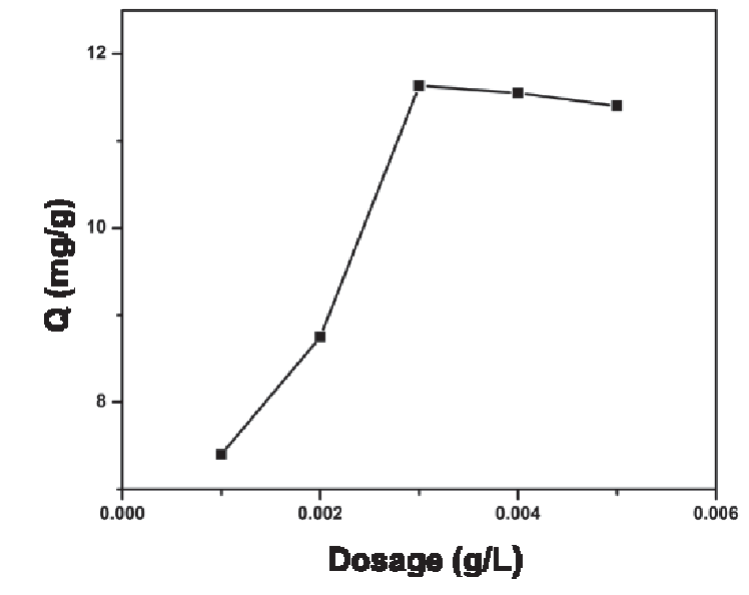
The effect of adsorbent dosage on antibiotic removal is shown in Fig. 8. Based on the graph, we can see that at the most effective dose, the adsorption capacity is 11.63 mg/g at 3 mg (0.15 mg/L). In the first stage, the adsorption capacity increased rapidly as the amount of adsorbent increased. The adsorption capacity is proportional to the adsorbent dose, possibly due to the increased surface area of the adsorbent and the presence of more effective sites. Then, when the dose was increased further, the adsorption capacity did not change significantly and tended to decrease. This can be explained by the inactive sites of the adsorbent and the establishment of equilibrium between the TCC molecules on the adsorbent and in solution. Therefore, optimal adsorption is achieved when the adsorbent concentration is 0.15 mg/L. A study on TCC antibiotic adsorbent aerogel material in 2017 also conducted an experiment to investigate adsorbent concentrations from 0.5-2 g/L. As a result, the optimum adsorption was at an adsorbent concentration of 1 g/L [20].
Effect of Adsorbent Concentration
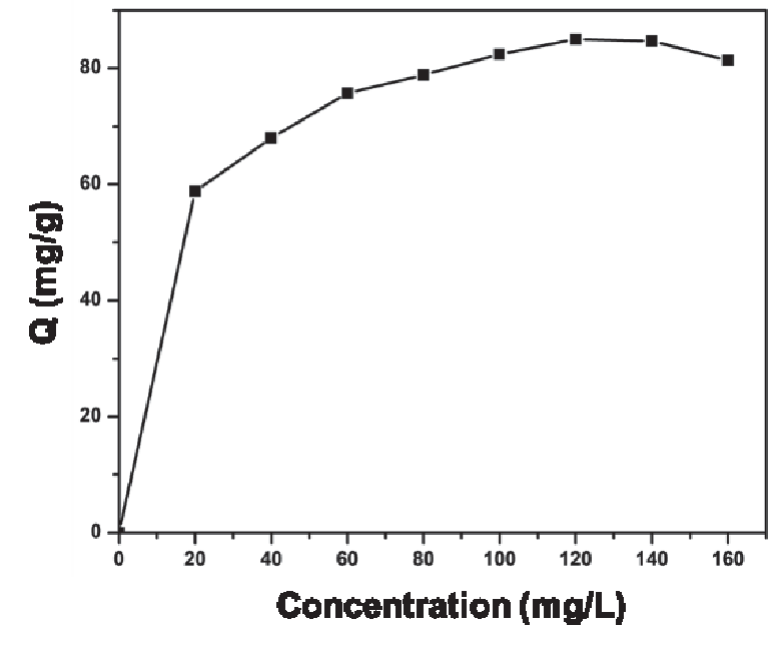
The initial concentration of antibiotics in wastewater is also an important factor to be investigated. In this experiment, we will investigate the effect of initial concentration on the absorbance of the material performed in the range of 20-160 ppm. Fig. 9 shows the maximum adsorption capacity at the initial concentration of 120 ppm. The increase of the initial concentration makes the adsorption process strong because it increases the interaction of antibiotic molecules into the vacant positions on the surface of the material. But if the increase continues like this, the adsorption efficiency of the material will reach saturation and the adsorption capacity will also decrease gradually due to the repulsion between the antibiotic molecules on the surface of the material and the molecules. The antibiotic in the solution is produced and interferes with the adsorption process.
Research on Adsorption Isotherm Models
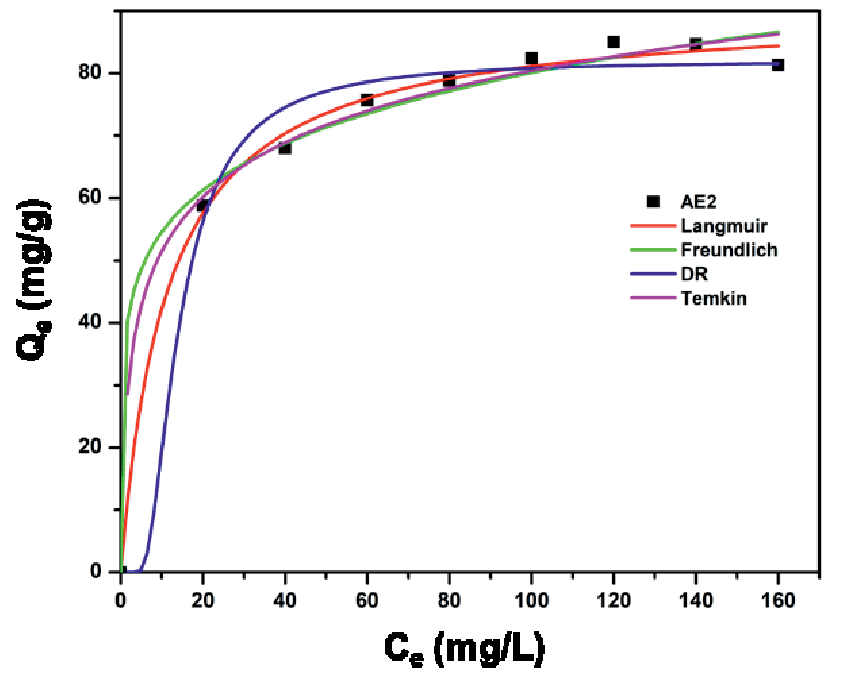
The adsorption isotherm models of TCC on experimental data of AE2 materials are converted into various forms based on the adsorption isotherm models: Langmuir, Freundlich, Temkin, and D-R.
As can be seen in Fig. 10, the four models fit well with the experimental data and the calculated R2 is all greater than 0.9 as described in Table 1. However, based on the value of R2, the correlations of the models appear in the following order: D-R<Freundlich<Temkin< Langmuir. Therefore, the adsorption occurs on a surface according to the mechanism of the Langmuir model.
Studying Adsorption Kinetic Models
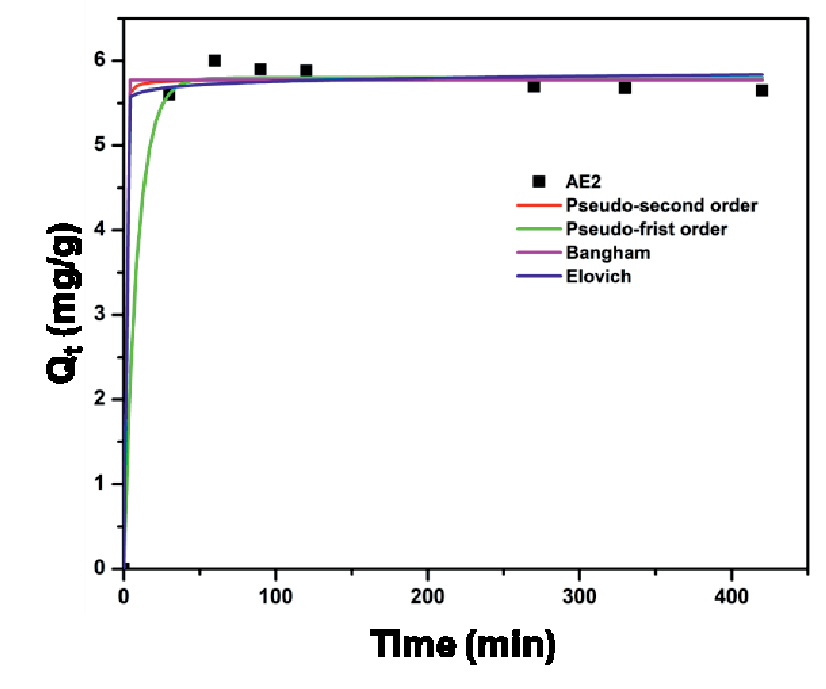
The adsorption kinetics of aerogel composites (AE2) were studied using four models including PFO, PSO, Elovich and Bangham. The kinetic constants are also shown in Table 2 and Fig. 11.
Based on Table 2, the correlation coefficient (R2) for all adsorption kinetic models is very high (R2 = 0.99), showing good statistical compatibility between the survey data. However, the first-order kinetic model is the most compatible adsorption kinetic model among the four given models with the highest correlation coefficient (R2 = 0.92). In general, the above results show the high compatibility and superiority of this model for the TCC antibiotic autoclaving of the material.
As seen in Fig. 11 and Table 2 the pseudo-first-order pseudo-dynamic model is said to be the best fit for the adsorption data for arogel materials, as evidenced by the highest correlation coefficient (R2 = 0.995). Besides, the relative error values (MRE) of the pseudo-first order (1,890%), pseudo-second order (2,291), Elovich (2,683%) and Bangham (10,065%) models are all in the same range. below 10%. This shows that the models are reliable, and the fit based on the total error (SSE) shows that the pseudo-first order and pseudo-second-order kinetic models are the best fit for the adsorption process. material (lowest error). The results show that the TCC adsorption on the airgel composite is controlled mainly by the chemical process. This compatibility has been demonstrated by similar studies.
Comparison of the Results with Other Studies
To compares the effectiveness of TCC antibiotic treatment, Table 3 summarizes the results of maximum adsorption capacity of different materials. Compared with other studies, the maximum adsorption capacity is very high in this study, proving that aerogle composite materials can be a promising material for the adsorption and removal of TCC antibiotics. and for most antibiotics in general in aquatic environments.
Table 1.
Adsorption isotherm constant.
Table 2.
Adsorption kinetic constants.
Table 3.
Comparison of TCC antibiotic adsorption capacity of materials from previous studies.
Conclusions
Successfully researched aerogel composite materials (AE2) capable of adsorbing tetracycline antibiotics (TCC). The results of structural characterization of the material are consistent with the previous study acc1 and suitable as an adsorbent. The results of the investigation into TCC antibiotic adsorption showed that the highest adsorption capacity reached 0 ppm in the following conditions: pH 2, initial TCC concentration 120 mg/l, adsorbent dosage 0.003 g/L, 60 min adsorption time. The composite aerogel (AE2) adsorbent in this study is a potential candidate for an adsorbent to treat antibiotic contamination in the aquatic environment. The experimental data are consistent with the pseudo-first-order kinetic model and the Langmuir kinetic model. Overall, the results show that the composite aerogel (AE2) exhibits potential antibiotic adsorption applications in contaminated water.

