

Introduction
Aquatic life is very important for all biological life and human activities, from the smallest organism to the largest one. Although ¾ of the world is covered with water, only 2.5% of it is fresh water. Of this freshwater, 70% is in glaciers, soil, atmosphere, and underground waters and is not usable. The rapid growth of the world population with a constant amount of water available increases the need for water on a daily basis and it creates water stress. As stated in a report by the World Health Organization and United Nations Children's Fund, 3 out of 10 individuals on earth have no reliable tap water in their houses, whereas 6 out of 10 individuals have no sufficient sanitation [1]. Given this joint monitoring report, it was determined that many individuals, especially those living in rural areas, had no access to reliably managed water and sanitation services. It is expected that, as of the year 2050, the number of countries having water problems and the number of people living under those conditions will significantly increase, and almost half of the global population, which the United Nations projects to be 10 billion as of the year 2050, will have water insufficiency problem.
The availability of water in sufficient amounts and at sufficient quality is very important for aquatic ecosystems and organisms and it is among the main natural sources that will influence food safety, sustainable development, and human future. The release of domestic and industrial wastes into rivers, barrages, lakes, and seas without sufficient treatment poses an important risk for these ecologic systems [2]. The recipient of radioactivity originating from point and non-point sources, and organic and inorganic matters, wastes, detergents, heavy metals, pesticides, and oil and its derivatives is the water [3]. These pollutants have toxic effects on the organisms in the aquatic ecosystem and they also threaten human health via the food chain [4]. For a healthy human life, food chain, and hydrological cycle, it is very important to protect current water sources and regularly monitor the quality. Since water is a vital component of all ecosystems and human life, there are ongoing studies on the characteristics, availability, and quality of water aquatic ecosystems. For effective water management, it is very important to collect reliable data on water quality, determine the spatial and temporal changes in water quality on a timely basis, detect pollutant sources, reveal the water quality in its simplest form, check pollution in natural waters, and take measures.
In recent years, the water quality index (WQI) has become an important and popular instrument in assessing especially freshwater quality by presenting water quality data incorporating different units and parameters in a more understandable form and allowing water quality experts and non-expert individuals to gain information about water quality and use this information easily, rapidly, and understandably [5, 6]. Principal component analysis (PCA), cluster analysis (CA), principal component analysis (PCA), factor analysis (FA), and irrigation water quality parameters are extensively employed in the assessment of water quality, enabling the interpretation of intricate datasets [7-10]. These methods also make it easier to determine water pollution sources, determine and interpret the natural and anthropogenic factors influencing the temporal and spatial changes in water quality, and suggest fast solutions for pollution problems [11-13]. Moreover, they also offer saving from time and money thanks to the information they provide to rapidly interpret the data and monitor the study area. The present study aims to determine monthly, seasonal, and spatial changes in water samples taken from stations representing the Evrenye Stream, reveal water quality characteristics, and determine the pollution level and pollutants by using both WQI and statistical methods in interpreting the data more simplistically and understandably, as well as having pollutants monitored in future studies in order to take measures.
Methods and Materials
Study Area
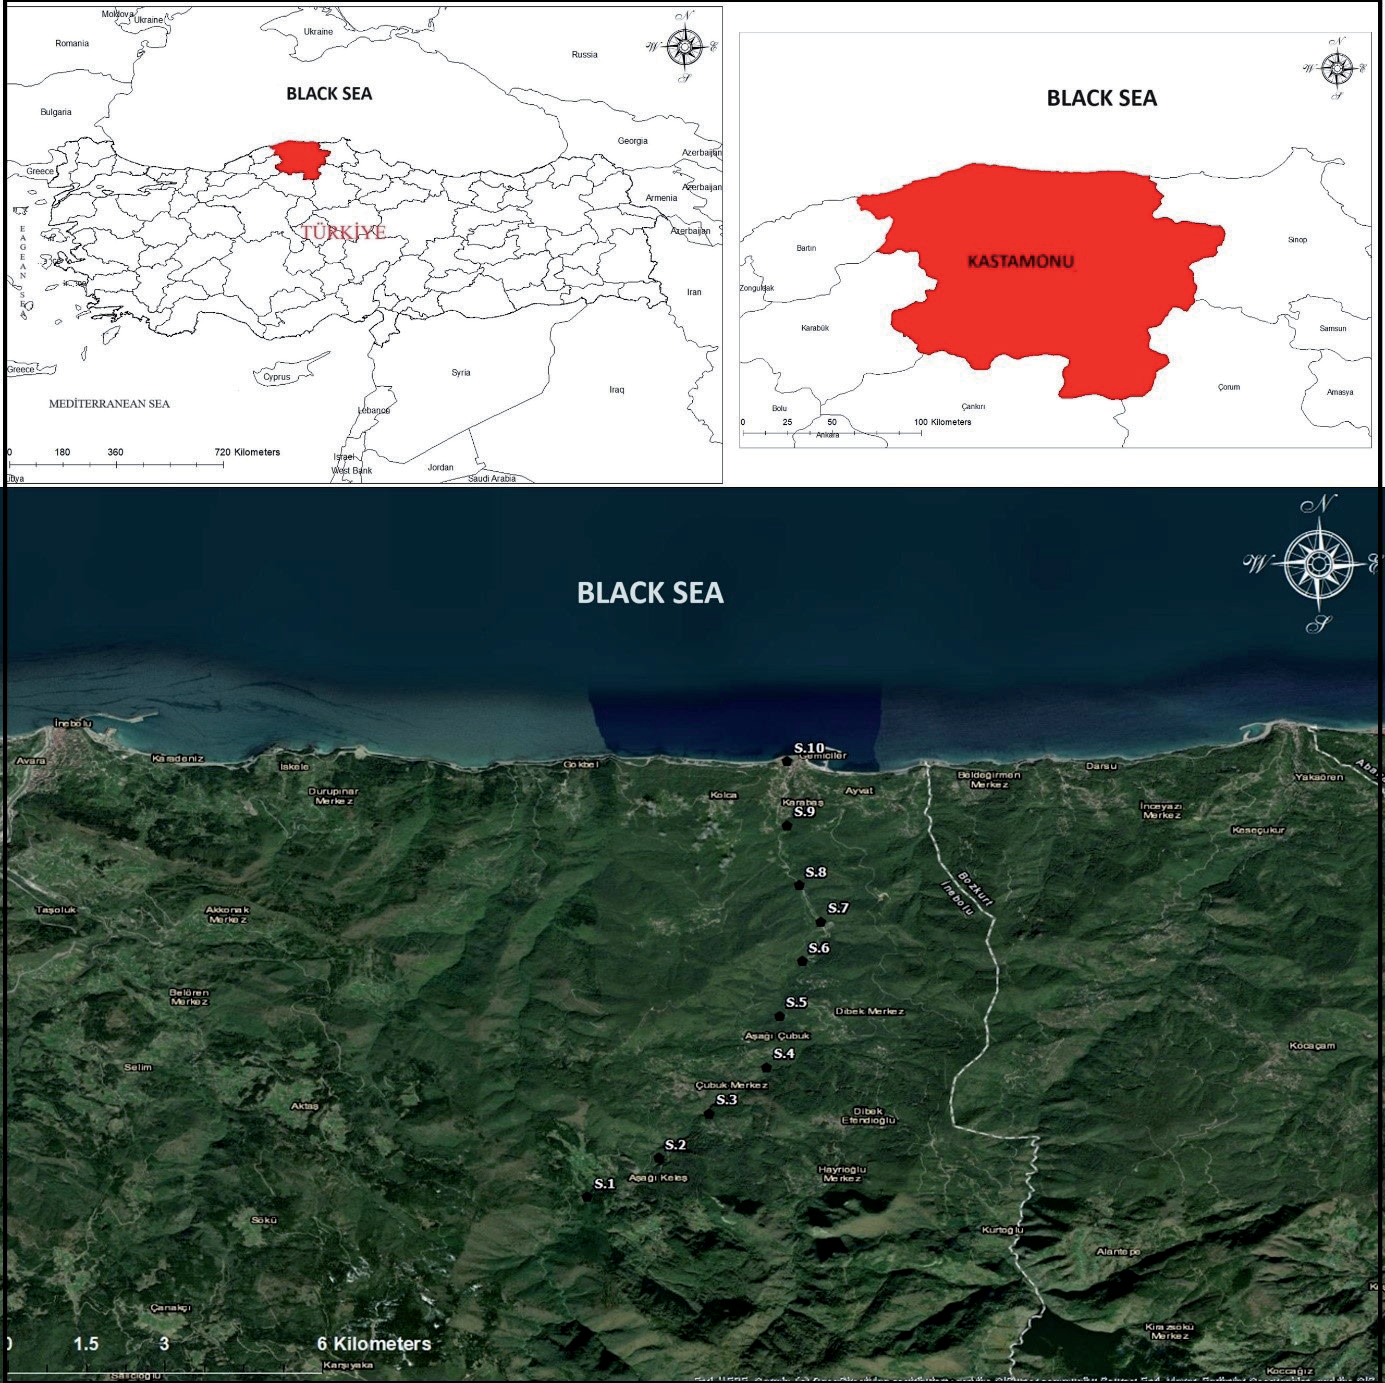
The Evrenye Stream, which is situated in the Western Black Sea region of Anatolia, reaches the sea in a village where the sun rises and sets over the sea. The distance to the Kastamonu city center is 102 km, and it is 12 km to the İnebolu district center (Fig. 1). The stream, which is in the district land that is high and has a rough structure, has deep beds to send its water to the sea. In general, the typical Black Sea climate is seen in the region. The level of precipitation is much higher in winter months in comparison to summer. The annual mean temperature in İnebolu is 10.9 °C, while the annual mean precipitation is 1060 mm. The annual mean temperature is approx. 18.1 °C.
Sampling and Analysis Methodology
Water samples were taken from 10 stations on the Evrenye Stream between January and December 2021 (Fig. 1). The sampling has been conducted on a monthly monitoring basis. Water samples for heavy metal analysis were collected using 2.5 L sample containers pre-washed with acid and then the samples were transported to the laboratory in a large thermos and stored in a refrigerator at 4°C until analysis [11].
In-situ measurements including dissolved oxygen (DO), water temperature (WT), electrical conductivity (EC), and salinity were made using a YSI 556 MPS multi-parameter instrument. Phosphate phosphorus (PO4-3-P), chemical oxygen demand (COD), ammonium nitrogen (NH4+-N), nitrite-nitrogen (NO2- N), nitrate-nitrogen (NO3 - N), biological oxygen demand (BOD5), total hardness (TH), total alkalinity (TA), sodium (Na+1), sulfite (SO3-2), sulfate (SO4-2), magnesium (Mg+2), calcium (Ca+2), chlorine (Cl-), and potassium (K+) parameters were analyzed using standard laboratory methods [6, 14, 15]. The analyses of metals including zinc (Zn+2), nickel (Ni+2), cadmium (Cd+2), copper (Cu+2) ferrous (Fe+2), and lead (Pb+2) were carried out by Perkin Elmer Optima 2000 DV ICP-OES [6, 14, 15].
Irrigation Quality Parameters
Agricultural products of high quality can be obtained through the use of quality soil, proper irrigation water, and accurate agricultural practices. The chemical properties of irrigation water can directly impact the presence of deficiencies or toxicity in herbal products, and may also have an indirect effect on nutrient availability. To assess the irrigation water quality of the Evrenye Stream, various parameters including sodium absorption rate (SAR), residual sodium carbonate (RSC), sodium percentage (% Na), magnesium hazard (MH), and Kelley Ratio (KR) values were calculated using Formulas (1-5) respectively (Table 1) [6, 16]. Following the computation of these values, the concentrations of elements were transformed from mg L-1 to meq L-1 [6, 17, 18].
Water Quality Index (WQI)
In assessing the water quality of the Evrenye Stream, the Water Quality Index (WQI), a simple yet comprehensive indicator, was calculated as described by Wang et al. [19](6).
Table 1.
Standard and calculated irrigation water quality indices for sodium percentage (Na (%)), sodium absorption rate (SAR), residual sodium carbonate (RSC), Mg hazard, and Kelley Ratio (KR) in waters (meq L-1) (Ravikumar et al., 2013; Jehan et al., 2020; Mutlu and Aydın Uncumusaoğlu, 2022).
The term “wi” represents the eigenvalue for each principal component from the PCA results performed with 28 parameters representing the relative importance of each water quality parameter and the weight attributed to each parameter based on the factor loading [6, 20, 21] (7); ci” is the detected concentration of the parameters in the water samples; si is the guideline value for each parameter [14, 19, 22]. Wi is the relative weight and is calculated by the equation [20, 21] (7):
Five classifications are made for the interpretation of the calculated WQI values: 0 ≤ WQI < 50 indicates excellent water quality, 50 ≤ WQI < 100 indicates good water quality, 100 ≤ WQI < 200 indicates poor water quality, 200 ≤ WQI < 300 indicates very poor water quality and WQI>300 indicates water not suitable for drinking [20, 21].
Statistical Analysis Methodology
The statistical analysis of the data obtained was carried out using the IBM SPSS 25 statistical package program. Descriptive statistical analysis and significance tests (0.01 and 0.05) were conducted through One-Way ANOVA analysis of parameters to identify differences between stations and seasons. Tukey's multiple tests were employed to determine significant differences between mean values and Pearson's correlation index (PCI) was utilized to analyze the correlations among the parameters [23].
For the spatial and temporal elucidation of the Evrenye Stream's surface water quality, large datasets underwent multivariate Hierarchical Cluster Analysis (HCA), a technique aimed at classifying datasets into clusters based on similarities or differences [19]. Ward’s method served as the similarity criterion for HCA [24]. Principal Component Analysis (PCA) was employed to assess spatial and temporal variations in water quality, preceded by Kaiser–Meyer–Olkin (KMO) and Bartlett's tests. With a KMO value of 0.886 and Bartlett's test yielding a significant result (P = 0), the PCA test was deemed suitable for the purpose. Data were standardized using Z-scale transformation to avoid misclassification due to significant differences in the datasets [13].
Results and Discussion
Water Quality Analysis
Twenty-eight physicochemical parameters were examined using the water samples collected monthly from 10 stations on the Evrenye Stream for a year (January-December 2021). During the period of the study, the differences between the mean values of the stations were found to be statistically significant (P < 0.05). Nevertheless, no significant differences were observed between seasons in terms of annual mean values (P > 0.05). Upon examination of the analysis results, the average and standard deviation values of the parameters are as follows: DO = 11.21±1.46 mg L-1, salinity =0.42±0.17‰, pH=8.68±0.20, WT =11.10±6.72°C, EC = 320.22±28.17 μS cm-1, COD =0.94±0.67 mg L-1, SS matter =2.35±1.30 mg L-1, BOD5 = 0.40±0.39 mg L-1, [Cl-] = 7.61±1.33 mg L-1, [PO43-] = 0.02±0.02 mg L-1, [SO42]-= 32.14±25.74 mg L-1, [SO32- ] = 1.68±1.10 mg L-1, [Na+] = 42.41±10.89 mg L-1, [K+] = 7.08±1.58 mg L-1, TH = 266.11±15.40 mg L-1, TA =276.55±15.52 mg L-1, [Mg2+] =19.52±0.65 mg L-1, [Ca+2] =18.99±1.08 mg L-1, [NO2-] = 0.0004±0.0005 mg L-1, [NO3-] =1.06±0.59 mg L-1, [NH4+] = 0.0006±0.0002 mg L-1, [Fe2+] = 0.008±0.004 mg L-1, [Pb2+] =1.15±0.56 µg L-1, [Cu2+] =13.63±7.45 µg L-1, [Cd2+] =0.62±0.40 µg L-1, [Hg2+] = 0.0061±0.004 µg L-1, [Ni2+] = 5.78±2.90 µg L-1, and [Zn2+] = 7.26±5.05 µg L-1.
Temporal Changes in Water Quality
In aquatic ecosystems, crucial correlations such as bacterial activity, photosynthesis, nutrient availability, and stratification provide valuable insights into temporal changes in water quality. In aquatic ecosystems, Dissolved Oxygen (DO), essential for organism survival, reached its peak in July at 12.77 mg L-1, while its lowest recorded level was observed in September at 7.27 mg L-1. DO exhibited a statistically significant negative correlation (P < 0.05) with salinity, pH, WT, COD, BOD5, [NO2-], and [Cd2+] (r > 0.500) (Table 2). For aquatic life, the DO level in water should exceed 5 mg L-1. The stream poses no danger in terms of DO levels. Regarding DO, the stream was classified as Class I, signifying high-quality water, according to the standards outlined in the Surface Water Quality Regulation of Turkey (SWQR) and the World Health Organization (WHO) guidelines [14, 22].
The salinity of water for agriculture is important in terms of plant health, soil quality, irrigation systems, and environmental sustainability. The use of saline and drainage waters in irrigation due to insufficient water quantity and quality can lead to agricultural challenges [25].
Corresponding to the regional climate, the lowest salinity level was recorded as 0.21 psu in December, a winter month, while the highest level was observed in September (0.81 psu). Salinity demonstrates a statistically significant (P < 0.05) and positive correlation with the concentrations of WT, EC, SS, COD, BOD5, [SO42-], [SO32-], and [NO3-] (r > 0.750) as shown in Table 2. The Evrenye Stream poses no threat to agriculture or aquatic life in terms of salinity. The pH value shows a rising trend peaking in December (9.10) before declining to its lowest point in March (8.28). This fluctuation is attributed to environmental photosynthetic activity. Low pH values enhance the toxicity of heavy metals and pose a risk to the aquatic ecosystem. This parameter exhibits a statistically significant (P < 0.05) and positive correlation with salinity, WT, EC, SS, COD, BOD5, as well as the concentrations of, [PO43-], [SO32-], [NO3-], and [Cd2+] (r > 0.50) as indicated in Table 2. Considering the general chemical and physicochemical parameters in standards set by the WHO and SWQR, this stream's pH level falls into Class I (6-9), indicating 'high-quality water' [14, 22].
The water temperature reached its lowest level (4.1°C) in February and its highest level in September (26.10°C). WT exhibits a statistically significant (P < 0.05) and positive correlation with EC, SS, COD, BOD5, as well as the concentrations of [SO42-] and [SO32-] (r > 0.750), while it demonstrates a significant negative correlation with chloride concentration [Cl-] (Table 2). WT poses no threat to organisms inhabiting the water.
The electrical conductivity of water, influenced by the solubility of rocks in contact with the water, peaked in September (380.62 μS cm-1) and reached its lowest level in December (272.26 μS cm-1) in this stream. EC level exhibits a statistically significant (P < 0.05) and positive correlation with salinity, EC, SS, COD, BOD5, [SO42-], [SO32-], and [NO3-] (r > 0.750) (Table 2). The mean EC value in the Evrenye Stream falls into Class II (less polluted water) according to SWQR (<1000 μS cm-1) standards [14, 22]. The EC value obtained in this study is considerably higher than the results reported in a previous study on the Karaboğaz Stream [10].
The Suspended Solids (SS) level is influenced by the volume of water brought in by floods and the phytoplankton carried by precipitation water into the stream. In the Evrenye Stream, the lowest SS levels were recorded in March, September, October, November, and December (0.48 mg L-1), but they increased steadily until September, reaching the highest level (5.40 mg L-1). The level of SS demonstrates a statistically significant (P < 0.05) and positive correlation with salinity, WT, EC, COD, BOD5, as well as the concentrations of [SO42- ], [SO32-], and [NO3-] (r > 0.750) as presented in Table 2. The total SS in the Amba River, the main source of wastewater and sewage discharge into rivers, was found to be significantly higher than observed in this study [26].
COD, one of the parameters determining if the water quality originates from the organic matter, ranged between 0.22 (all months) and 2.46 mg L-1 (September) in the present study. This parameter has a statistically significant (P<0.05) and positive relationship with salinity, WT, EC, SS, BOD5, [SO42-], [SO32-], and [NO3-] (r>0.750) (Table 2). This parameter remained below the defined threshold level, thus classified as Class I "high-quality water" (˂ 25 mg L-1) according to standards outlined by WHO and SWQR [14, 22]. In the Evrenye Stream, BOD5, which is an indicator of water pollution level, reached its lowest levels in November and December, and the highest level in July (1.98 mg L-1). BOD5 level was found to have a statistically significant (P<0.05) and positive relationship with salinity, WT, EC, SS, COD, [SO42-], and [SO32-] (r>0.750) (Table 2). In this current investigation, BOD5 levels remained below the threshold established by SWQR, thus qualifying as Class I "high-quality water" (˂ 4 mg L-1) according to guidelines outlined by standards [14, 22]. The concentration of chloride ions in the stream exhibited its lowest measurement in August (4.10 mg L-1) and its highest measurement in June (10.50 mg L-1). Chloride level was found to have a statistically significant (P<0.05) and negative relationship with salinity, pH, COD, EC, SS, BOD5, WT, [SO42-], and [SO32-] and a negative relationship with DO and [PO4] (Table 2).
COD, a parameter indicating the presence of organic matter in water, varied between 0.22 (all months) and 2.46 mg L-1 (September) in the current study. This parameter demonstrates a statistically significant (P < 0.05) and positive correlation with salinity, WT, EC, SS, BOD5, as well as the concentrations of [SO42- ], [SO32-], and [NO3-] (r > 0.750) as illustrated in Table 2. The COD levels remained below the threshold and were classified as Class I 'high-quality water' (˂ 25 mg L-1) according to the standards [14, 22]. In the Evrenye Stream, the Biological Oxygen Demand, an indicator of water pollution, reached its lowest levels in November and December and its highest level in July (1.98 mg L-1). BOD5 levels showed a statistically significant (P < 0.05) and positive correlation with salinity, WT, EC, SS, COD, (r > 0.750) (Table 2). The levels of BOD5 exhibited a statistically significant (P < 0.05) and positive correlation with salinity, WT, EC, SS, COD as well as the concentrations of [SO42-], and [SO32-] (r > 0.750) as delineated in Table 2.
In the scope of this investigation, BOD5 levels remained below the threshold stipulated by SWQR guidelines, thus qualifying the water as Class I 'high-quality' (˂ 4 mg L-1) according to standards outlined by standards [14, 22]. Furthermore, the concentration of chloride ions in the stream reached its nadir in August (4.10 mg L-1) and its zenith in June (10.50 mg L-1). Chloride levels demonstrated a statistically significant (P < 0.05) and negative correlation with salinity, pH, COD, EC, SS, BOD5, WT, [SO42-], and [SO32-], and a negative correlation with DO and [PO43-] (Table 2).
Throughout the year, the phosphate ion concentration in the Evrenye Stream remained consistently low, with a peak observed in July at 0.078 mg L-1. It was undetectable in January and displayed a gradual increase thereafter. The phosphate ion levels in this stream fall within Class I (<0.16 mg L-1), complying with the threshold limit established by SWQR guidelines, thus earning classification as Class I 'high-quality water' as per standards [14, 22]. The sulfate ion concentration in the Evrenye Stream ranged from 0.22 mg L-1 (February) to 77.53 mg L-1 (September), within the acceptable limit of 90 mg L-1 for sulfate in natural waters. Statistically significant (P < 0.05) and positive correlations were observed between sulfate ion levels and salinity, WT, EC, SS, COD, BOD5, [SO32-], and [NO3-] concentration (r > 0.750) as depicted in Table 2.
The sulfide ion concentration in this stream ranged from 0.03 mg L-1 (February) to 4.22 mg L-1 (September). It exhibited a statistically significant (P < 0.05) and positive correlation with salinity, pH, WT, EC, SS, COD, BOD5, [SO42-], and [NO3-] (r > 0.750) as illustrated in Table 2. Based on sulfide ion concentration, the stream was categorized as Class II (≤2 mg L-1) 'Less polluted water' according to standards [14, 22]. It is noteworthy that the sulfide concentration in this stream surpassed that of Bektaş Pond, indicating a variation in pollution levels [27].
The sodium ion concentration in the Evrenye Stream reached its minimum level in April at 26.00 mg L-1 and peaked in June at 75.52 mg L-1, maintaining consistency with the original statement's meaning. Sodium levels exhibited a significant (P < 0.05) and positive correlation with Total Alkalinity (TA), copper ion concentration, and zinc ion concentration (r > 0.750) (Table 2). The sodium value range in the Tigris River (Iraq) was found to be considerably higher than observed in this study [28]. Potassium ions are a contributing factor to water taste, with their concentration in the Stream observed at its nadir in January (3.18 mg L-1) and zenith in June (10.08 mg L-1).
In natural waters, Total Hardness (TH), calcium, and magnesium chloride vary based on concentrations of nitrate bicarbonate compounds, as well as slightly depending on the concentrations of strontium, ferrous, and aluminum ions. In the current investigation, the Total Hardness (TH) exhibited its minimum level in February (244.02 CaCO3 mg L-1) and reached its peak in June (307.06 CaCO3 mg L-1), while demonstrating a statistically significant (P < 0.05) and positive correlation with [NO3-], [Na+], and TA with a correlation coefficient exceeding 0.750, as presented in Table 2. In this study, TH was lowest in February (244.02 CaCO3 mg L-1) and highest in June (307.06 CaCO3 mg L-1). This parameter showed a statistically significant (P < 0.05) and positive correlation with [NO3-], [Na+], and TA (r > 0.750) (Table 2). Total alkalinity ranged between 255.19 and 320.04 CaCO3 mg L-1, similar to TH. The parameter displayed a statistically significant (P < 0.05) and positive correlation with magnesium concentration (r = 0.729) as documented in Table 2. Calcium and magnesium cations present in water contribute to enhancing soil permeability, thus underscoring their significance in determining the suitability of stream water for irrigation purposes. The magnesium concentration within the Evrenye Stream ranged from 18.76 mg L-1 in February to 22.58 mg L-1 in July. Magnesium levels exhibited a statistically significant (P < 0.05) and positive correlation with calcium concentration (r > 0.750) as indicated in Table 2. Moreover, calcium levels were observed to be at their lowest in October (17.62 mg L-1) and peaked in April (22.02 mg L-1) within the scope of this study.
Within the context of this research, the nitrite concentration in the Evrenye Stream varied between 0 and 0.0038 mg L-1, reaching its peak in April. The concentration of nitrate nitrogen ranged between 0.28 and 2.42 mg L-1. The stream falls into Class I for nitrate nitrogen (≤ 0.01 mg L-1) and Class II 'less polluted water' for nitrate nitrogen (<10 mg L-1) [14, 22]. In a previous study on the Seydisuyu River, the nitrate value was found to be higher than in the present study [29]. The ammonium concentration in the Evrenye Stream ranged between 0.0004 (January, February) and 0.0017 (December) mg L-1, indicating Class I (< 0.2 mg L-1) ammonium nitrogen, which corresponds to 'high-quality water' [14, 22].
In an aquatic environment, autotrophic bacteria require ferrous ions to secrete many enzymes. The ferrous concentration within the Evrenye Stream fluctuated between 0.0010 and 0.0230 mg L-1. This parameter exhibited a statistically significant (P < 0.05) and positive correlation with [Na2+], [Cu2+], TH, TA, [Mg2+], [Ca2+], [Pb2+], [Cu2+], [Zn2+], and [Hg2+] with correlation coefficients exceeding 0.700, as outlined in Table 2. In this study, the ferrous concentration was found not to reach a hazardous level (36-101 mg L-1) [14, 22].
Heavy metals with anthropogenic origins may accumulate in the livers, kidneys, and muscles of aquatic organisms [6]. In this research, the lead concentration exhibited a range of 0.20 to 2.60 µg L-1, reaching its peak in July. Moreover, lead demonstrated a positive relationship with [Cu2+] and [Zn2+] ions, with a correlation coefficient exceeding 0.750 as outlined in Table 2. It was determined that the lead concentration posed no threat within the range of 1.2-14 µg L-1[14]. The copper concentration in the Evrenye Stream ranged between 0 and 32 µg L-1, with the highest level recorded in May. It exhibited a significant positive relationship with [Na2+], [Pb2+], and [Ni2+] parameters (r > 0.750) (Table 2). According to SWQR, this stream was considered very hazardous in terms of copper (1.3- 5.7 µg L-1) [14, 22]. Copper values found in Swat and Huaihe streams were higher than those observed in the present study [19, 30]. The cadmium level in this stream ranged between 0.1 µg L-1 (February and August) and 1.8 µg L-1, with the highest value recorded in October. Pearson’s correlation analysis indicated that [Cd2+] had a significant and strong relationship with SS, pH, COD, BOD5, and [Mg2+], and a negative relationship with DO (Table 2). According to SWQR, the cadmium concentration in this stream was deemed dangerous and classified as Class IV (<1.5 µg L-1), indicating 'very polluted water. The cadmium concentration in the Yağlıdere stream was found to be higher, similar to the present study, whereas the concentration in the Chenab River was observed to be low [31, 32].
Table 2.
Pearson correlation matrix between variables.
In the present study, mercury concentration ranged between 0.001 and 0.0210 µg L-1 and the highest level was observed in October. This parameter was significantly (P < 0.05) and highly positively correlated with SS, K, TH, TA, [Ca2+], [Pb2+], [Ni2+], and [Zn2+] (r>0.60) (Table 2). It was determined that, according to the inland water quality criteria, Evrenye Stream was found to not be dangerous (<0.07 µg L-1) [14, 22].
The nickel concentration observed in this study varied between 2.0 and 13.0 µg L-1, with the highest recorded value occurring in April. In the present study, nickel doesn’t pose a danger. Zinc concentration in this stream ranged between 0.0 and 23.00 µg L-1. The highest concentration was found in May. Given the results obtained from PCA, zinc was found to have a statistically significant (P < 0.05) and highly positive relationship with [Hg2+], [Ni2+], [Cu2+], [Pb2+] [Fe2+], [Ca2+], TA, and TH (r>0.70). According to guidelines., zinc concentration doesn’t pose a threat to this aquatic environment (5.33-76 µg L-1) [14, 22].
Irrigation Water Quality Analyses
As the Evrenye Stream is used for agricultural activities, irrigation water quality parameters such as % Na, SAR, RSC, MH, and Kelley ratio (KR) were calculated and the results are given in Table 1 [6, 17, 30]. % Na is one of the parameters used to determine sodium damage from irrigation waters. The mean % Na value in this stream was found to be 30.37; the lowest value was observed in Station 1 in April (30.16% Na), whereas the highest value was found in Station 7 in June (51.89% Na). This stream was deemed "permissible" in terms of % Na (Table 1) [17, 30].
In this research, the average Sodium Adsorption Ratio (SAR) values, utilized for identifying sodium-related damage, were determined to be 1.63 meq L-1. The minimum SAR value was recorded at Station 1 during April (1.01 meq L-1), while the maximum SAR value was observed at Station 10 in June (2.76 meq L-1) [17, 30].
Considering the SAR value, an irrigation water quality parameter, the Evrenye Stream was considered "perfect" (0-6 meq L-1) (Table 1) [17, 30]. Since the RSC value of this stream was found to be negative, there is no risk of sodium damage in irrigation. Elevated magnesium concentration in water causes soil salinization and has a detrimental impact on plant growth and yield [18]. The Evrenye Stream's MH value was determined to be between 60.43 and 64.40, which is suitable for irrigation (MH > 50) (Table 1). Kelley ratio is calculated as the ratio of [Na+] to [Ca2+] and [Mg2+]. A Kelley ratio higher than 1 indicates excessive sodium in water. This study's Kelley ratio was found to be higher than 1 in May and June in Stations 7, 8, 9, and 10; suggesting that the stream can be considered suitable for irrigation [16].
Water Quality Index Analysis
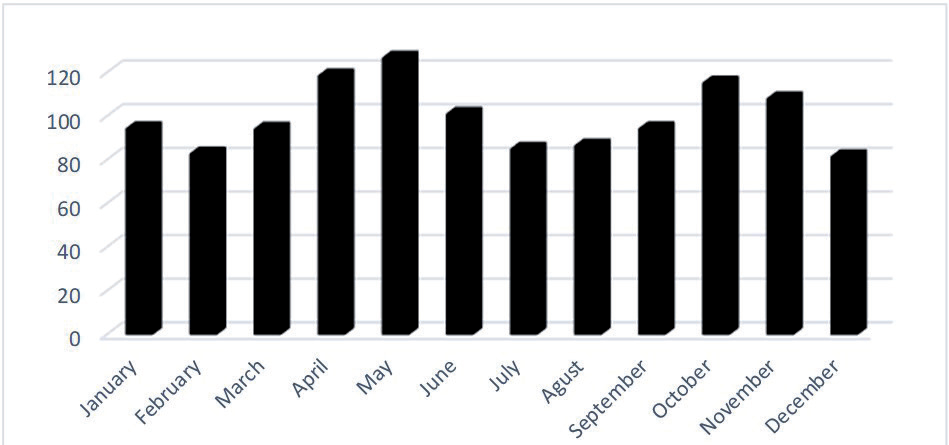
Water quality parameters of Evrenye Stream were analyzed using WQI. To calculate the indices, weight loads were determined considering the distribution of PCA to loads of its main components (Table 3), and standard thresholds were used in calculations [13, 14, 22, 33]. To calculate the index by the PCA analysis result, [Cu2+], [Zn2+], [Pb2+], [Na+], [Ni2+], [Fe2+], [Ca2+], TA, TH, WT, Salinity, EC, [SO32-], [SO42-], BOD5, COD, SS, [Cd2+], [NO2-], DO, and [NH4+] parameters were used [33]. The WQI value of Evrenye Stream calculated using the annual mean values (98.65) was found to be “good water quality”. In the present study, the lowest WQI value was found in December (81.13) and the highest one in May (126.36) (Fig. 2).
The water quality parameters of the Evrenye Stream were analyzed using the WQI. To calculate the indices, weight loads were determined, considering the distribution of Principal Component Analysis (PCA) to loads of its main components (Table 3), and standards thresholds were used in calculations [14, 22, 33]. In the calculation of the index based on the PCA analysis result, the parameters [Cu2+], [Zn2+], [Pb2+], [Na+], [Ni2+], [Fe2+], [Ca2+], TA, TH, WT, Salinity, EC, [SO32-], [SO42- ], BOD5, COD, SS, [Cd2+], [NO2-], DO, [NH4+] were utilized [6, 33].
The WQI value of the Evrenye Stream, calculated using the annual mean values (98.65), was found to be categorized as "good water quality" (50 ≤ WQI <100). In the present study, the lowest WQI value was observed in December (81.13), and the highest one was in May (126.36) (Fig. 2). Given these values, it can be stated that the stream is almost in the "good water quality" class in terms of drinking water. WQI of the Evrenye Stream, computed based on the annual mean values (98.65), was determined to fall within the category of "good water quality" (50 ≤ WQI <100). Within the scope of this study, the lowest WQI value was recorded in December (81.13), while the highest was observed in May (126.36) (Fig. 2). These findings suggest that the stream largely meets the criteria for "good water quality," particularly with regards to its suitability for drinking purposes.
Table 3.
The weights assigned to the 21 variables in the water samples from the Evrenye Stream.
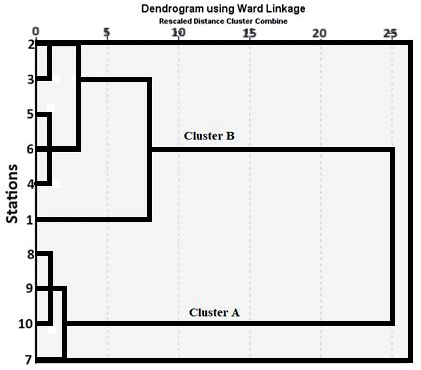
Both spatial and temporal analyses were conducted using complex and multivariate statistical methods, employing 28 parameters obtained from water samples collected monthly from 10 stations over a year. Hierarchical Clustering Analysis was utilized to unveil temporal and spatial disparities/similarities and to delineate distinct groups. HCA utilized mean values of the parameters grouped by seasons and stations. The results for the Evrenye Stream illustrate the clustering of stations based on differences/similarities, as seen in Fig. 3. Cluster B demonstrates a higher similarity ratio in contrast to Cluster A. The study area is spatially segmented into an upper basin (St 1-6) and a lower basin (St 7-10). Cluster B (Upper Basin) denotes the initial origin stations of the river, while Cluster B (Lower Basin) characterizes the area where the river meets the waters of the Black Sea (Fig. 3).
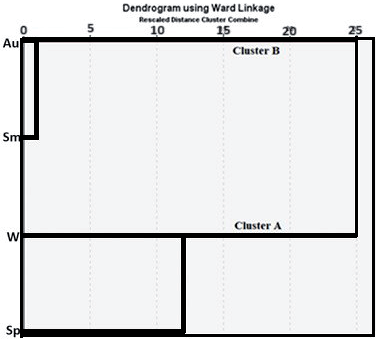
The temporal differences in variations were examined through HCA employing seasonal mean values (Fig. 4). The similarity ratio among the members of Cluster A surpasses that of Cluster B within the two clusters. Cluster A encompasses the winter and spring seasons, there is Cluster B encompasses the summer and fall seasons. Consequently, two seasonal clusters were identified, albeit without a distinct demarcation between wet and dry seasons. This outcome was consistent with the findings of the ANOVA test.
Prior to conducting principal component analysis (PCA), the Kaiser-Meyer-Olkin (KMO) and Bartlett tests were administered on the datasets to assess their suitability for PCA. To ascertain the appropriate number of principal components, confirmation was sought by observing the point at which the number of principal components exceeded "1" before a discernible break in the scree plot [27].
As a result of the PCA, it was determined that four principal components adequately represented the data from the Evrenye Stream (Table 4). These principal components accounted for 83.69% of the total variance in the dataset and exhibited eigenvalues >1 (Table 4, Fig. 5). Consistent with the approach employed by Liu et al., the PCA factor loadings were classified as "strong" (greater than 0.75), "moderate" (0.75-0.50), and "weak" (0.50-0.30) [34].
The first principal component, explaining 34.06% of the total variance, exhibits a strong positive loading on parameters such as [Cu2+], [Zn2+], [Pb2+], [Na+], [Ni2+], [Fe2+], [Ca2+], TA, and TH (r>0.750). This component reflects the influence of heavy metal content, originating from soil or rock, on the water. The impact of mining activities in the study area is evident through this first factor. Conversely, it was observed that the total hardness and total alkalinity in water originate from basin geology, soluble salts, and atmospheric deposition, all stemming from the soil or rock structure [35, 36].
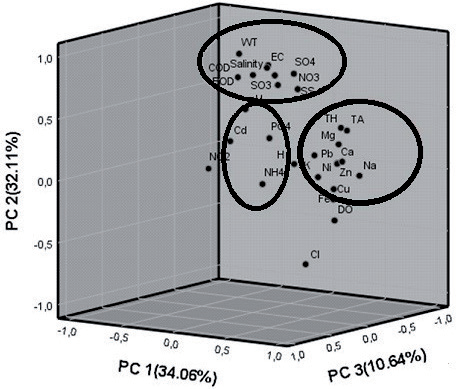
Table 4.
Varimax rotated the factor matrix for the data set.
The second principal component, explaining 32.11% of the total variance, also exhibits a high loading similar to the first component. This component shows a strong positive loading with WT, salinity, EC, BOD5, COD, SS, [SO32-], and [SO42-]. It can be asserted that this component represents a non-point pollutant source, resulting from the interaction of soil and rocks along with surface flow influenced by atmospheric deposition and temperature [7, 30, 37, 38].
The third component, explaining 10.64% of the total variance, demonstrates a strong positive loading on [Cd2+] and [NO2-], and a strong negative loading on DO. Cadmium exhibits high solubility in water, and this solubility increases with rising temperature. The mining activity in the basin serves as a source of cadmium. Since the stream water is utilized in agricultural activities, the presence of cadmium in the food chain poses a risk to organisms in the basin, as well as to human health. The negative loading of dissolved oxygen in this principal component is expected due to the inverse relationship between these parameters.
The final component explains 10.64% of the total variance and is characterized by a high positive loading on [NH4+]. Rainwater, being one of the most effective solvents globally, partially dissolves nitrogenous matter in the soil, resulting in the transfer of nitrogenous compounds to the water. Elevated levels of [NH4+] ions may be found in wells in agricultural areas, indicating that nitrogenous artificial fertilizers are infiltrating underground through rainwaters, posing a risk to well waters.
Conclusions
In the world, 2 million individuals, mainly children, die annually because of intestinal infections due to inappropriate water usage and poor hygienic conditions. A quality life can be achieved only with quality freshwater, as well as improving the available water and sustainable usage.
In this study, by making use of water quality data obtained monthly for a year from 10 stations in Evrenye Stream located in a basin with excellent natural beauty, water quality was determined. Besides that, in order to determine the suitability of this stream for aquatic life and irrigation purposes, WQI was calculated using the principal components of PCA analysis. Furthermore, temporal and spatial analyses were performed using multivariate statistical methods. Because of the mining company in the basin, this stream was found to be very risky to both aquatic organisms and agricultural use, since the heavy metal content reaches humans. All the organisms drinking the underground and surface waters are included in the foot chain by being affected by these chemicals. Moreover, the agricultural products are also polluted. In conclusion, a severe health risk arises for all organisms. It is recommended to take necessary precautions, continue sampling as monitoring, and carry out the controls.
In the present study, according to WHO, SWQR, and regulations and considering the general chemical and physical parameters set inland surface water sources, the Evrenye Stream was found to be “less polluted water” in terms of electrical conductivity and nitrate concentration. However, since the copper and cadmium ions were found to be much higher than the desired limits for irrigation and drinking waters, stream water is classified as “very polluted water” (Class I-V). The stream water was determined to be suitable for irrigation purposes based on the % Na, SAR, RSC, MH, and KR parameters.
The results obtained from the statistical analyses applied to the achieved data clusters (ANOVA, Pearson’s correlation, HCA, and PCA) corroborated each other. Naming the basin as the upper and lower basin was a result of spatial distinction based on the HCA. Winter and spring seasons were observed to exhibit greater similarity compared to summer and fall seasons. As a result of PCA analysis conducted on the water quality data of this stream, it was determined that four principal components represented the water mass. The main pollution sources of the Stream were mining companies in the basin, temperature, anions reaching the water as a result of pesticides and fertilizers used in agricultural activities, and point and non-point pollutants.
WQI calculated using the annual mean values of parameters yielded “quality water” character in general. However, since it was observed that the quality tended to decline in the course of time during the freshwater management of the basin, it was determined that the stream should be monitored. The continuity of life depends on the water. Mining activities consume water and also pollute it. Moreover, considering the pollution arising from agricultural activities, widely used chemical fertilizers and pesticides should be controlled and animal wastes should be prevented from reaching the water. While developing the action plans for water pollution in stream basins, the use of statistical modeling allows for interpreting the raw data and understanding them more clearly. Continuous monitoring is one of the suggestions for sustainable water.

