

Introduction
Green and low-carbon transformation is not only the main way to achieve the dual carbon goals, but also an inherent requirement for high-quality socio-economic development and the transformation of old and new driving forces. The relationship between man and nature is the core issue of regional development. In the early agrarian society, soil, solar energy, water, forest, geothermal, and other natural resources provide energy for regional biomass development. Biomass energy is renewable energy, with clean, low-carbon, and replaceable advantages, so agrarian society is essentially a low-carbon society.
With scientific and technological progress promoting the development of industrial society, in order to meet the needs of rapid regional development, it has led to the massive exploitation and excessive consumption of coal, oil, natural gas, and other fossil energy. The balance between people and the ecological environment has been destroyed, and the contradiction between people and economic development has been intensified. It can be seen that industrial society is a high carbon society in essence. At present, China’s regional development depends significantly on energy consumption, so the transformation of energy structure is imperative for the development of a low-carbon economy [1].
The academic community has made rich research achievements on the relationship between energy structure and low-carbon economy. Wang [2] took Henan Province as the research object and analyzed the relationship between green energy utilization, carbon emissions, and economic growth in Henan Province by constructing a VAR model. Fankhauser et al. [3] reviewed the impact of the transition to low-carbon energy on the economic growth and development of low-income countries, and listed empirical research results on the energy intensity and emission intensity trajectories of economic growth. Horobet et al. [4] studied the links between carbon emissions, energy consumption and mixing, and economic growth in a modified framework to diversify energy structure and invest in low-carbon energy. Liu et al. [5] studied the low-carbon optimization method for the life cycle of a multi energy complementary distributed energy system (MCDES) from three aspects: low-carbon, life cycle, and optimization method.
However, most scholars study how to optimize the energy structure to promote the development of a low-carbon economy, and only a few scholars conduct quantitative analysis on low-carbon economy or energy structure [6]. Ding et al. [7] measured and analyzed the development level of low-carbon economy from the perspective of eight comprehensive economic zones, and used Dagum Gini coefficient and β convergence methods to reveal the regional differences and spatial convergence characteristics of low-carbon economy development in eight comprehensive economic zones. Liu et al. [8] took full account of the development plan and objectives of low-carbon economy, and adopted the revised TOPSIS method to build the low-carbon economy evaluation model. Pang et al. [9] used the entropy method to estimate the green finance development index and energy structure optimization index, and empirically analyzed the impact of green finance on energy structure. Xing et al. [10] analyzed the changes in rural energy consumption and structure in Northeast China, estimated the production of major air pollutants from domestic sources, and compared and analyzed the differences in energy consumption and quality among residents in the region.
These research achievements not only improve the theoretical system of low-carbon economy and energy structure, but also provide theoretical guidance for the rectification and improvement of green low-carbon transformation. However, the following points were overlooked in these studies: (1) There was no in-depth study of the internal evolution laws between the two. (2) There are few predictions about the relationship between the two. (3) There is not much research on the key factors that affect the relationship between the two. The innovation of this paper is to conduct a quantitative analysis of the low-carbon economy and energy structure first, then calculate the coupling degree between the two, and use a variety of algorithms to scientifically predict the coupling degree.
The conceptual models commonly used by scholars to study internal evolution laws include: PSR model [11], DPSIR model [12], DPSIRM model [13], TQR model [14], EES model [15], PLE model [16], etc. Secondly, the models commonly used to study the prediction between the two include: BP neural network model [17,18,21], ARIMA model [18,19], grey model [20], Markov chain model [21], etc. Finally, methods for measuring key factors include: system dynamics [22], CRITIC method [23], analytic hierarchy process [24,25], resistance model [26], geographic detector [27], etc.
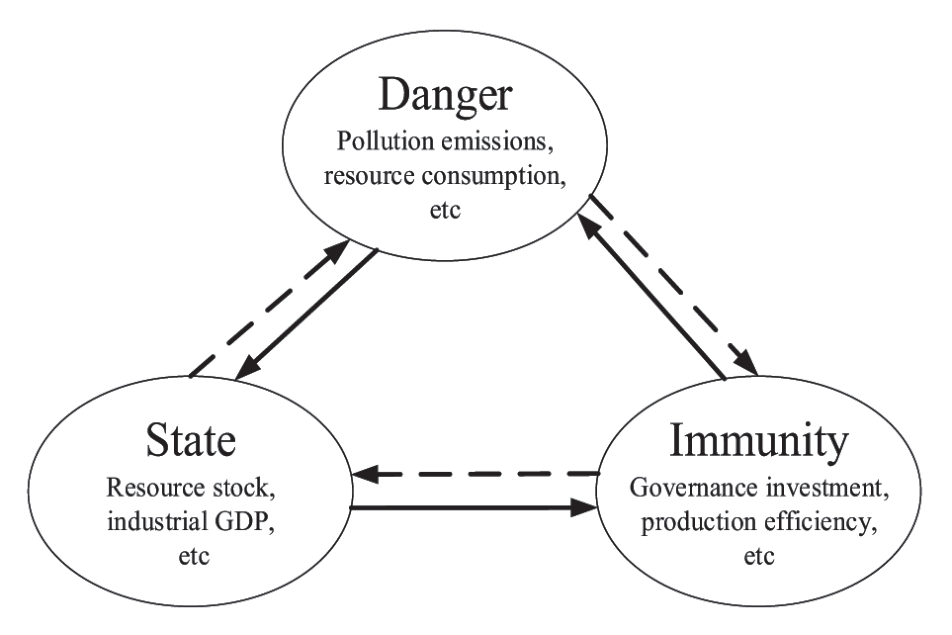
In summary, this paper takes Anhui Province as the research object and constructs a comprehensive evaluation index system based on the SDI (State-Danger-Immunity) conceptual framework, as shown in Figure 1. Use the development index to evaluate the development level of low-carbon economy and energy structure, use the coupling degree to measure the current coupling level of low-carbon economy and energy structure, predict the coupling level of low-carbon economy and energy structure in the future through the grey model optimized by various algorithms, and finally use the resistance value to diagnose the resistance of regional low-carbon economy and energy structure. Furthermore, it provides theoretical basis and practical guidance for the green and low-carbon transformation and energy structure optimization in Anhui Province.
Materials and Methods
Study Area
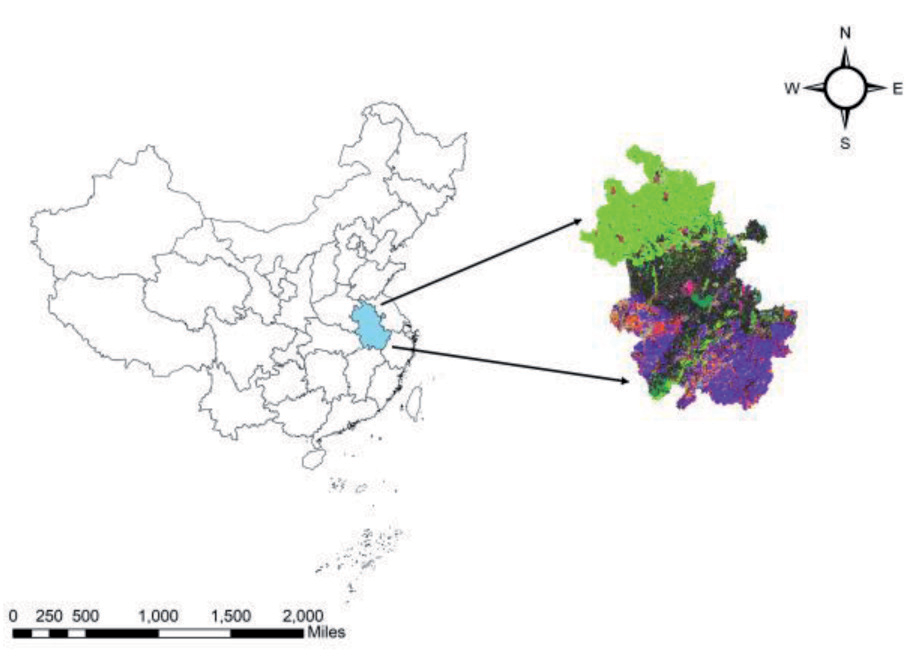
Anhui is located in East China [28] on the Chinese mainland, covering an administrative area of more than 140000 square kilometers, spanning the Yangtze River, Huaihe River, and Xin’an River basins, and is an important part of the Huaihe River Ecological Economic Belt, Wanjiang River Economic Belt, and Yangtze River Delta Economic Zone [29]. The remote sensing image of land use in Anhui Province is shown in Figure 2.
In 2021, the total energy production of Anhui Province was 93.1748 million tons of standard coal, and the total energy consumption was 153.4263 million tons of standard coal. Compared with 94.1325 million tons of standard coal in 2014 and 120.1102 million tons of standard coal, the former decreased by 1.02% year-on-year, while the latter increased by 27.73% year-on-year. The long-term high carbon emissions economic development model has led Anhui Province to face resource bottlenecks and ecological imbalances.
Therefore, scientific evaluation of the coupling relationship between low-carbon economy and energy structure in Anhui Province, and exploration of the future time sequence evolution law have great reference significance for Anhui Province to formulate effective policies related to economic development and energy security, while cooperating with the Ministry of Natural Resources to create ecological civilization and promote the construction of an environment-friendly society in Anhui Province.
Data Sources
The original data selected in this paper are mainly from the Anhui Statistical Yearbook from 2015 to 2022, Anhui Statistical Bulletin of National Economic and Social Development, and the Anhui Environmental Status Bulletin from 2014 to 2022. Some evaluation indicator data is calculated by formulas based on the data in the yearbook and bulletin.
Entropy Weight Method
The methods for determining indicator weights include AHP [24-25], expert scoring method [30], etc. These are subjective weighting methods with strong subjectivity. This article adopts the objective weighting method - entropy weighting method [25,31,32] to determine the weight of indicators and avoid subjective errors.
Assuming there are m objects and n evaluation indicators, then
(1) Firstly, standardize the data:
Positive indicators:
Reverse indicators:
(2) Calculate the proportion
(3) Calculate the entropy value
(4) Calculate the weight
Development Index Method
A single indicator cannot fully reflect the respective development status of the low-carbon economy and energy structure. It is necessary to comprehensively evaluate multiple indicators.
The standard of development grade directly affects the accuracy of the results. Based on the research results of Li et al. [33], this article divides the development index S into four grades (see Table 1 for details).
Coupling Coordination Model
In order to further study the coordination relationship between the low-carbon economy and the energy structure, so as to more intuitively reflect the development of cities in Anhui Province, this paper studies the coupling relationship between the two with the help of the coupling coordination model [34-36]:
Among them,
With reference to the relevant evaluation criteria for the coupling development of low-carbon economy and energy structure [35,36], and in combination with the actual situation of energy economic development in Anhui Province, the coupling degree is divided into 3 coupling regions and 10 coupling grades, as shown in Table 2.
Traditional GM (1,1)
The grey model [20, 37] transforms the original data into a regular sequence through the degree of dissimilarity between factors, and establishes a differential equation model to predict development trends. The most commonly used model is GM (1,1):
(1) Accumulated generation:
Accumulate the sequence
(2) First fit parameters:
Solve the differential equation of GM (1,1) model:
By solving equation (10), the time response function can be obtained:
(3) Determine the predicted value, and the prediction function is:
(4) Accuracy inspection
To verify the reliability of the model, it is necessary to verify the accuracy of the model. In this study, relative residual and class ratio dispersion were used, and the mean relative residual was calculated using formula (13), while the mean class ratio dispersion was calculated using formula (14).
Table 2.
Coupling Grade Standards
If
GM (1,1) for Multi Algorithm Optimization
With the development of grey systems, the information significance of old data continues to decrease. While constantly supplementing new information, timely removal of old information can better reflect existing feature patterns. It is clearly necessary to remove old data that cannot reflect the current characteristics of the system. Therefore, this article selects the new information GM (1,1) and metabolic GM (1,1) for comparative analysis with traditional GM (1,1) [38-40].
(1) New Information GM (1,1)
The model established using X(0) = (x(0)(1), x(0)(2), ..., x(0) (n), x(0) (n + 1)) is called New Information GM (1,1). Set
(2) Metabolic GM (1,1)
The model established using X(0) = (x(0) (2), ..., x(0) (n), x(0) (n + 1)) is called Metabolism GM (1,1). Insert the latest information x(0) (n + 1) and remove the oldest information x(0)(1).
Resistance Model
In order to ensure the rational allocation and optimization of energy economy, formulate and adjust comprehensive governance policies, and use the resistance model [26] to diagnose the key resistance factors in the coupling relationship between low-carbon economy and energy structure in Anhui Province.
The resistance value O represents the degree of resistance of the factor; Skewness
Result
Construction of Evaluation Indicator System
Drawing on the scientific research achievements of scholars, combining the principles of accessibility, representativeness, and operability of evaluation indicators, 12 evaluation indicators are selected to build a comprehensive evaluation indicator system from the two dimensions of energy structure and low-carbon economy, and based on the SDI conceptual framework model of “State-Danger-Immunity”. See Table 3 for details.
Analysis of Development Level
The development index and development grade evaluation results of low-carbon economy and energy structure in Anhui Province from 2014 to 2021 are shown in Table 4.
Table 3.
Comprehensive Evaluation Indicator System
Table 4.
Development level of low-carbon economy and energy structure in Anhui Province from 2014 to 2021
The development index of energy structure showed an upward trend from 2014 to 2015, with a highest value of 0.306 in 2015. It showed a downward trend from 2016 to 2019, and a lowest value of 0.139 in 2019. It showed an upward trend from 2020 to 2021. The development grade of energy structure was ordinary from 2014 to 2017, and decreased to an raised level from 2018 to 2021.
The development index of the low-carbon economy showed an upward trend in 2014-2016, a decline in 2017, a steady upward trend in 2018-2021, and a peak of 0.416 in 2021. The development grade of the energy structure was at an ordinary level in the first four years, but decreased to a raised level in the following four years. The development grade of low-carbon economy was at a raised level from 2014 to 2015, rose to an ordinary level in 2016, dropped to a raised level in 2017, and rose to an ordinary level in 2018-2021.
From this, it can be seen that the overall development level of the energy structure is on a downward trend, with the development grade decreasing from ordinary to raised. The overall development level of low-carbon economy is on the rise, with the development grade rising from raised to ordinary.
Coupling Coordination Analysis
The coupling of low-carbon economy and energy structure in Anhui Province from 2014 to 2021 is shown in Table 5.
The coordination relationship degree remained above 0.9 except for 2014-2015 and 2016-2021, but the difference between them was not significant. The comprehensive evaluation index was above 0.2 except for 2014 and 2015, which were 0.145 and 0.188, with only 2021 exceeding 0.3. So introducing a coupling degree can better compare the coupling situation between the two.
From 2014 to 2015, the coupling degree was between 0.3 and 0.4, with a mild imbalance in the coupling grade and in a disharmonic coupling region. In 2016, the coupling degree increased to between 0.5 and 0.6, with a coupling grade of barely coordination and an adaptive coupling region. From 2017 to 2020, the coupling degree decreased to between 0.4 and 0.5, with a coupling grade of near imbalance and an adaptive coupling region. In 2021, the coupling degree reached its highest value of 0.556, with a coupling grade of barely coordination and an adaptive coupling region.
It can be seen that the coupling development of low-carbon economy and energy structure in Anhui Province is steadily increasing, and the coupling grade has gone through a stage of mild imbalance - barely coordinated - near imbalance - barely coordinated. The coupling region has transformed from a disharmonic coupling region to an adaptive coupling region. The overall trend is towards primary coordination at the coupling grade, and the coupling region is developing towards a benign coupling region.
Table 5.
Coupling between low-carbon economy and energy structure in Anhui Province from 2014 to 2021
Multi Algorithm Optimization GM (1,1)
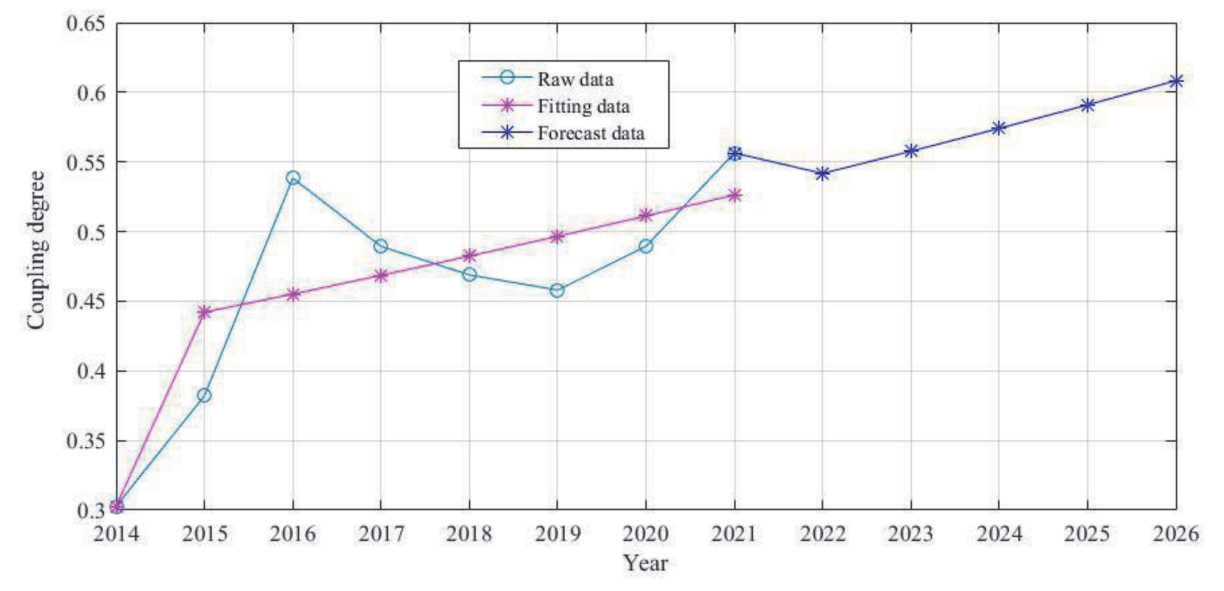
With the help of MATLAB R2016a software, traditional GM (1,1), new information GM (1,1), and metabolism GM (1,1) are used to predict the evolution trend of coupling degree between low-carbon economy and energy structure in Anhui Province from 2022 to 2026. The prediction results are shown in Fig.3. The development coefficient obtained by the least squares fitting method is 0.029034, and the grey action is 0.42693.
The sum of squares of errors in traditional GM (1,1) prediction is 0.0068955, while the sum of squares of errors in new information GM (1,1) prediction is 0.0068858. The sum of squares of errors in metabolic GM (1,1) prediction is 0.0069993. Because the sum of squares of errors in new information GM (1,1) model is the smallest, the new information model is ultimately chosen for prediction.
It can be seen from Figure 3 that the original data is evenly distributed on both sides of the fitting data and prediction data. The mean relative residual is 0.08083, and the residual residual test results show that the model fits the original data very well. The mean class ratio dispersion is 0.1208, and the results of the class ratio dispersion test indicate that the model meets the general requirements for fitting the original data.
From Table 6, it can be seen that the coupling degree from 2022 to 2025 will be between 0.5 and 0.6, and the coupling grade will be barely coordination. The coupling region will be adaptive. In 2026, it will reach the highest value of 0.608, with the coupling grade rising to primary coordination and the coupling area reaching benign. It is not difficult to see that the coupling development of low-carbon economy and energy structure in Anhui Province will be in a stable and good trend.
Resistance Diagnosis
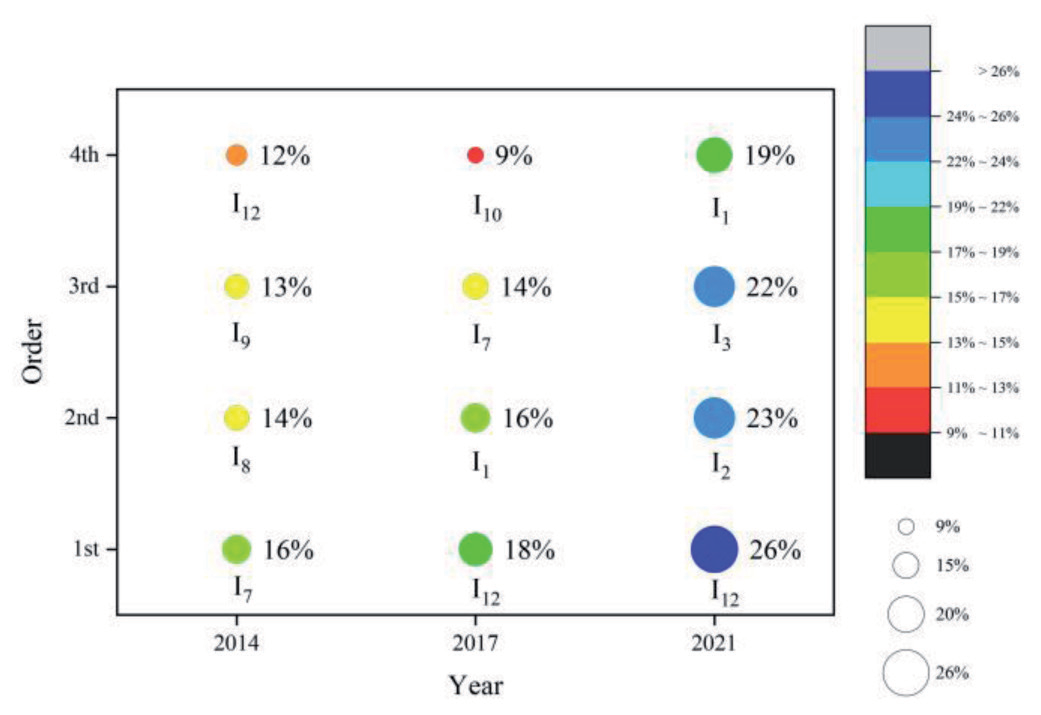
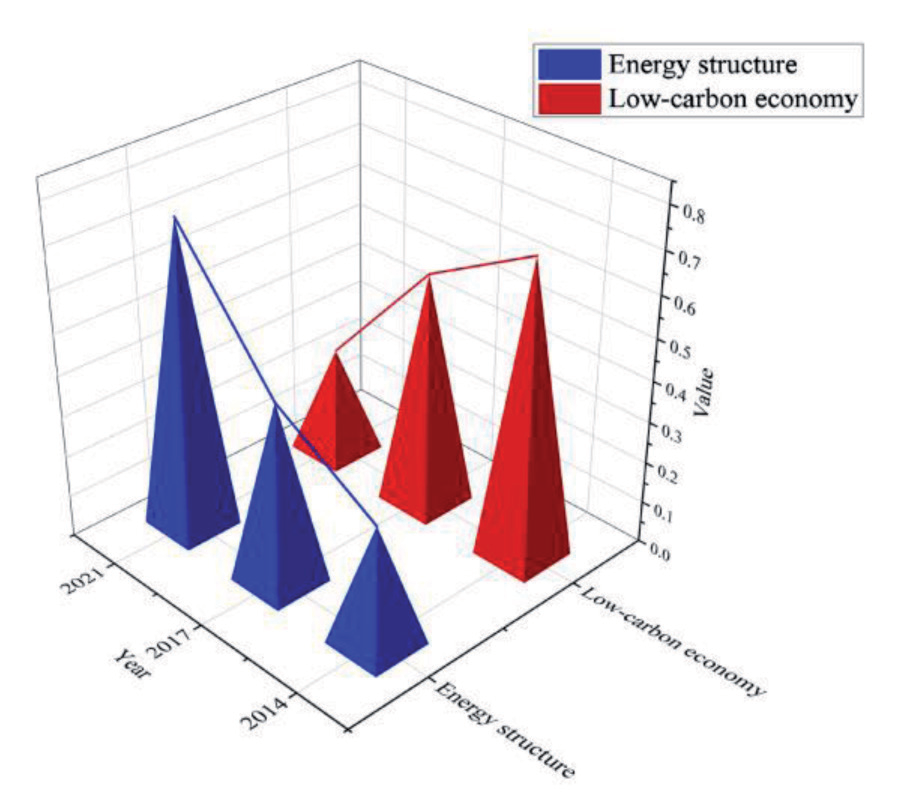
Figure 4 shows the bubble chart of the top four resistance factors of low-carbon economy and energy structure in Anhui Province in 2014, 2017, and 2021 according to the resistance value. Figure 5 is a three-dimensional histogram of low-carbon economy and energy structure resistance in Anhui Province in 2014, 2017 and 2021.
The key resistance factors restricting coupling development in 2014 are mainly concentrated in the low-carbon economy dimension. The first resistance factor is the GDP of the tertiary sector of the economy, the second resistance factor is traffic accident situation, the third resistance factor is public safety budget expenditure, and the fourth resistance factor is investment in industrial wastewater treatment.
The key resistance factors restricting coupling development in 2017 are still mainly concentrated in the low-carbon economy dimension. The first resistance factor is investment in industrial wastewater treatment, the third resistance factor is the GDP of the tertiary sector of the economy, and the fourth resistance factor is Gross industrial product. Only the second resistance factor - total energy production in the energy structure dimension.
In 2021, the key resistance factors restricting coupling development will obviously change to focus on the energy structure dimension. In addition to the first resistance factor - Investment in industrial wastewater treatment in the low-carbon economy dimension, the second resistance factor - Total energy consumption, the third resistance factor - Energy processing conversion efficiency and the fourth resistance factor - Total energy production are all in the energy structure dimension.
Table 6.
Evolution of coupling degree between low-carbon economy and energy structure in Anhui Province from 2022 to 2026
Therefore, the resistance of the energy structure dimension showed a steady growth trend from 2014 to 2021. On the contrary, the resistance of the low-carbon economy dimension showed a steady downward trend.
Discussion
In order to vigorously promote energy conservation and emission reduction, deepen the battle to optimize the energy structure, accelerate the establishment and improvement of a green and low-carbon cycle development economic system, promote the comprehensive green transformation of economic and social development, and help achieve the goal of carbon peak and carbon neutrality, the State Council formulated a comprehensive work plan for energy conservation and emission reduction in the “14th Five Year” Plan [41]. In 2023, the State Council Information Office released a white paper titled “China’s Green Development in the New Era”, proposing to firmly follow the path of green development, basically form a green spatial pattern, continuously adjust and optimize industrial structure, widely promote green production methods, and gradually improve the green development system and mechanism [42].
China has accelerated the construction of an economic system of green and low-carbon carbon cycle development, vigorously promoted the green production mode, promoted the energy revolution and resource conservation and intensive utilization, systematically promoted clean production, coordinated pollution reduction and carbon reduction, and achieved coordinated and unified economic and social development and ecological environment protection [42]. Therefore, this paper studies the coupling relationship between low-carbon economy and energy structure in Anhui Province, which can better explore the internal evolution law, accelerate the green transformation of Anhui Province, and enable high-quality development of energy economy.
The development index method is used to comprehensively measure the development level of low-carbon economy and energy structure in Anhui Province, and the resistance model is used to diagnose the degree of resistance of low-carbon economy and energy structure. From 2014 to 2021, the development level of the energy structure showed a downward trend, the resistance of the energy structure dimension showed a steady growth trend, the development level of the low-carbon economy showed an upward trend, and the resistance of the low-carbon economy dimension showed a steady downward trend. The key resistance factors restricting coupling development in 2014 are mainly concentrated in the low-carbon economy dimension. The key resistance factors restricting coupling development in 2017 are still mainly concentrated in the low-carbon economy dimension. The key resistance factors restricting coupling development in 2021 are mainly concentrated in the energy structure dimension, but the first resistance factor is in the low-carbon economy dimension.
It can be seen that the development level and the degree of resistance are in the opposite trend. The key resistance factors have changed from the low-carbon economy dimension to the energy structure dimension, but the first key factor is still in the low-carbon economy dimension. The government should promote the green transformation of traditional industries, promote the green development of industries, transform agricultural production methods, and enhance the level of green service industry. Integrate the concept of green development into all links of the whole chain of industry, agriculture and service industry, actively build a production system of green and low-carbon cycle development, and comprehensively improve the level of greening of traditional industries.
The coupling of low-carbon economy and energy structure in Anhui Province is deeply analyzed by means of the coupling coordination model, and the GM (1,1) optimized by various algorithms is used to predict Anhui Province. From 2014 to 2021, the coupling development of low-carbon economy and energy structure in Anhui Province showed a steady upward trend. There is a trend towards primary coordination at the coupling grade, with the coupling area developing into benign. From 2022 to 2026, the coupling development of low-carbon economy and energy structure in Anhui Province will be stable and good.
It can be seen that the coupling development of low-carbon economy and energy structure has been rising steadily, and it is hoped that the coupling grade will rise to moderate coordination, and that the coupling region is still benign. The government should promote green and low-carbon energy development, vigorously develop non fossil fuels, and improve the level of clean and efficient utilization of fossil fuels [43]. The premise is to focus on energy resource endowments, continuously enhance energy supply guarantee capabilities, accelerate the construction of a new energy system, and promote a significant increase in the proportion of clean energy consumption, in order to ensure significant results in the green and low-carbon transformation of the energy structure.
Conclusions
Based on the SDI conceptual framework and from the two dimensions of energy structure and low-carbon economy, this paper selects 12 indicators to build an evaluation indicator system. Evaluate development level using the development index, measure coupling level using the coupling degree, predict future coupling level using the grey model optimized by multiple algorithms, and finally use resistance value for the resistance diagnosis.
(1) The overall development level of the energy structure shows a downward trend, first increasing and then decreasing, reaching its highest level in 2015. The development level of the low-carbon economy is on the rise as a whole, and it only declined in 2017. It has been growing steadily before and after, and will reach its highest level in 2021. The development grade of the energy structure dropped from the ordinary level to the raised level, and the development grade of the low-carbon economy rose from the raised level to the ordinary level after fluctuating growth.
(2) From 2014 to 2026, the coupling development of low-carbon economy and energy structure in Anhui Province shows a steady upward trend. There is a trend towards primary coordination at the coupling grade, with the coupling area developing into benign. From 2014 to 2015, the coupling degree was between 0.3 and 0.4, with a mild imbalance in the coupling grade and disharmony in the coupling region. In 2016, it was between 0.5 and 0.6, with a coupling grade of barely coordination and an adaptive coupling area. From 2017 to 2020, the coupling degree was between 0.4 and 0.5, and the coupling grade was near imbalance, with the coupling area being adaptation. From 2021 to 2025, it will be between 0.5 and 0.6, with a coupling grade of barely coordination and an adaptive coupling area. In 2026, it will reach its highest level, with the coupling grade rising to primary coordination and the coupling area reaching benign.
(3) From 2014 to 2021, the overall resistance in the energy structure dimension showed a steady growth trend, and the overall resistance in the low-carbon economy dimension showed a steady downward trend. The key resistance factors restricting coupling development in 2014 are mainly concentrated in the low-carbon economy dimension. The key resistance factors restricting coupling development in 2017 are still mainly concentrated in the low-carbon economy dimension. The key resistance factors restricting coupling development in 2021 are mainly concentrated in the energy structure dimension, but the first resistance factor is in the low-carbon economy dimension.
But there are still some limitations to this article. Firstly, in terms of research objects, this article only selected Anhui Province as an example to analyze its temporal variation characteristics, but did not take into account the spatiotemporal differences between cities or counties in Anhui Province. Secondly, in terms of weighting evaluation indicators, this study only used the entropy weighting method and only considered objective factors, without combining subjective and objective weighting. Finally, in the selection of prediction methods, the sum of squares of errors of the three prediction methods used in this article are all very small, with values around 0.007. The new information model used for prediction has a mean relative residual of about 0.08 and a mean class ratio dispersion of about 0.12. The fitting effect is good, but they are all based on algorithm improvements based on GM (1,1) and have not been compared and analyzed with other prediction methods.
So in the following research, spatial heterogeneity analysis can be selected from various cities or counties in Anhui Province. At the same time, the combination weighting method can be used to effectively combine objective weighting and subjective weighting. In order to make the prediction results more accurate, the prediction methods of the BP neural network model, LSTM model, etc. can be compared and analyzed.

