

Introduction
Global warming has become a pressing global issue, and strengthening carbon emissions control has emerged as a critical factor influencing the economies’ healthy and sustainable development. In September 2020, China announced the “Dual-Carbon Strategy”, aiming to peak carbon dioxide emissions before 2030 and achieve carbon neutrality by 2060. This ambitious goal not only reflects China’s responsibility as the world’s largest carbon emitter but also establishes clear requirements for advancing high-quality development. The Chinese government views the “dual-carbon” goal as an opportunity to transform its social and economic systems, integrating it into the broader framework of ecological civilization construction. The challenges of achieving “carbon peaking” and “carbon neutrality” have been converted into an innovation-driven growth engine. In 2019, the Ministry of Science and Technology issued the “Guiding Opinions on Building a Market-Oriented Green Technology Innovation System”, which identifies green technology innovation as a vital driver of green development, a key to combating pollution, and a cornerstone for promoting ecological and high-quality economic progress.
Building on the concept of the “software capability maturity model” proposed by Humpbery (1987), Wenju Wang and Feng Li introduced the notion of “carbon emission reduction maturity” [1]. This concept is measured using three core indicators: the relative development degree of carbon emission reduction, the relative coordination degree of carbon emission reduction, and the relative coordinated development degree of carbon emission reduction. Together, these indicators assess the regional carbon reduction level and the coordination of its driving factors. Specifically, the relative development degree measures the reduction in carbon intensity per unit of regional economic output, the relative coordination degree evaluates the alignment between energy consumption intensity and carbon emission intensity, and the relative coordinated development degree reflects the integrated progress of these two aspects.
Green technology innovation, economic development, energy efficiency, and lifestyle factors all directly or indirectly impact carbon emission reduction. This raises several critical questions: What is the current level of carbon reduction maturity across Chinese provinces? Are there significant regional disparities? How does green technology innovation influence carbon reduction maturity, and what are the mediating mechanisms involved? Addressing these questions is essential for clarifying the role of green technology innovation within a low-carbon and circular economic system. Moreover, such research provides valuable insights for constructing effective carbon reduction policies and achieving long-term energy conservation and emission reduction goals.
Green technology innovation is a key enabler for achieving the “dual-carbon” goals. Although many studies have examined its impact on carbon emissions, the relationship remains subject to debate. Some researchers argue that green technology innovation significantly reduces carbon emissions. For example, Acemoglu et al. (2012) demonstrated that environmental constraints and resource scarcity incentivize advancements in green technology [2]. Xu et al. (2022) reported that green technology innovation significantly impacts reducing carbon emissions in China [3]. Similarly, Dong et al. (2022) conducted a spatial econometric analysis of 32 developed countries with carbon neutrality targets, showing that green technology fosters emission reductions by influencing economic growth and urbanization [4]. Shen (2023) emphasized that green technology is a critical factor in reducing carbon intensity through static and dynamic panel models [5]. Cheng et al. (2023) further revealed that green technology innovation curbs industrial carbon emissions based on spatial panel data from the Yangtze River Delta [6].
Conversely, some studies suggest that the benefits of green technology innovation are conditional. Brookes (1990), Brännlund (2007), and Saunders (2008) point to the “energy rebound effect” [7-9], where improvements in energy efficiency drive higher energy demand, partially offsetting the carbon reduction benefits. Du et al. (2019) and Lin and Ma (2022) found that green technology innovation only significantly reduces emissions when economic development surpasses a certain income threshold [10, 11].
A review of the literature highlights substantial progress in understanding the impact of technological innovation on carbon emissions. However, relatively few studies have explored how green technology innovation influences carbon emission reduction maturity. This paper seeks to address this gap by systematically analyzing the direct and indirect mechanisms of green technology innovation on carbon reduction maturity, calculating the carbon reduction maturity of Chinese provinces, and examining regional disparities. The study employs panel data models to empirically test causal pathways and analyze heterogeneity. By enriching the theoretical understanding of the relationship between green technology innovation and carbon emission reduction maturity, this research aims to provide empirical guidance for formulating effective strategies to promote green innovation and advance low-carbon development.
Theoretical Logic and Research Hypotheses
The Direct Effect of Green Technology Innovation on Carbon Emission Reduction Maturity
Green technology innovation serves as a crucial foundation for transitioning development modes from resource-driven to innovation-driven, from scale expansion to structural upgrading, and from mere quantitative growth to high-quality development. It plays a key role in enhancing energy conservation and reducing emissions, effectively mitigating regional carbon emissions. Unlike conventional technological innovations, which often fall short of reducing carbon emissions, green technology innovation provides targeted solutions to suppress emissions effectively [12].
Green technology innovation contributes to carbon emission reduction maturity through two primary mechanisms: “reducing incremental emissions” and “addressing existing emissions” (see Fig. 1). Reducing incremental emissions involves decreasing new carbon emissions by leveraging green technologies to enhance total factor productivity, optimize economic and social processes such as production, distribution, exchange, and consumption, and ultimately improve carbon emission efficiency. Addressing existing emissions refers to mitigating current carbon emissions and promoting carbon neutrality through innovations in carbon capture, storage, and utilization technologies.
These dual mechanisms synergistically increase the intensity of economic output’s carbon emission reduction, thereby improving the relative development degree of carbon emission reduction. Implementing green technological innovations not only reduces production and living costs but also helps prevent and control carbon emissions, effectively mitigating environmental damage. This ensures a harmonious balance between economic growth and environmental sustainability. Additionally, green technologies enable the production of environmentally friendly and low-carbon products that cater to individualized consumer needs while simultaneously achieving economic and ecological benefits.
Based on these considerations, we propose Hypothesis 1.
Hypothesis 1: Green technology innovation has a direct promoting effect on carbon emission reduction maturity.
The Mediating Effect of Green Technology Innovation on the Carbon Emission Reduction Maturity
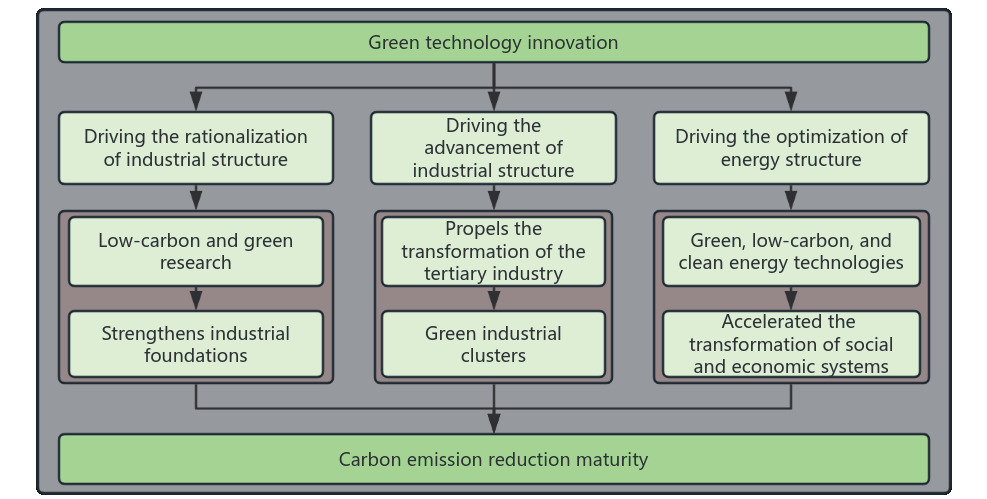
Technological advancements significantly influence society and the economy, with industrial structure upgrading closely tied to technological progress. Green technology innovation strengthens industrial foundations through low-carbon and green research, revolutionizing planting methods, farming, production processes, and production flows. It drives the clean transformation of traditional industries such as agriculture, equipment manufacturing, construction, and transportation, fostering their green and high-end development. By accelerating the growth of high-efficiency, high-tech, and low-emission sectors, green technology innovation facilitates the effective integration of innovation outcomes with green investments and industries [13].
Green technology innovation also propels the transformation of the tertiary industry toward greater diversification and refinement, fostering the development of green industrial clusters. It enhances resource utilization efficiency and extends industrial and value chains, ultimately building a modern, intelligent, networked tertiary industry system. Its driving force lies in achieving the rational allocation of resources among industries, promoting industrial rationalization and high-end development, and ultimately advancing carbon emission reduction goals. Green technology innovation indirectly enhances carbon emission reduction maturity by promoting rationalizing and upgrading industrial structures (Fig. 2).
In addition, green technology innovation provides critical technical support for the green energy revolution. The continuous emergence of green, low-carbon, and clean energy technologies has substantially accelerated the low-carbon transformation of social and economic systems, facilitating progress toward the “dual-carbon” goals. Traditional energy industry chains are transformed through green technology innovations, leading to optimized and upgraded energy production and consumption structures. Improved energy efficiency reduces overall carbon emissions, while advancements in renewable energy technologies—such as wind power, solar energy, geothermal energy, and photovoltaic systems—expand the utilization efficiency and application scope of clean energy sources. By enhancing the production and adoption of clean energy, green technology innovation promotes the gradual replacement of “high-carbon” energy with “low-carbon” alternatives, comprehensively improving carbon emission reduction maturity.
Fig. 1.
The mechanism of the direct impact of green technology innovation on the maturity of carbon emission reduction.
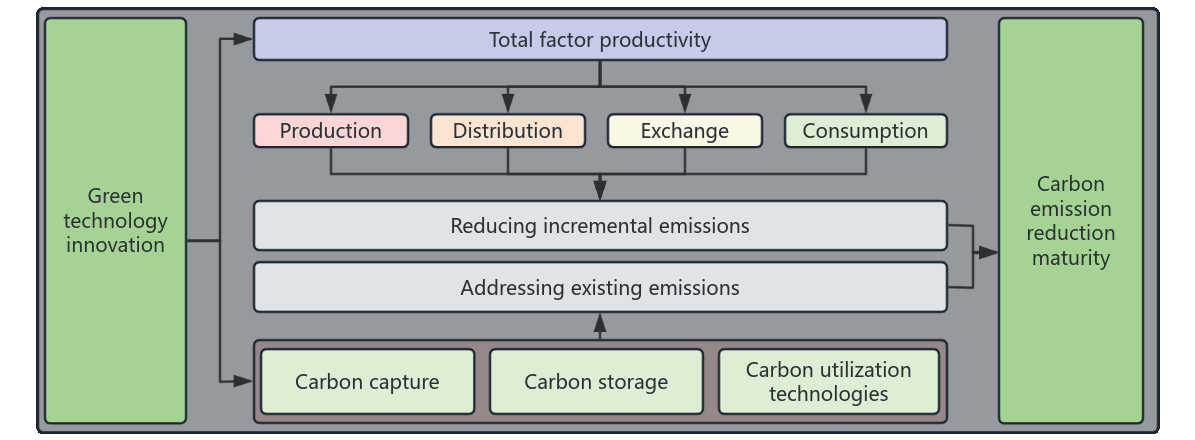
Fig. 2.
The mechanism of the indirect impact of green technology innovation on the maturity of carbon emission reduction.
We propose Hypotheses 2, 3, and 4 based on these insights,
Hypothesis 2: Green technology innovation indirectly promotes carbon emission reduction maturity by driving the rationalization of industrial structure.
Hypothesis 3: Green technology innovation indirectly promotes carbon emission reduction maturity by driving the advancement of industrial structure.
Hypothesis 4: Green technology innovation indirectly promotes carbon emission reduction maturity by driving energy structure optimization.
Materials and Methods
Calculation of the Carbon Emission Reduction Maturity Index
Calculation Method
The Kaya Identity is a mathematical model that elucidates the relationship between human activities and carbon emissions by decomposing emissions into four key components: population, per capita GDP, energy consumption intensity, and the carbon intensity of energy usage. This equation emphasizes that carbon emissions are influenced not only by economic growth but also by the total energy consumed and the energy structure. The modified form of the Kaya Identity is expressed as:
Data Processing
The paper selects relevant indicators from the China Energy Statistical Yearbook, China Statistical Yearbook, China Urban Statistical Yearbook, and China Environmental Statistical Yearbook to measure carbon emission reduction maturity, which involves three indicators: carbon emission, output value, and energy consumption. The provincial GDP in previous years is adjusted to the constant 2006 prices of the China Statistical Yearbook, which provides the foundation for calculating the output’s carbon and energy intensity. The total energy consumption in the China Energy Statistical Yearbook is selected as the basis for calculating the energy intensity of output value and the carbon emission intensity of energy consumption in this paper and expressed in unified heat units (ten thousand tons of standard coal).
Based on the research of the IPCC and scholars, we calculate the carbon emissions.
C denotes carbon emissions, Qi represents the consumption of i energy, which includes coal, oil, and natural gas, Bi is the i energy conversion factor for standard coal equivalent (SCE), Ci is the i energy carbon emission coefficient. The paper adopts the mean value of the coefficients given by relevant research institutions as the emission coefficient for calculating carbon emissions. The average emission factors for coal, oil, and natural gas are 0.72, 0.55, and 0.42, respectively.
Carbon Emission Reduction Maturity Model
We utilize Deng’s gray relational analysis to calculate the relative development degree index, the relative coordination degree index, and the relative coordinated development degree index of carbon emission reduction [14].
Relative Development Degree Index of Carbon Emission Reduction
Let the evaluation object be m provinces and the comparison period n years. Let x be the carbon emission intensity of output value. The comparison sequence of province i is xi={xi(1),xi(1),...xi(n)}, with x0={x0(1),x0(1),... x0(n)} as the reference sequence. As the carbon emission intensity per output is negatively correlated with the carbon emission level, the reference sequence has the lowest carbon emission intensity for each province; that is
ρ is the distinguishing coefficient, and according to the common practice, the value of ρ is 0.5.
Relative Coordination Degree Index of Carbon Emission Reduction
Let y be the energy intensity of output value, and z be the carbon emission intensity of energy consumption. We use equations (1) and (2) to calculate the relative development indexes of carbon emission reduction ϕi(k) and λi(k), which are based on the energy intensity of output value and the carbon emission intensity of energy consumption. Then, the relative coordination degree index δi(k) of carbon emission reduction of the province i in the k year can be obtained as follows:
Relative Coordinated Development Degree Index of Carbon Emission Reduction
As there is often the phenomenon of an inconsistent relative development degree and relative coordination degree for the carbon emission reduction of a specific region in a certain year, such as a low development degree and a high coordination degree, the coordination degree cannot fully reflect the overall level of carbon emission reduction maturity. Therefore, it is necessary to calculate the relative coordinated development degree index.
ϖi k( ) is the relative coordinated development degree index of carbon emission reduction of the province i in the k year, which is from 0 to 1. The larger the value, the higher the relative coordination and development levels of carbon emission reduction.
Analysis of Calculated Results
We calculate the carbon emission reduction maturity indicators for 30 provinces in China from 2003 to 2022. Based on the classification criteria outlined by Wang Wenyu and Li Feng [1], each indicator is categorized into four stages: Stage I represents the very low level (index value between 0 and 35); Stage II represents the low level (index value between 36 and 70); Stage III represents the high level (index value between 71 and 85); and Stage IV represents the very high level (index value between 86 and 100). The specific values and corresponding stages are presented in Table 1.
Table 1.
Relative Maturity and Stage of Carbon Reduction in Chinese Provinces.
[i] Note: Due to the significant amount of missing data for Tibet, Hong Kong, Macau, and Taiwan, this study only calculates the relevant indicators of the remaining 30 provinces, excluding these regions. Due to space limitations, only typical relative maturity index values and stages of carbon emission reduction in 2003, 2019, and 2022 are listed in this paper, without affecting the research on the issue.
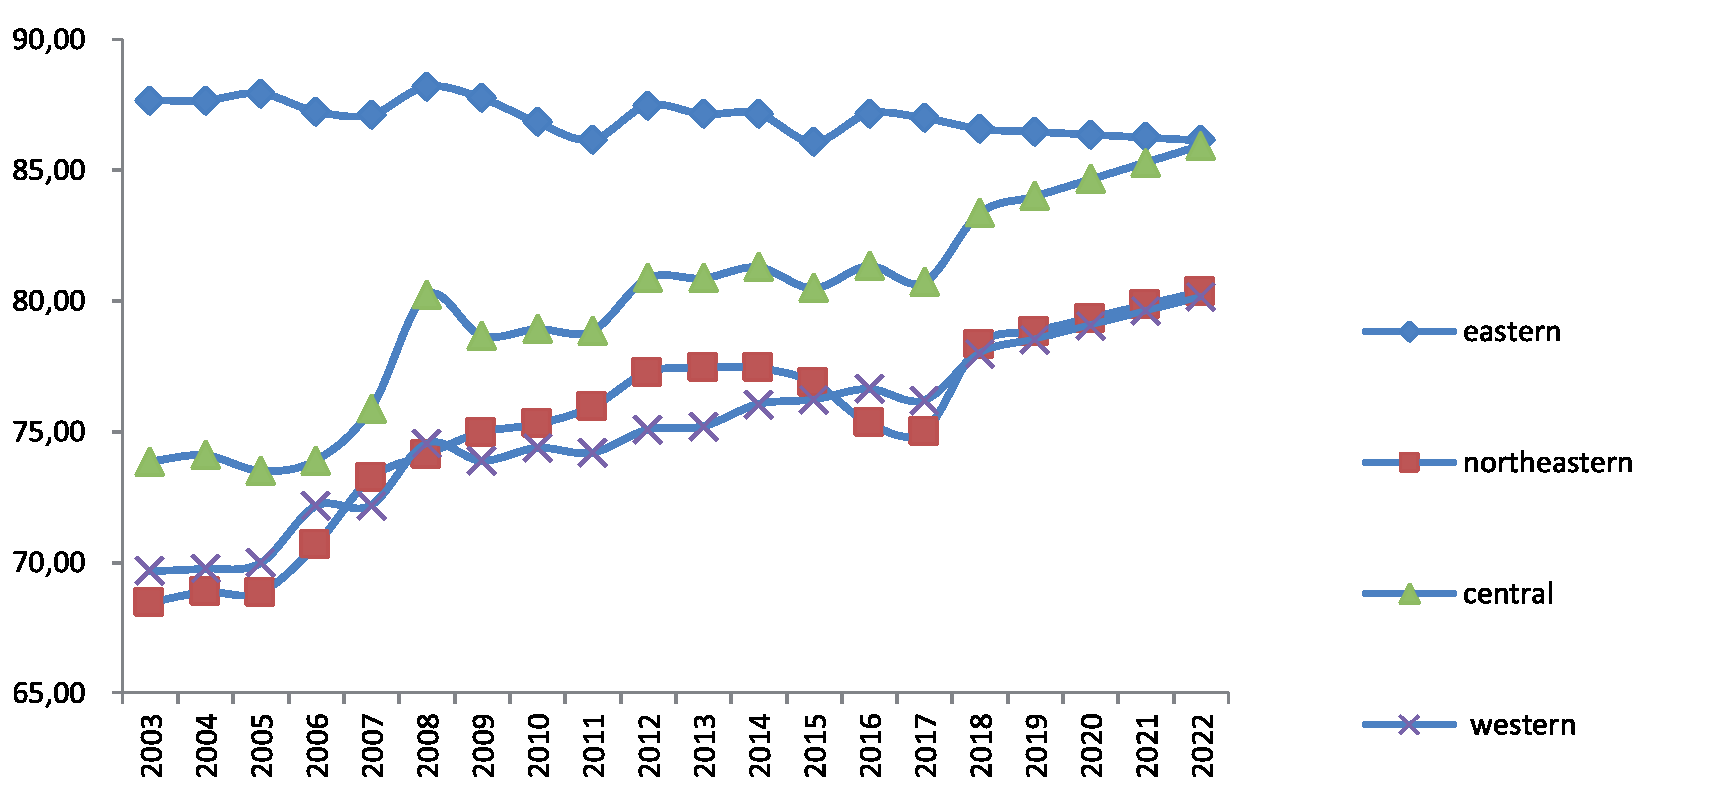
From 2003 to 2022, the relative coordinated development indices for carbon emission reduction have shown fluctuating but generally upward trends, indicating that green development has been integrated into the growth strategies of all provinces and municipalities. The green and ecological development model has become a crucial pillar for achieving high-quality development. These fluctuations are primarily driven by changes in the relative development degree and relative coordination degree. At the same time, significant regional disparities in carbon emission reduction maturity exist across different provinces in China. The eastern region has the highest average carbon emission reduction maturity level, followed by the central, northeastern, and western regions (Fig. 3). Carbon emission reduction maturity correlates with regional economic development. The eastern region, being the most developed, has more financial resources to promote green technology innovation, reducing both energy consumption and carbon emission intensity. Within this region, Hebei, Shandong, and Hainan have reached higher stages of carbon emission reduction maturity, while the remaining provinces are at very high stages.
Carbon emission reduction maturity is generally higher in the central region, except for Shaanxi. This underscores the importance of green technology innovation to drive high-quality development in provinces dominated by coal, metallurgy, and building materials industries. As an old industrial base in northeastern China, the traditional economic development model in Liaoning, Jilin, and Heilongjiang has led to less effective control of energy consumption and carbon emission intensity, resulting in relatively low relative coordination degrees and placing their relative coordination development indices in the middle and lower segments of Stage III.
The western region exhibits significant economic disparity, leading to imbalanced carbon emission reduction maturity across provinces. Provinces such as Sichuan, Chongqing, Yunnan, and Guangxi are in the very high maturity stage, while Guizhou, Shaanxi, Gansu, and Qinghai are at a higher maturity level. In contrast, Inner Mongolia, Ningxia, and Xinjiang are at a lower maturity stage.
Empirical Tests on the Impact of Green Technology Innovation on Carbon Emission Reduction Maturity
Model Design
In order to examine the impact of green technology innovation on carbon emission reduction maturity, we first construct an individual random effects panel data model:
Fig. 3.
Average trend of carbon emission reduction maturity of different regions China from 2003 to 2022.
CM represents carbon emission reduction maturity and GTI represents green technology innovation. X is the control variable group, including economic development level (EL), marketization degree (MD), trade openness degree (TD), foreign direct investment (FDI), and per capita consumption level (CL). μi and εi,t are individual effect and random disturbance terms, respectively.
Based on Liu Shi Shun and Ling Wen Quan’s (2009) research [15], we built an intermediary effect model based on model (6) to further analyze the indirect effect. Based on theoretical logic and research hypotheses, industrial structure and energy structure are selected as mediating variables to verify the significance of the regression of green technology innovation on the two mediating variables.
Based on this, we incorporate the green technology innovation and mediating variables into the model to conduct a joint significance test for carbon emission reduction maturity:
Variable Explanation
(1) Dependent variable
The dependent variable is carbon emission reduction maturity, which is a positive indicator calculated in the previous section.
(2) Explanatory variables
The core explanatory variable is green technological innovation. To objectively reflect the level of green technology innovation across different provinces in China, we use the efficiency of green technology innovation as the core explanatory variable and adopt the Super-SBM model based on non-expected output to calculate the green innovation efficiency. The input indicators include R&D expenditures, R&D personnel full-time equivalent, industrial pollution control completed investment, industrial enterprises’ new product development expenditures, and total energy consumption. The output indicators include patent applications, industrial new product sales revenue, and built-up area greening coverage rate. The undesirable outputs include industrial wastewater discharge volume, industrial sulfur dioxide emissions, and industrial solid waste generation. This variable belongs to the positive indicator.
(3) Control variable group
As many factors affect the carbon emission reduction maturity, we select the following control variables: First, the economic development level (EL) represents per capita GDP, reflecting the impact of economic growth on carbon emission reduction maturity. Second, the marketization degree (MD) represents the marketization index, reflecting the relative progress of regional marketization. Third, the trade openness degree (TD) represents the total exports and imports ratio to regional GDP. Fourth, foreign direct investment (FDI) represents the ratio of the actual utilization of foreign funds to the regional GDP. Fifth, the per capita consumption level (CL) represents the ratio of residents’ consumption expenditures to the average annual population. All control variables are positive indicators. All the variables are positive indicators.
(4) Mediator variables
To test hypotheses (2), (3), and (4), we selected industrial structure rationalization, industrial structure advancement, and energy structure index as the mediator variables.
Table 2.
Data Explanation and Descriptive Statistics.
The indicators for measuring industrial structure upgrading include two aspects: industrial structure rationalization and industrial structure advancement.
Industrial structure rationalization is a negative index, and the calculation formula for industrial structure rationalization (IR) is:
Y is the regional GDP, Yi respectively is the added values of industries, L is the total number of regionally employed people, Li respectively, is the number of industrially employed people.
Industrial structure advancement is a positive indicator. In order to calculate it, the method of Fu Ling Hui and Chen Nan Yue et al. is employed to calculate the transfer extent of the primary and secondary industries to the tertiary industry using the vector angle [16, 17].
The energy structure (ES) is represented by the proportion of the regional coal consumption to the total energy consumption. The energy structure is a negative indicator, with smaller values indicating a more reasonable energy structure. The smaller the value is, the more reasonable the energy structure indicates.
Data Explanation and Descriptive Statistics
The research period of the paper is from 2003 to 2022. The remaining 30 provinces, except for the Tibet Autonomous Region and Hong Kong, Macao, and Taiwan regions, are selected as the research samples. The GDP of each year is deflated to 2003. Logarithmic processing is carried out on some variables to overcome the problem of heteroscedasticity. The original data involved in this paper come from the China Statistical Yearbook, China Energy Statistical Yearbook, and China Environmental Statistical Yearbook over the years (see Table 2).
Results and Discussion
Basic Regression Analysis
The dependent variable is carbon emission reduction maturity, which is a positive indicator calculated in the previous section. The basic regression is implemented, and the F test, LM test, and Hausman test are also conducted. To ensure the robustness of the empirical model, each control variable is added successively during the regression. Table 3 shows the basic regression and test results of the impact of green technology innovation on carbon emission reduction maturity.
It can be seen that in the process of successively adding control variables, the regression coefficient of the core explanatory variable, the efficiency of green technology innovation, has always been significantly positive at the 5% level. The result of Column 6 shows that for every 1% increase in green technology innovation performance, the carbon emission reduction maturity level increases by 3%. This fully demonstrates that green technology innovation can effectively restrain carbon emissions and enhance the regional carbon emission reduction maturity level. The hypothesis that green technology innovation directly promotes carbon emission reduction maturity is thus validated.
All control variables are positive indicators, including economic development level, marketization degree, trade openness, and foreign direct investment, showing significantly positive effects at the 5% and 10% levels. However, the regression coefficient of per capita consumption level is -0.014, suggesting that an increase in per capita consumption significantly raises carbon emissions, reducing carbon emission reduction maturity.
Table 3.
Analysis of the Basic Regression Results of the Impact of Green Technology Innovation on Carbon Emission Reduction Maturity.
Heterogeneity Analysis
The heterogeneities of geographical location and marketization degree may result in certain disparities in the impact of green technology innovation on carbon emission reduction maturity. Therefore, it is necessary to conduct heterogeneity analysis on the basic regression results. The regression results are shown in Table 4.
(1) Heterogeneity of geographical location
Model (6) is employed to conduct regression analysis for the eastern, central, northeastern, and western geographical regions, respectively. The results reveal that the impact of green technological innovation on carbon emission reduction maturity in the eastern region surpasses that of other regions. Additionally, the regression coefficients of other indicators in the eastern region exhibit significant positive effects on carbon emission reduction maturity, passing the significance level tests at the 5% and 10% thresholds.
The underlying reason is that, as a relatively economically advanced region, the eastern area outperforms other regions in China in terms of industrial structure, foreign trade, and residents’ consumption levels. This region benefits from superior economic conditions and educational resources, coupled with a robust capacity for green technological innovation and a generally high level of public environmental awareness. Consequently, carbon emission reduction maturity in the eastern region remains at the forefront nationwide.
In contrast, the degree of marketization and trade openness in the central and northeastern regions exhibit significant inhibitory effects on carbon emission reduction maturity, with statistical significance at the 5% and 10% levels. Similarly, in the Western region, the degree of marketization and foreign direct investment demonstrates significant negative impacts on carbon emission reduction maturity at the same significance levels. The primary explanation lies in these regions’ relatively underdeveloped economic status [18]. Historically, they have served as key areas for the relocation of pollution-intensive industries domestically and internationally, as well as for energy resource exploitation. These factors contribute to irrational industrial structures and consistently low carbon emission reduction maturity levels.
(2) Heterogeneity of marketization degree
The market environment also influences the advancement of carbon emission reduction maturity. The median marketization degree of 30 provinces from 2003 to 2022 is 2.003. Based on this threshold, we divide the samples into two groups: regions with marketization degrees above the median (rapid marketization regions) and those below the median (slow marketization regions). Model (6) is subsequently applied to conduct regression analysis on the two sub-samples.
The results demonstrate that the facilitative effect of green technological innovation on carbon emission reduction maturity is significantly greater in rapid marketization regions than in slow marketization regions. In the latter, trade openness and per capita consumption negatively affect the improvement of carbon emission reduction maturity. Rapid marketization regions correspond to economically developed areas of China, where the marketization process has progressed more swiftly than in the slower marketization regions, such as the western and northeastern areas [19]. These regions also exhibit faster optimization of industrial structures and earlier implementation of carbon emission reduction measures. Conversely, the slow marketization regions, primarily economically underdeveloped or underindustrialized areas, experience sluggish marketization processes. The industries transferred to these areas are predominantly characterized by high energy consumption and high emissions. Furthermore, the public in these regions generally lacks low-carbon awareness. These combined factors impose significant inhibitory effects on carbon emission reduction maturity.
Table 4.
Heterogeneity Analysis Under the Geographical Location and Marketization Degree.
Mediating Effect Analysis
The regression coefficient (β1) of green technology innovation in the basic regression is significantly positive, so we conducted regression verification of the mediating effect of green technology innovation on carbon emission reduction maturity based on models (7), (8), (9), and (10). Table 5 shows the test results of the mediating effects of industrial structure and energy structure on carbon emission reduction maturity.
Columns 1, 3, and 5 present the regression results of green technology innovation and control variables on the three mediating variables, respectively. Since industrial structure rationalization and energy structure are negative indicators, the regression coefficients of green technology innovation on these two indicators are significantly negative. This indicates that green technology innovation significantly reduces industrial structure rationalization and the proportion of coal consumption in total energy consumption. Conversely, industrial structure advancement is a positive indicator, and the regression coefficient of green technology innovation on industrial structure advancement is significantly positive, suggesting that green technology innovation facilitates the advancement of the industrial structure.
Columns 2, 4, and 6 display the regression results of green technology innovation on carbon emission reduction maturity, incorporating different mediating variables. The results demonstrate that the mediating variables significantly affect carbon emission reduction maturity at the 5% and 10% significance levels. After accounting for the mediating variables, the positive impact of green technology innovation on carbon emission reduction maturity diminishes or remains consistent compared to the results without mediating variables. These findings confirm that industrial structure and energy structure act as mediators in the relationship between green technology innovation and carbon emission reduction maturity. The mediating transmission pathway, “green technology innovation → industrial structure rationalization → industrial structure advancement → energy structure → improved carbon emission reduction maturity", is validated, verifying hypotheses 2, 3, and 4.
Table 5.
The mediating effect test of industrial structure and energy structure on carbon emission reduction maturity.
Moreover, the coefficients for industrial structure rationalization and energy structure are negative, indicating that a 10.4% improvement in industrial structure rationalization leads to a 1.0% increase in carbon emission reduction maturity, while a 1% reduction in the proportion of coal consumption in total energy consumption results in a 2.6% increase in carbon emission reduction maturity.
Robustness Test
To ensure the robustness of the empirical results, a series of robustness tests are conducted. First, in the individual fixed-effects panel data regression of model (6), control variables are added incrementally. The regression coefficient of green technology innovation on carbon emission reduction maturity remains significantly positive, confirming the consistency of the results. Similarly, in the analyses of geographic location heterogeneity and marketization degree heterogeneity, the regression coefficients of green technology innovation on carbon emission reduction maturity are also significantly positive, reaffirming that green technology innovation directly promotes carbon emission reduction maturity.
Second, in the mediating effect analysis, industrial structure rationalization, industrial structure advancement, and energy structure are incorporated into the baseline regression model. A joint significance test is performed to evaluate the impact of green technology innovation on carbon emission reduction maturity. The regression coefficient of green technology innovation remains significantly positive, further demonstrating that green technology innovation indirectly enhances carbon emission reduction maturity through mediating variables.
Finally, the urbanization level (measured as the proportion of the urban population to the total population) is used as a substitute for the per capita consumption level, and the empirical analysis is repeated within the existing model. The results consistently show that green technology innovation exerts both direct and indirect promoting effects on carbon emission reduction maturity. These findings confirm that the empirical analysis exhibits strong robustness.
Conclusions
This paper calculates the carbon emission reduction maturity of 30 provinces in China from 2003 to 2022. By analyzing the influence mechanisms of green technology innovation on carbon emission reduction maturity, it employs an individual fixed-effects panel model and mediating effect analysis to derive the following conclusions:
1. China’s overall carbon emission reduction maturity exhibits a fluctuating yet steady upward trend, with the national average increasing by approximately 23.4% over the study period. However, significant regional disparities persist. The eastern region demonstrates the highest maturity levels, with Beijing, Shanghai, and Guangdong exceeding an index value of 90 by 2022, while provinces in the western region, such as Ningxia and Xinjiang, remain below 65. These disparities highlight the need for region-specific policy interventions [20].
2. Green technology innovation contributes to carbon emission reduction maturity through both direct and indirect channels. A 1% increase in green technology innovation leads to an estimated 0.85% rise in carbon emission reduction maturity. Additionally, green technology innovation plays a crucial role in carbon capture, storage, and utilization, facilitating long-term emission control [21]. The indirect effects are mediated through structural transformation—industrial structure upgrading explains 21.8% of the total effect, while energy structure optimization accounts for 18.4%. These mechanisms indicate that fostering green technology can significantly enhance carbon reduction maturity across different economic sectors.
3. The results from the fixed-effects panel model confirm that green technology innovation has a significant and positive impact on carbon emission reduction maturity, with evident geographic and marketization heterogeneity. Provinces with stronger market mechanisms and higher technological advancement benefit more substantially from green innovation. The spatial analysis further reveals that technological progress in one province has a spillover effect, increasing the carbon reduction maturity of neighboring provinces by approximately 0.27%. The mediating effect analysis validates that industrial structure upgrading and energy structure optimization partially mediate this relationship, reinforcing the overall contribution of green technology innovation to carbon reduction maturity. These findings emphasize the importance of coordinated regional policies and targeted support for green technology innovation.
Recommendations
1. Green technology innovation is a critical policy tool for enhancing carbon emission reduction maturity and achieving “dual carbon” goals. Given its heterogeneous emission reduction effects, the government should adopt differentiated regional economic development strategies, increase investment in green technology innovation projects, refine green innovation patent management systems, and improve the efficiency of translating innovations into practice. A collaborative mechanism linking “regional green technology innovation” with “comprehensive carbon emission reduction” should be established to provide greater support for green technology initiatives in central, northeastern, and western regions. These measures would harness the spatial spillover effects of green technology innovation, enabling developed regions to drive less developed regions’ green and low-carbon advancement.
2. The government should enhance the path dependence of carbon emission reduction by fostering mature green technology innovation. This involves optimizing regional industrial structure layouts, upgrading traditional high-energy-consuming industries, and improving new energy utilization efficiency to achieve low energy consumption alongside high-quality outputs. Developed regions should lead in researching and developing clean energy and energy-saving technologies to enhance the efficiency of green technology transformation and application, ultimately building a zero-carbon or low-carbon industrial system [22]. Less developed regions should leverage green technology innovation to drive the green transformation of traditional industries, promote industrial structure rationalization and advancement, and narrow regional disparities in carbon emission reduction maturity.
3. International trade opportunities should be fully utilized to strengthen global cooperation in green technology. Enterprises should be encouraged to adopt advanced low-carbon technologies and equipment and actively participate in establishing international green technology standards. The government should foster a value orientation of resource conservation and environmental protection, advocate green and low-carbon consumption, and promote the large-scale adoption of green technologies through green consumption awareness and demand for green products. Additionally, a comprehensive green consumption support system should be established, including green product certification standards and carbon footprint evaluation systems, to provide high-quality green consumption experiences and enhance public willingness to adopt green consumption practices.

