

Introduction
The proportion of China’s textile industry is large. The high concentration of wastewater discharged poses a serious threat to the aquatic environment. Especially in the textile industry, the Printing and Dyeing Wastewater (PDW) pollution is particularly prominent [1-2]. PDW has always been a global concern. At present, the main treatment technologies include chemical methods, heat treatment methods, and biological methods [3]. As the types and components of dyes increase, PDW has become more complex, with characteristics such as high chromaticity and antioxidant, which puts forward higher requirements for wastewater treatment [4]. In the context of increased environmental requirements and resource limitations, various advanced technologies have been used for wastewater treatment, including efficient flocculants to improve pretreatment capacity, membrane separation technology to recover water resources and useful substances, and biological methods to treat high-concentration and complex wastewater [5]. At present, although efficient flocculants, membrane separation technology, and biological treatment methods have achieved certain results in wastewater treatment, there are still some shortcomings. Coagulants can cause secondary pollution when removing dyes. Membrane separation technology faces membrane fouling and high costs. Biological treatment methods have poor efficacy and long treatment cycles for certain high-concentration and difficult-to-degrade organic compounds. A combined process technology based on heterogeneous catalytic ozonation and Biological Aerated Filter (BAF) coupling is proposed to address these issues. The innovation of this study lies in the synergistic optimization of PDW treatment by combining chemical oxidation and biological treatment. This coupling process fully utilizes the advantages of heterogeneous catalytic ozonation in degrading high-concentration and difficult-to-degrade organic compounds, while considering the high chromaticity and antioxidant properties of PDW. Moreover, this process utilizes BAF to further remove residual pollutants from PDW, ensuring that the effluent quality meets the standard.
The research content includes four sections. The first section reviews the treatment and reuse of PDW, as well as ozone oxidation technology. The second section conducts an experimental design on PDW based on ozone oxidation. The first subsection introduces the experimental setup and materials. The second subsection introduces the specific experimental projects and plans. The third section focuses on the experimental method and analyzes the results. The fourth section discusses the experimental results and proposes future prospects.
Related Works
PDW contains abundant organic and inorganic pollutants, and effective treatment is beneficial for improving the ecological environment. Rahimi and Alihosseini used bentonite to adsorb dyes and convert excess sludge into pigments to treat cationic dye wastewater. The results showed that the adsorption capacity of bentonite for alkaline red 46 dye could reach 467 mg/g, significantly reducing the turbidity, TDS, and COD of the wastewater. The generated hybrid had a nano-layer structure, and its thermal stability was improved by about 30 ℃ [6]. Regarding the textile PDW, Uddin proposed a combined treatment method based on Hydraulic Cavitation and Ozone (HC + O3). The results showed that this method could effectively remove pollutants and ensure that the effluent meets the discharge standards. The synergistic effect of (HC + O3) could degrade organic matter and remove high molecular weight, strong aromatic organic matter, reducing DOM to low-apparent relative molecular weight compounds [7]. To solve the difficulty of treating PDW, Yang et al. utilized Plant Biomass Carbon (PBC) to adsorb dyes. The results showed that PBC was an efficient and economical technology for treating PDW, which could effectively remove dyes. However, the current research still has shortcomings. The adsorption mechanism and optimized preparation methods of PBC should be further explored in the future [8]. To treat the PDW, Bidu et al. took PSBFs as flocculants. The results showed that the PSBF could effectively remove chromaticity and Chemical Oxygen Demand (COD). Compared with other flocculants, PSBF had higher performance, which could effectively improve water quality. Therefore, PSBF was a promising new method for treating PDW [9]. Cai et al. proposed a novel three-step process, including disc tube reverse osmosis and low-temperature crystallization. The results showed that this process achieved efficient treatment and recovery of wastewater. It could effectively remove organic matter, chromaticity, and salinity from the wastewater. Meanwhile, the crystalline products had high purity and recovery rate, providing a new solution for PDW [10].
At present, ozone oxidation technology is extensively applied to treat industrial wastewater. Regarding organic micro pollutants in urban sewage treatment plants, Schoenell et al. proposed a photochemical method combining ozone with ultraviolet A-type light-emitting diodes and hydrogen peroxide. The results showed that this method could effectively remove various organic micro pollutants, including candesartan, irbesartan, etc., with a maximum removal fraction of 93.3%. This method had high efficiency and low cost, providing a new solution for urban wastewater treatment [11]. Ma et al. used advanced oxidation technologies such as ozone and solar energy to deeply treat gray water. The results showed that solar peroxide technology had the best treatment effect. It could effectively remove organic matter and significantly improve the quality of grey water, providing strong support for grey water reuse [12]. To address the emerging stubborn pollutants in wastewater, Mahy et al. used advanced oxidation processes with nano-catalysts and ozone for wastewater treatment. The results indicated that nanocatalysts could improve ozone utilization efficiency and mineralization efficiency, providing a new solution for wastewater treatment [13]. Cifcoglu-Gozuacik et al. proposed a coupled computational model based on fluid dynamics, mass transfer, and ozone oxidation reaction to optimize the performance of the ozone oxidation tower reactor in treating the PDW. The model could more accurately predict the ozone bubble process and effectively improve the performance of the ozone oxidation tower [14]. Regarding the ozone oxidation wastewater, Dopp et al. used a kinetic and mechanistic research method for ozone oxidation reactions. The results indicated that this method was more effective in analyzing the mechanics of ozone reactions. Meanwhile, this method could also evaluate the emission reduction efficiency and conversion products of organic pollutants in ozone oxidation wastewater treatment [15]. The comparison between this research and other similar research is shown in Table 1.
In summary, some domestic and foreign researchers have conducted extensive research on the treatment and reuse of PDW, as well as explored the treatment effect of ozone oxidation on wastewater. Therefore, the research explores the combination process technology of ozone oxidation catalytic technology and BAF. It is expected to promote the development of biochemical effluent and reuse technology for PDW.
Experimental Design of PDW Treatment Based on Ozone Oxidation Treatment
The research aims to explore the advanced treatment method for COD in PDW by combining catalytic ozone oxidation and the BAF process. The research work will revolve around several key points. First, water samples are collected from the biochemical treatment effluent of a certain printing and dyeing park, and necessary experimental instruments are prepared. Second, the coagulation sedimentation method is used to pre-treat the water sample to reduce the impact of suspended solids on subsequent experiments. Third, a self-made 304 stainless steel reactor is used for ozone oxidation catalytic testing to evaluate the performance of different catalysts in the ozone oxidation process. Fourth, a BAF reactor is constructed, and a series of start-up steps are carried out to further process the water sample after catalytic ozonation. Fifth, based on small-scale experimental data, a pilot experimental device with a processing capacity of 1 m3·h-1 is designed and operated to verify the feasibility and stability of the technology. Sixth, the evaluation indicators for the catalytic ozonation BAF combination process are established. Seventh, catalysts with different supports and transition metal loadings are prepared for subsequent performance evaluation experiments.
Experimental Materials and Apparatus
Materials
The water sample used in the experiment is from the biochemical treatment wastewater of a certain printing and dyeing park. The park involves multiple industries, but the main type is PDW, with a daily treatment capacity of 7,000~10,000 m3. BOD5 measures the amount of oxygen consumed during the biological decomposition of organic matter in wastewater. COD measures the amount of oxygen consumed by organic and inorganic reducing substances in wastewater under chemical oxidation. In the incoming water quality of the park, the BOD5 content is 100-150 mg·L-1, and the COD content is 500-600 mg·L-1. In addition, the water also contains high concentrations of suspended solids, chromaticity, and some dye components. The BOD5 and COD concentration data in the experimental materials refer to the effluent after biochemical treatment in a certain printing and dyeing park, rather than the original influent. According to relevant standards, wastewater discharge needs to meet specific water quality standards, including the B-level standard of the Water Quality Standard for Sewage Discharge into Urban Sewers and the three-level standard of the Comprehensive Wastewater Discharge Standard. The sewage treatment plant adopts traditional biochemical treatment methods and enhanced coagulation and sedimentation technology. The processing process is mainly divided into three stages. First, the suspended impurities in the water are filtered out through the grid, and the pH value is adjusted. Second, the used A/A/O process aims to reduce COD, nitrogen, phosphorus, and other pollutants in water. Finally, the medication coagulation method is used to further reduce the suspended solids content in water [16-17]. To investigate the treatment effect of catalytic ozonation-BAF combined process on COD in PDW, the effluent of the secondary sedimentation tank in the biochemical treatment process is selected as experimental water. Table 2 displays the water quality parameters.
Table 1.
Comparison between this research and other similar research.
Experimental Method Design
Experimental Water Sample Pretreatment
Before the experiment, the experimental water sample is pretreated to reduce the impact of suspended solids on subsequent catalytic ozone oxidation experiments [18]. The study selects two widely used coagulants: Polyferric Sulfate (PFS) and Polyaluminum Chloride (PAC), which are formulated into solutions with mass concentrations of 30% and 10%, respectively. First, these flocculants are added to the water sample in the predetermined ratio. Subsequently, the mixture is poured into an electronic stirrer and the initial stirring speed is set to 300 rpm, stirring continuously for 20 minutes. Next, the stirring speed is reduced to 100 rpm and continued for 10 minutes. After completing this series of reactions, the mixture is left to stand for 60 minutes [19]. Finally, after precipitation, the supernatant is removed from the mixture and used for subsequent experiments.
Table 2.
Quality parameters of the experimental water.
Table 3.
Laboratory instruments.
Ozone Oxidation Catalysis
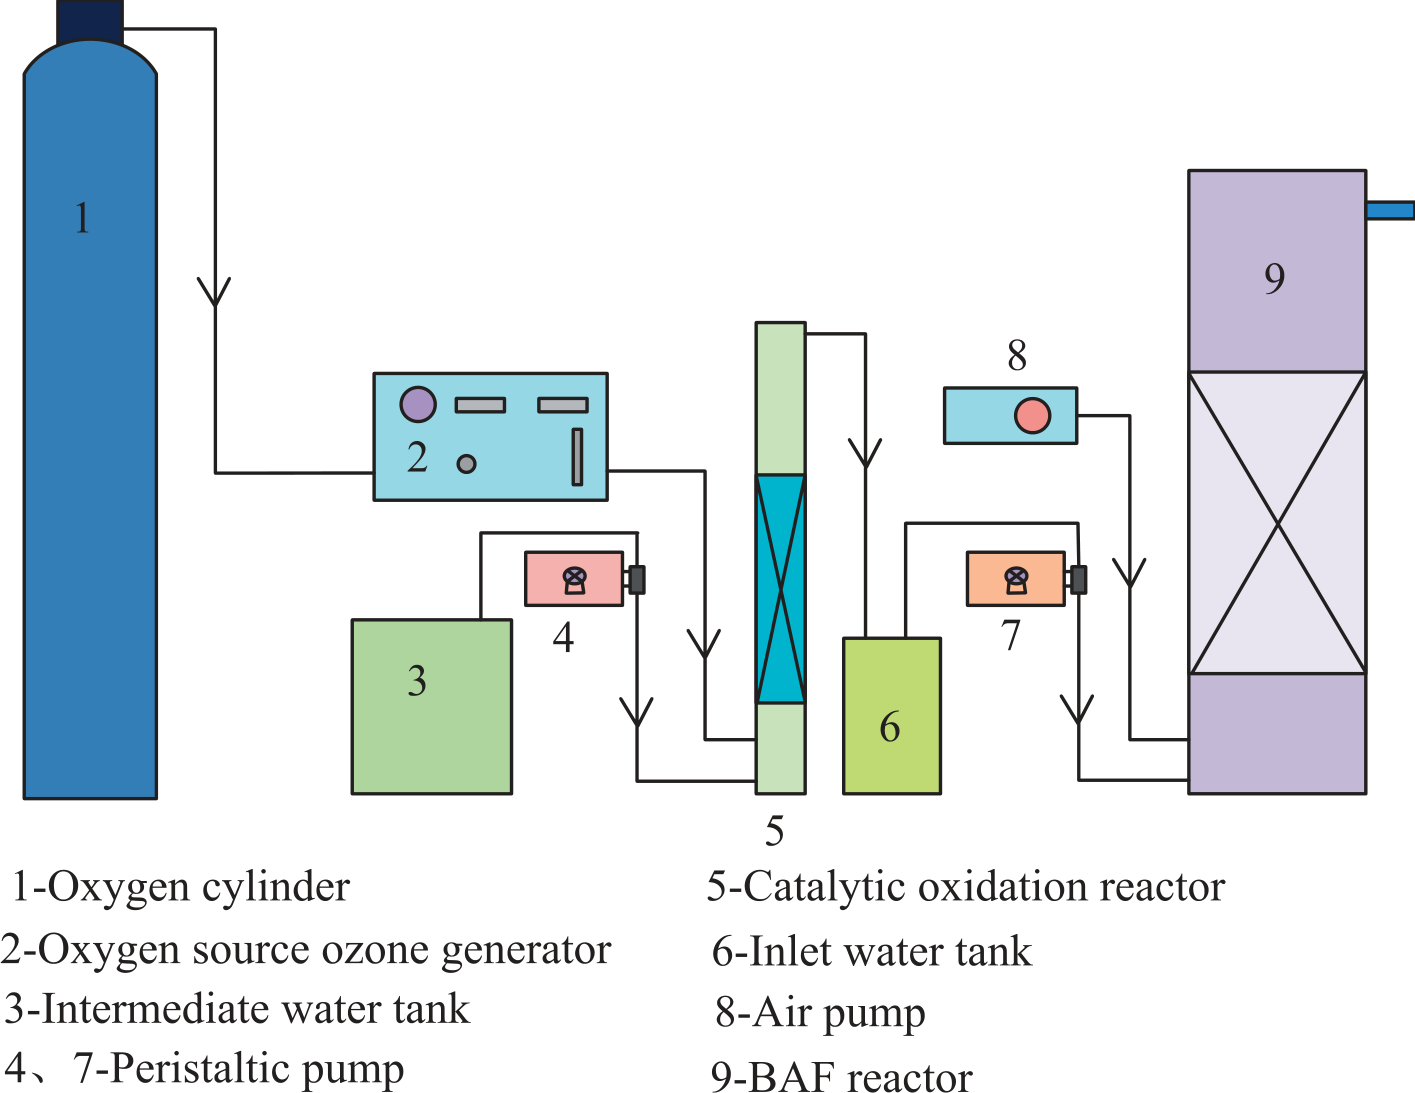
Ozone catalytic oxidation is a process that occurs through the synergistic action of ozone and a catalyst. Ozone is a strong oxidant with oxidation properties hundreds of times stronger than oxygen. With the help of catalysts, ozone molecules decompose in water, releasing hydroxyl radicals and oxygen radicals. These types of free radicals have extremely strong oxidizing ability and can destroy the structure of organic pollutants in water. In the ozone oxidation catalytic experiment, a self-made 304 stainless steel reactor with a diameter of 80 mm and a height of 1,000 mm is used. Perforated stainless steel support plates and aeration plates are installed at the bottom of the reactor. A small experimental system is constructed around the reactor. This system mainly includes a catalytic oxidation reactor, BAF reactor, oxygen source, ozone generator, oxygen cylinder, air pump, peristaltic pump, intermediate water tank, and inlet water tank [20-21]. The device is displayed in Fig. 1.
In a static experiment, the specific steps are as follows. First, connect all devices properly, including oxygen cylinders, ozone generators, air pumps, peristaltic pumps, intermediate water tanks, and inlet water tanks. All valves and pipelines are confirmed to be well sealed to prevent leakage. Next, fill the 5-catalytic oxidation reactor with an appropriate amount of catalyst. Then, add 2 L of water sample. Adjust the pressure of the oxygen cylinder to 0.09 MPa. Start the cooling water inlet pump of the 2-ozone generator, connect the power supply, and adjust the flow meter and current. Finally, when the ozone concentration is in a stable state, open the inlet valve of the 5-catalytic oxidation reactor, adjust the inlet flow rate, and record the reaction time. In the continuous experiment, after filling a certain amount of catalyst in the 5-catalytic oxidation reactor, start the 2-ozone generator according to the static experiment method. Then, adjust the speed of the inlet peristaltic pump to control the inlet flow rate of the 5-catalytic oxidation reactor. Once ozone is introduced into the reactor, the peristaltic pump is turned on to continuously pump in the experimental water sample, and the reaction time is recorded [22].
Start-up of BAF Reactor
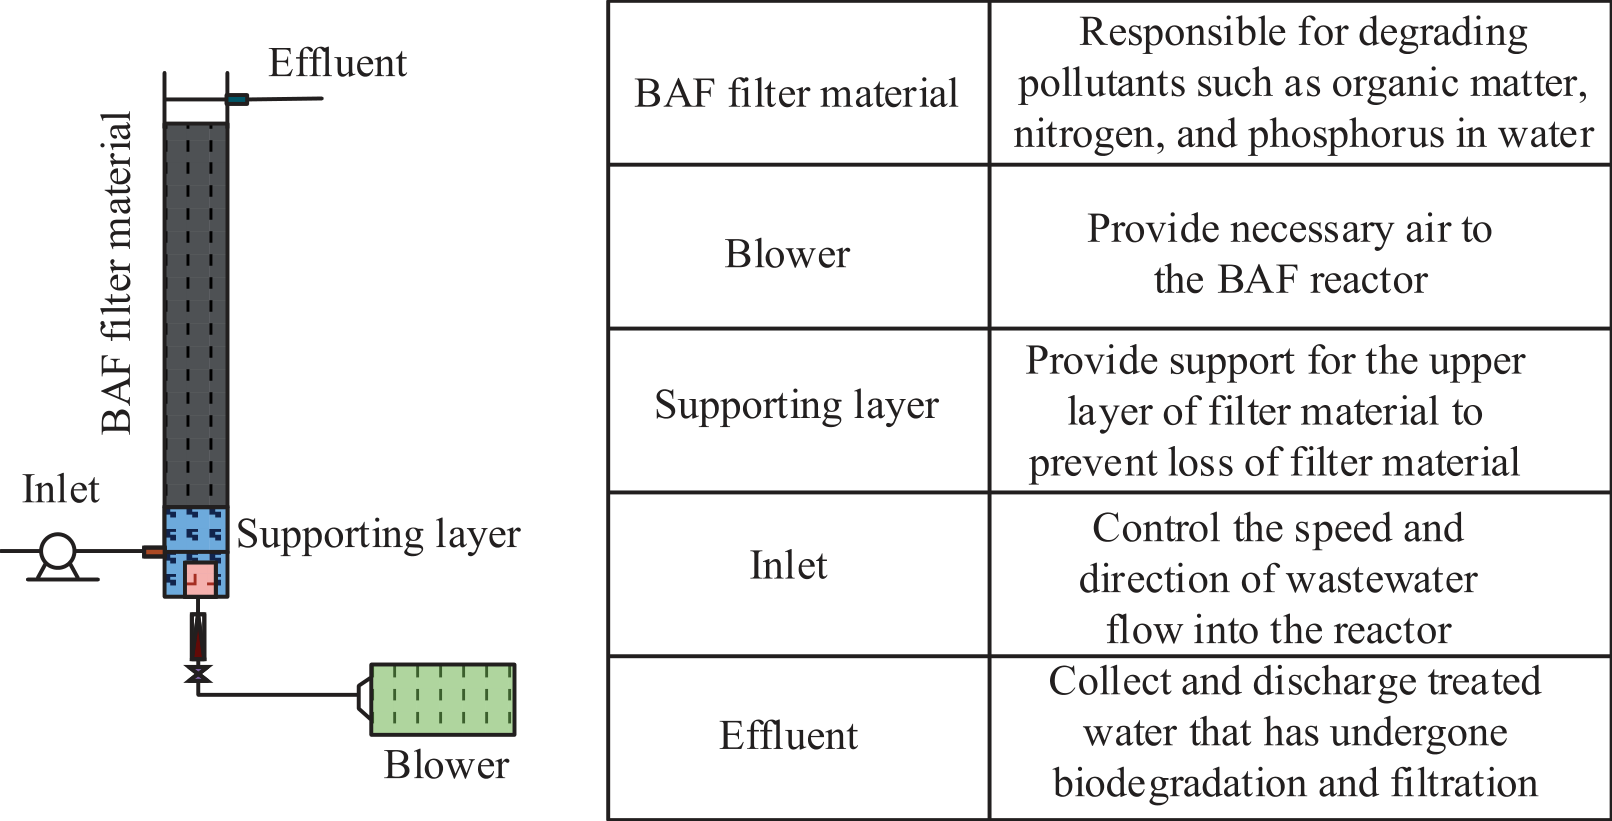
The BAF reactor is made of organic glass tubes with a diameter of 300 mm. Its bottom is equipped with a support plate, an aeration plate, and a water distribution area. The reactor is filled with ceramic particles with a diameter of 3-5 mm. The start-up method of the BAF reactor includes three stages. In the first stage, 10 L of effluent from the aerobic tank of the sewage treatment plant is taken and mixed with 10 L of distilled water containing 0.2 g of urea, 0.1 g of potassium dihydrogen phosphate, and 5 g of glucose. After mixing evenly, the solution is injected into the reactor. Then, the aerator is turned on for 10 h of suffocation treatment, and left to stand for two h after completion. Finally, the reactor is emptied, and the above steps are repeated 6 times. In the second stage, water samples that have undergone catalytic ozone oxidation are continuously injected into the reactor. Next, the glucose is added to ensure that each liter of water sample contains 0.05 g of glucose, and the flow rate is adjusted to 2 L/h. Finally, it is subjected to a 5-day aeration operation. In the third stage, the water sample that has undergone catalytic ozone oxidation is extracted and continuously fed into the reactor. Meanwhile, the flow rate is adjusted to 4 L/h, and the dissolved oxygen in the effluent is controlled at around 3 mg/L. The reactor operates continuously and detects the COD value in the inlet and outlet water. When the COD removal rate of the effluent remains stable, it indicates that the start-up is completed [23, 24]. The device of BAF is shown in Fig. 2.
Pilot Experiment
A pilot experimental setup with a processing capacity of 1 m3/h is developed based on previous small-scale experimental data. This device mainly includes pre-treatment equipment, catalytic ozone oxidation equipment, BAF, ozone generator, aeration device, and control system [25]. First, the inlet flow rate and the operating speed of the dosing pump are adjusted according to the determined drug dosage in the small-scale experiment, and the pre-treated effluent is tested. After the preprocessing effect reaches the preset goal, the preprocessing system ends. Next, the oxygen cylinder is opened and the pressure is changed to 0.11 MPa. Then, the intake valve of the oxidation tower is opened to adjust the flow rate. Once the gas volume stabilizes, the cooling water switch and power supply of the ozone generator are sequentially turned on. The power of the ozone generator is changed to achieve the target reading of the ozone concentration detector. Finally, the inlet pump of the oxidation tower is turned. The inlet flow rate is adjusted to control the hydraulic retention time. For the BAF section, the research takes the aerobic activated sludge from the sewage treatment plant as the inoculum source. The catalytic ozone oxidation effluent is used as starting water. The specific start-up method is consistent with the small-scale experiment. Based on the flow meter of the air compressor, the research aims to maintain the dissolved oxygen concentration at the end of the BAF at around 3 mg/L. In addition, air water backwashing is required every 15 days. After the system runs stably, the experimental personnel conduct two water quality indicator tests every day. Instantaneous water samples are collected from the influent, coagulation and sedimentation effluent, catalytic oxidation tower A/B effluent, and biochemical tower A/B effluent, respectively [26, 27]. The daily analysis items include pH value, COD, Total Phosphorus (TP), Total Nitrogen (TN), Ammonia Nitrogen (NH3-N), Total Organic Carbon (TOC), chromaticity, and turbidity [28]. The pilot test process is displayed in Fig. 3.
Measurement Items and Testing Methods
The items and methods measured in the experiment mainly refer to the Water and Wastewater Monitoring and Analysis Methods (Fourth Edition) of the State Environmental Protection Administration. The specific methods are shown in Table 4.
Catalyst Preparation
In heterogeneous catalytic ozonation reactions, catalysts play a crucial role. It can decompose ozone into hydroxyl radicals, thereby improving the ozone utilization efficiency. Catalysts exert two main functions in the reaction system. One is to promote the chain reaction of ozone in water, thereby generating more hydroxyl radicals and enhancing the removal effect of difficult-to-degrade organic matter. The second is to enhance the treatment capacity of organic matter through the synergistic effect of adsorption, oxidation, and re-desorption. The catalyst performance is mainly determined by the adsorption effect of the carrier and the catalytic effect of the load. Common carrier materials include molecular sieves, activated carbon, ceramic particles, etc., all of which have a large specific surface area and porous structure. The catalytic active metals mainly include transition metal elements such as iron, titanium, manganese, copper, etc. [29]. To improve the processing capacity of the catalytic ozonation reaction system, the performance of several transition metals and catalysts prepared with different carriers is compared. The goal is to select the catalyst with the best removal effect on organic matter in the biochemical effluent of PDW, and conduct performance testing.
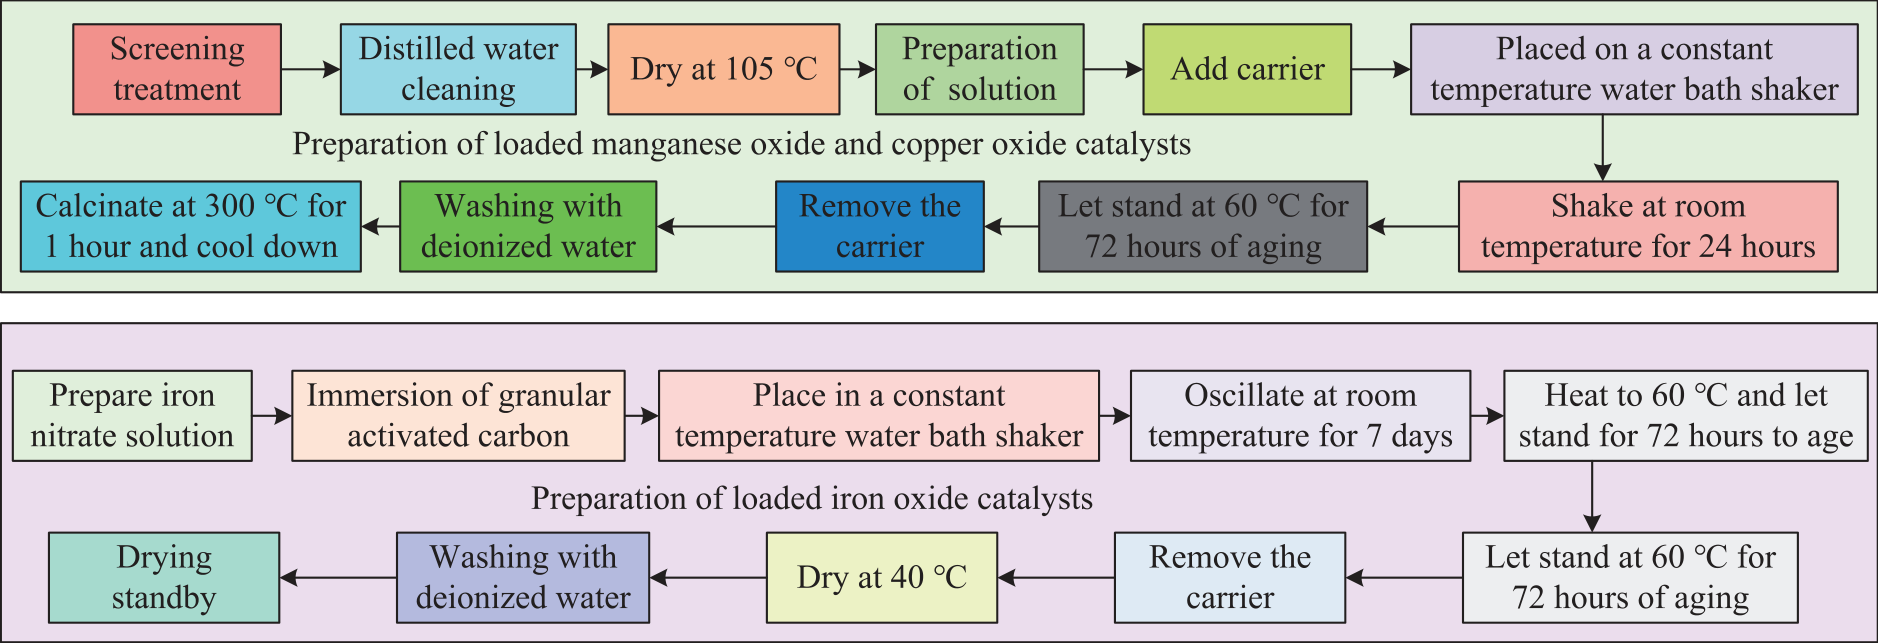
To compare the performance of economically viable particle-activated carbon, columnar activated carbon, and ceramic particles as carriers, the research mainly uses the impregnation method to prepare loaded catalysts [30, 31]. The specific steps for preparing loaded manganese oxide and copper oxide catalysts are as follows. Firstly, these three carriers of granular activated carbon, columnar activated carbon, and ceramic particles are sieved to remove the powder and washed several times with distilled water. Then, the carrier is dried at 105ºC for subsequent use. Next, the experimenters prepare a potassium permanganate (copper nitrate) solution and add it to the carrier. Then, it is placed in a constant, steady water bath shaker and shaken at room temperature for 24 h. Next, it is left to stand at 60ºC for 72 h. Subsequently, the carrier is removed and rinsed several times with deionized water. Finally, the carrier is calcined at 300ºC for 1 hour and cooled. When preparing loaded iron oxide catalysts, a certain concentration of iron nitrate solution is first prepared and then immersed in a certain amount of granular activated carbon. Then, it is placed in a constant heat water bath shaker and shaken at room temperature for 7 days. It is left to stand at 60ºC and aged for 72 h. Afterwards, the carrier is dried at 40ºC and rinsed repeatedly with deionized water. Finally, the carrier is dried for later use. Based on the above steps, Particle Activated Carbon Loaded Manganese Oxide (MAc), Particle Activated Carbon Loaded Copper Oxide (CAc), Columnar Activated Carbon Loaded with Manganese Oxide (MAc-1), Particle Activated Carbon Loaded with Iron Oxide (FAc), and Ceramic Particle Loaded Manganese Oxide (MCe) are experimentally prepared for subsequent performance validation. The catalyst preparation steps are shown in Fig. 3.
Table 4.
Measurement items and testing methods.
Analysis of the Treatment Results of PDW Based on Ozone Oxidation
This section mainly focuses on implementing experiments designed for exploration and obtaining corresponding results. In the first subsection, the adsorption performance and activity of different catalysts were evaluated by measuring their COD removal rates in a triangular flask. The catalytic effect and stability of the MAc catalyst were analyzed in detail, and its removal efficiency of COD, TOC, and BOD5 in the ozone oxidation process was evaluated. The stability after repeated use was also observed. In addition, scanning electron microscopy analysis was conducted on the MAc catalyst to examine the surface structure and metal oxide loading. In the second subsection, the research investigated the effects of different coagulant dosages on effluent COD and removal efficiency, and analyzed the impact of different MAc catalyst dosages on catalytic oxidation reactions. In addition, the effects of ozone dosage, ozone concentration, and pH value on the ozone oxidation catalytic system were explored. In the third subsection, an analysis experiment was conducted on the combination treatment of ozone oxidation catalysis and BAF. The effects of catalytic ozone oxidation on the biodegradability of wastewater, the composition characteristics of organic matter in water, and the adsorption performance of activated carbon were explored. Moreover, the effectiveness of the ozone oxidation catalytic BAF combined process technology in treating PDW biochemical wastewater was verified. The treatment effects of single-stage and two-stage ozone oxidation catalytic BAF systems were compared. Finally, the removal efficiency of COD and the stability of effluent quality were evaluated through pilot experiments.
Catalyst Performance Analysis
The Adsorption Performance and Activity of Catalysts
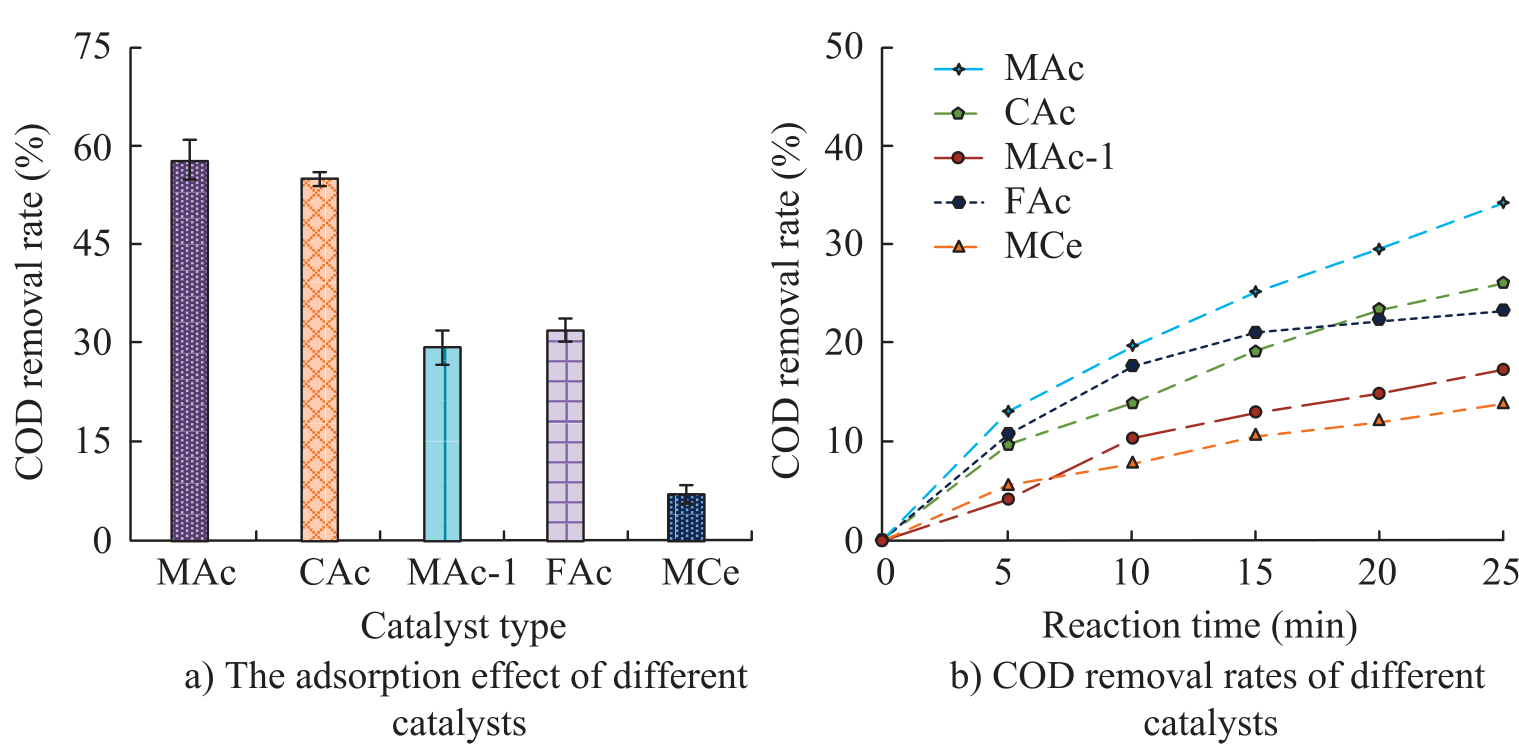
To verify the adsorption performance and activity of different catalysts, 100 mL of pre-treated water sample and 50 g of catalyst are added to a 250 mL triangular flask. The adsorption performance and activity of several catalysts for organic matter in water were evaluated by observing the COD reduction in the water sample. Fig. 4 displays the detection results. In Fig. 4a), the MAc and CAc catalysts had the most significant adsorption effect on organic matter, with COD removal rates of 58.26% and 56.15%, respectively. The adsorption effect of MCe was the worst, with a COD removal rate of only 9.61%. From Fig. 4b), compared with other catalysts, MAc had the most significant COD removal effect, with a COD removal rate of 35.68% after 25 minutes. The early removal rate of FAc exceeded that of CAc, but was lower than that of CAc after 18 minutes. This may be due to the Fe(OH)3 colloid and FeOOH formed by the hydrolysis of iron nitrate in the FAc catalyst, which may block carrier channels and reduce their removal efficiency. This indicates that MAc has better adsorption performance and activity. In addition, the reaction rate constant of the MAc catalyst is relatively large, and the degradation efficiency is high. It can rapidly degrade organic matter in water within a certain period of time. The reaction of MAc conforms to a first-order kinetic model. The reaction rate exhibits exponential decay over time, indicating that the catalyst can continuously provide high degradation efficiency for a long period of time. In contrast, the degradation rate constants of CAc and FAc catalysts are lower, and the fitting results of the reaction process show that their degradation process has certain nonlinear characteristics. This indicates that these catalysts may have complex catalytic mechanisms or inhibitory effects in degrading organic matter in water.
Analysis of MAc Catalytic Effect and Stability
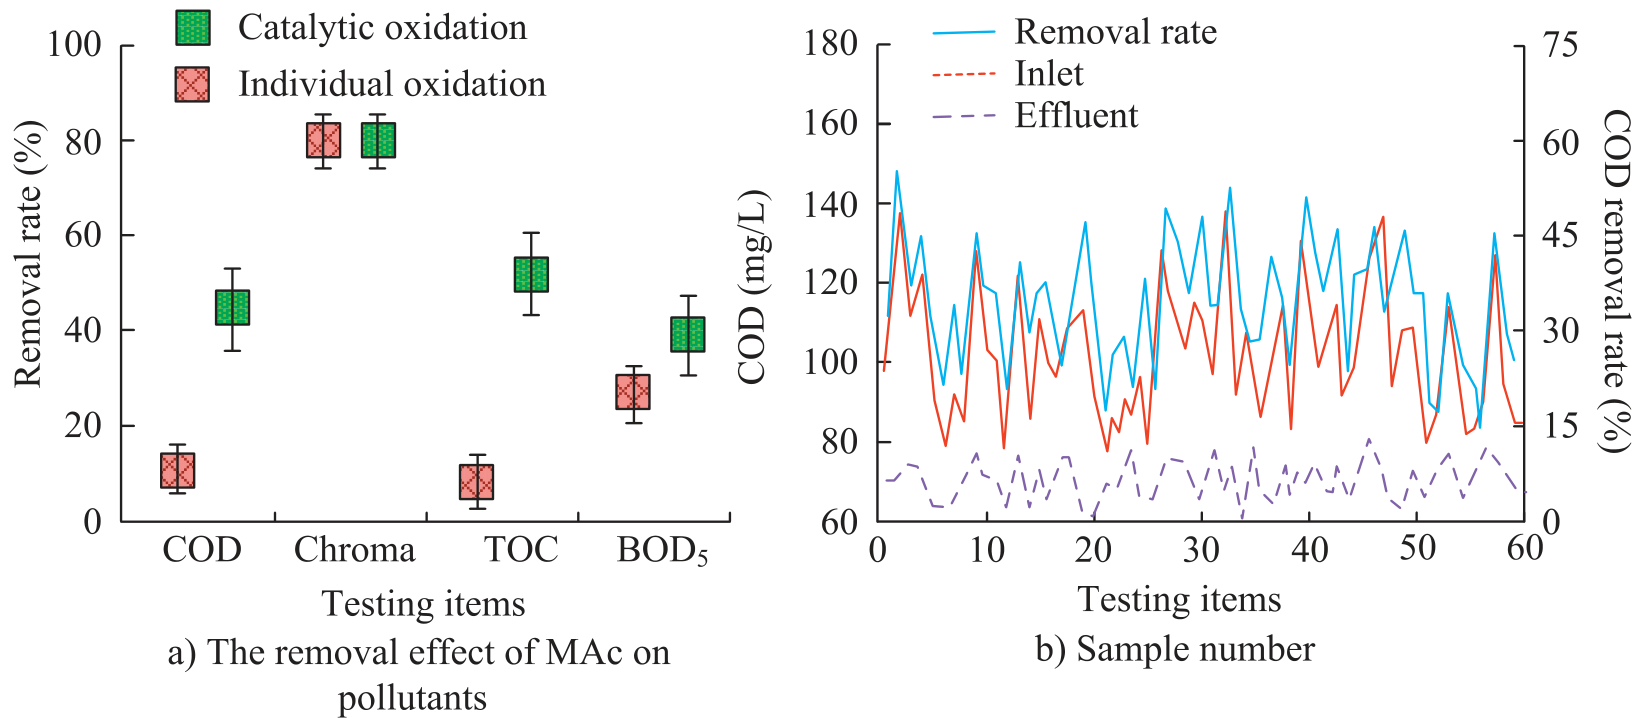
The research continues to verify the catalytic effect and stability of MAc. Fig. 5 displays the test results. In Fig. 5a), adding MAc as a catalyst during the ozone oxidation process significantly improved the COD removal efficiency, TOC, and BOD5 in the water sample compared with the ozone oxidation alone. After adding the MAc catalyst, the removal rates of COD, TOC, and BOD5 were 43.28%, 49.83%, and 38.73%, respectively. Meanwhile, both catalytic ozonation and individual ozonation showed good results in removing chromaticity, achieving a removal rate of 80%. This indicates that ozone has a strong oxidizing ability towards the chromophores in PDW. In summary, the catalytic ozonation system with MAc as a catalyst can significantly enhance the removal ability of various organic molecules in water samples. From Fig. 5b), after 60 experiments, the effluent COD value fluctuated between 60-83 mg/L. Moreover, the COD removal rate did not show a significant downward trend with the increase in usage times. This indicates that the metal oxide loading in the MAc catalyst is good, which can maintain relatively stable catalytic activity over long-term usage. UV-Visible spectroscopy analysis technology is used to detect the differences in organic components before and after the reaction. It can be concluded that true chemical degradation occurs during the reaction process, rather than physical adsorption or absorption.
Scanning Electron Microscopy Analysis of MAc Catalyst
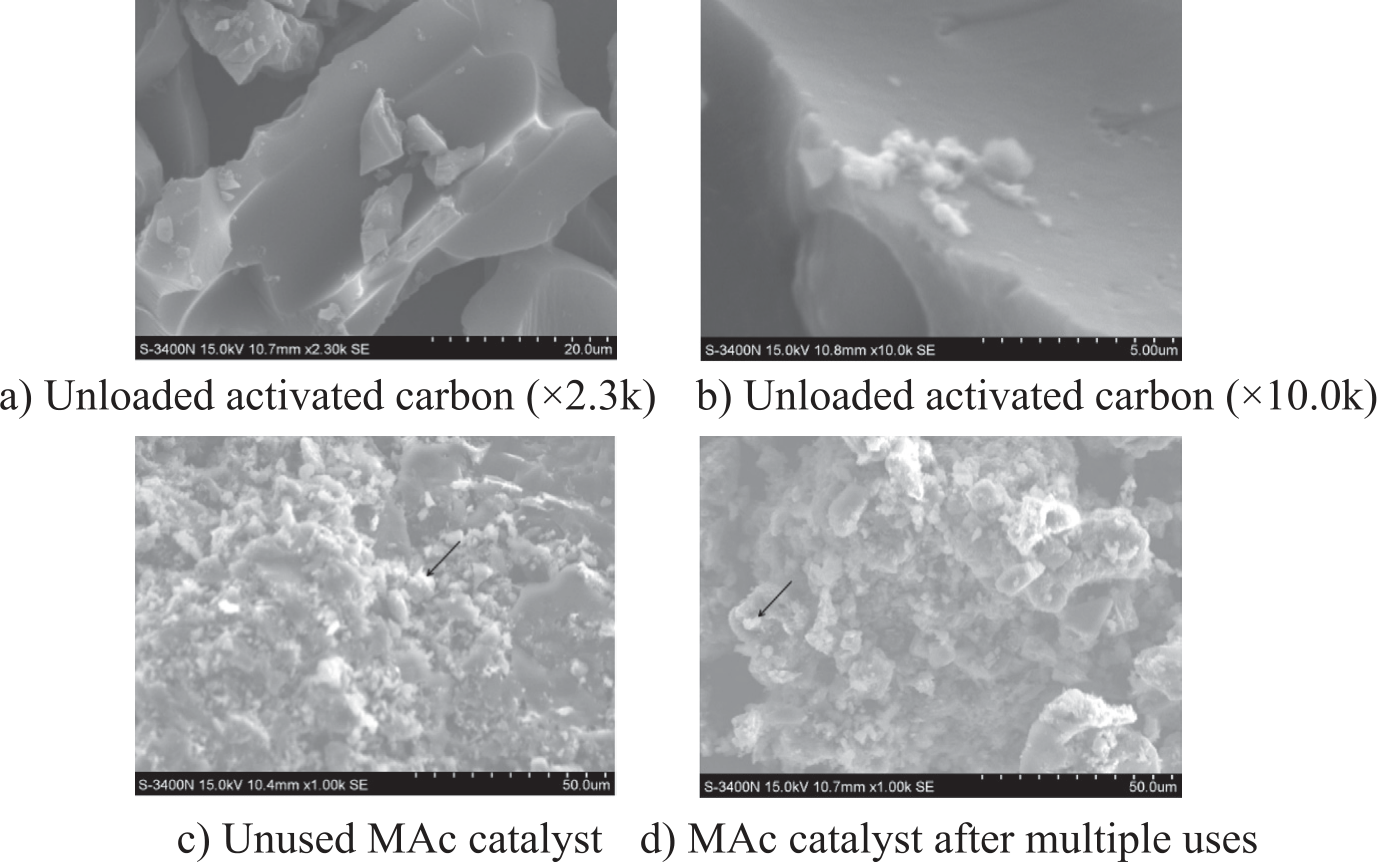
The study conducts Scanning Electron Microscopy (SEM) analysis on MAc catalysts, as shown in Fig. 6. From Fig. 6a) and 6b), the pores on the surface of activated carbon were relatively abundant, but there was a small amount of impurities. From Fig. 6c), many non-activated carbon crystal clusters were distributed on the surface of activated carbon, which successfully loaded metal oxide components. The wrinkles on the catalyst surface were reduced and smoother. From Fig. 6d), the continuously used catalyst surface had deep wrinkles, decreased flatness, and a more pronounced pore structure, but the crystal clusters did not undergo significant changes. The reason is that the catalyst is subjected to hydroxyl oxidation and water flow erosion during usage, resulting in changes in the surface structure of the catalyst, but it does not affect the catalytic effect.
Analysis of Ozone Oxidation Catalyzed Treatment of PDW
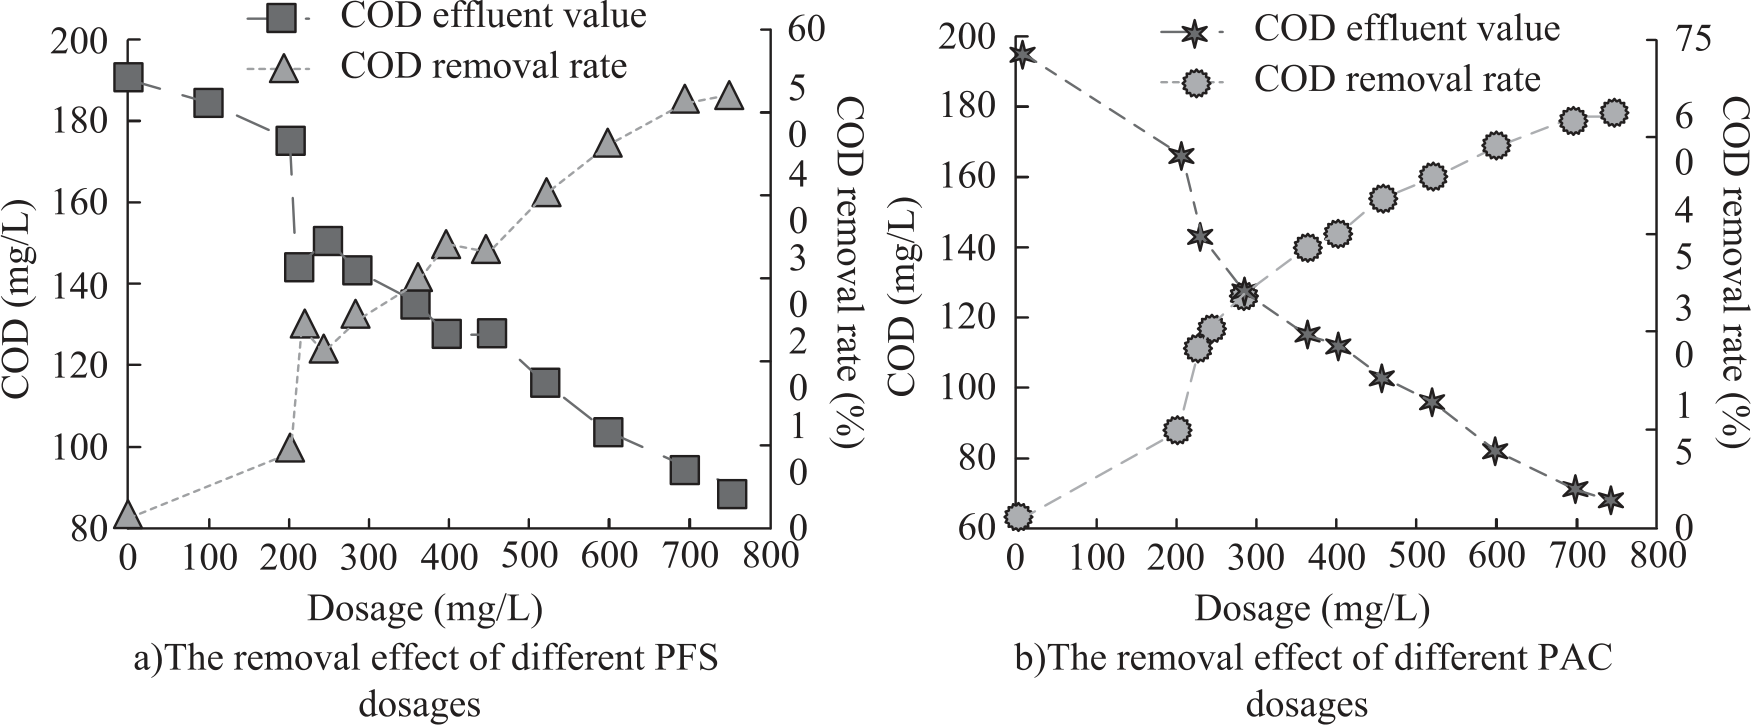
The study first focuses on coagulation precipitation pretreatment of water samples, exploring the effects of different coagulant dosages on effluent COD and removal rate. The COD of the experimental water sample was 191.47 mg/L. Fig. 7 displays the results. With the increase of flocculant dosage, the COD removal rate gradually improved. In Fig. 7a), when the dosage of PFS was 653 mg/L, the COD content was below 100 mg/L, and the removal rate was 48.91%. According to Fig. 7b), when the dosage of PAC was 486 mg/L, the COD content was below 100 mg/L, and the removal rate was 52.64%. At the same dosage of chemicals, the removal effect of PAC is better than that of PFS, but the difference is not significant. However, the price of PAC is three times that of PFS. Therefore, PFS is ultimately selected for preprocessing.
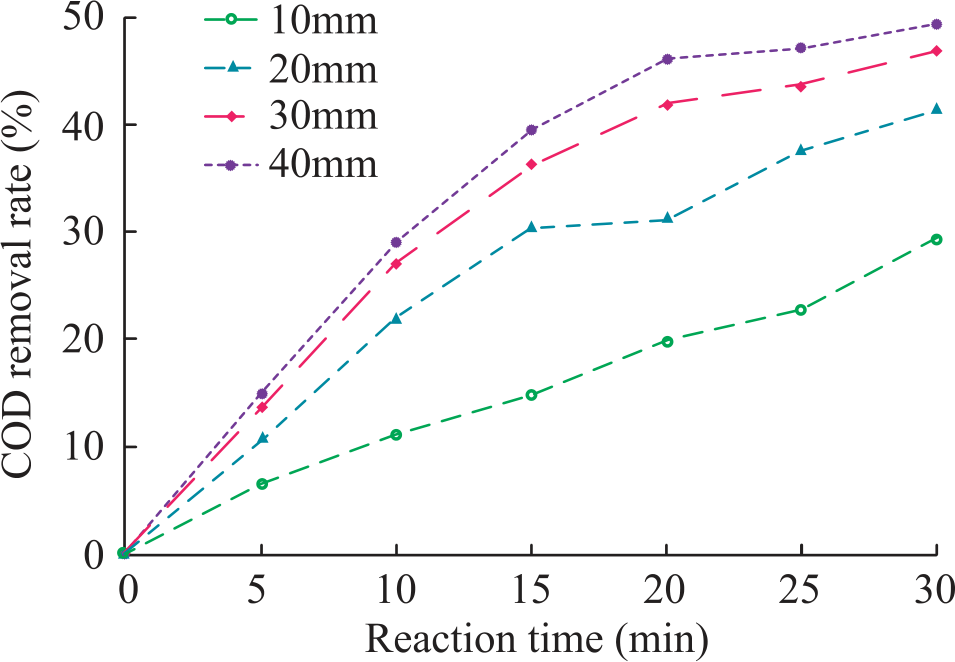
To verify the effect of MAc catalyst dosage on catalytic oxidation reaction, different amounts of catalyst are added to the reactor to investigate the COD removal rate. The MAc catalyst dosage heights of the reactor are 10 cm, 20 cm, 30 cm, and 40 cm. The COD removal efficiency under different MAc catalyst dosages is displayed in Fig. 8. With the increase of the MAc catalyst dosage, the COD removal rate of the system also increases. When the MAc catalyst height was raised from 10 cm to 40 cm, the COD removal rate was increased by 12.55%, 7.02%, and 2.31%. The main reason is that as the height of the catalyst increases, the number of catalytic sites in the system increases, thereby increasing the oxidation reaction of ·OH. In addition, the flow state of the system changes. The contact area of the gas, liquid, and solid phases increases, promoting the reaction. In addition, when the catalyst height was raised from 30 cm to 40 cm, the increase in COD removal rate was relatively small. To balance the oxidation efficiency and economic benefits of the system, a catalyst addition at a height of 30 cm is considered the best choice. The catalyst added at this height is approximately 336 g/L.
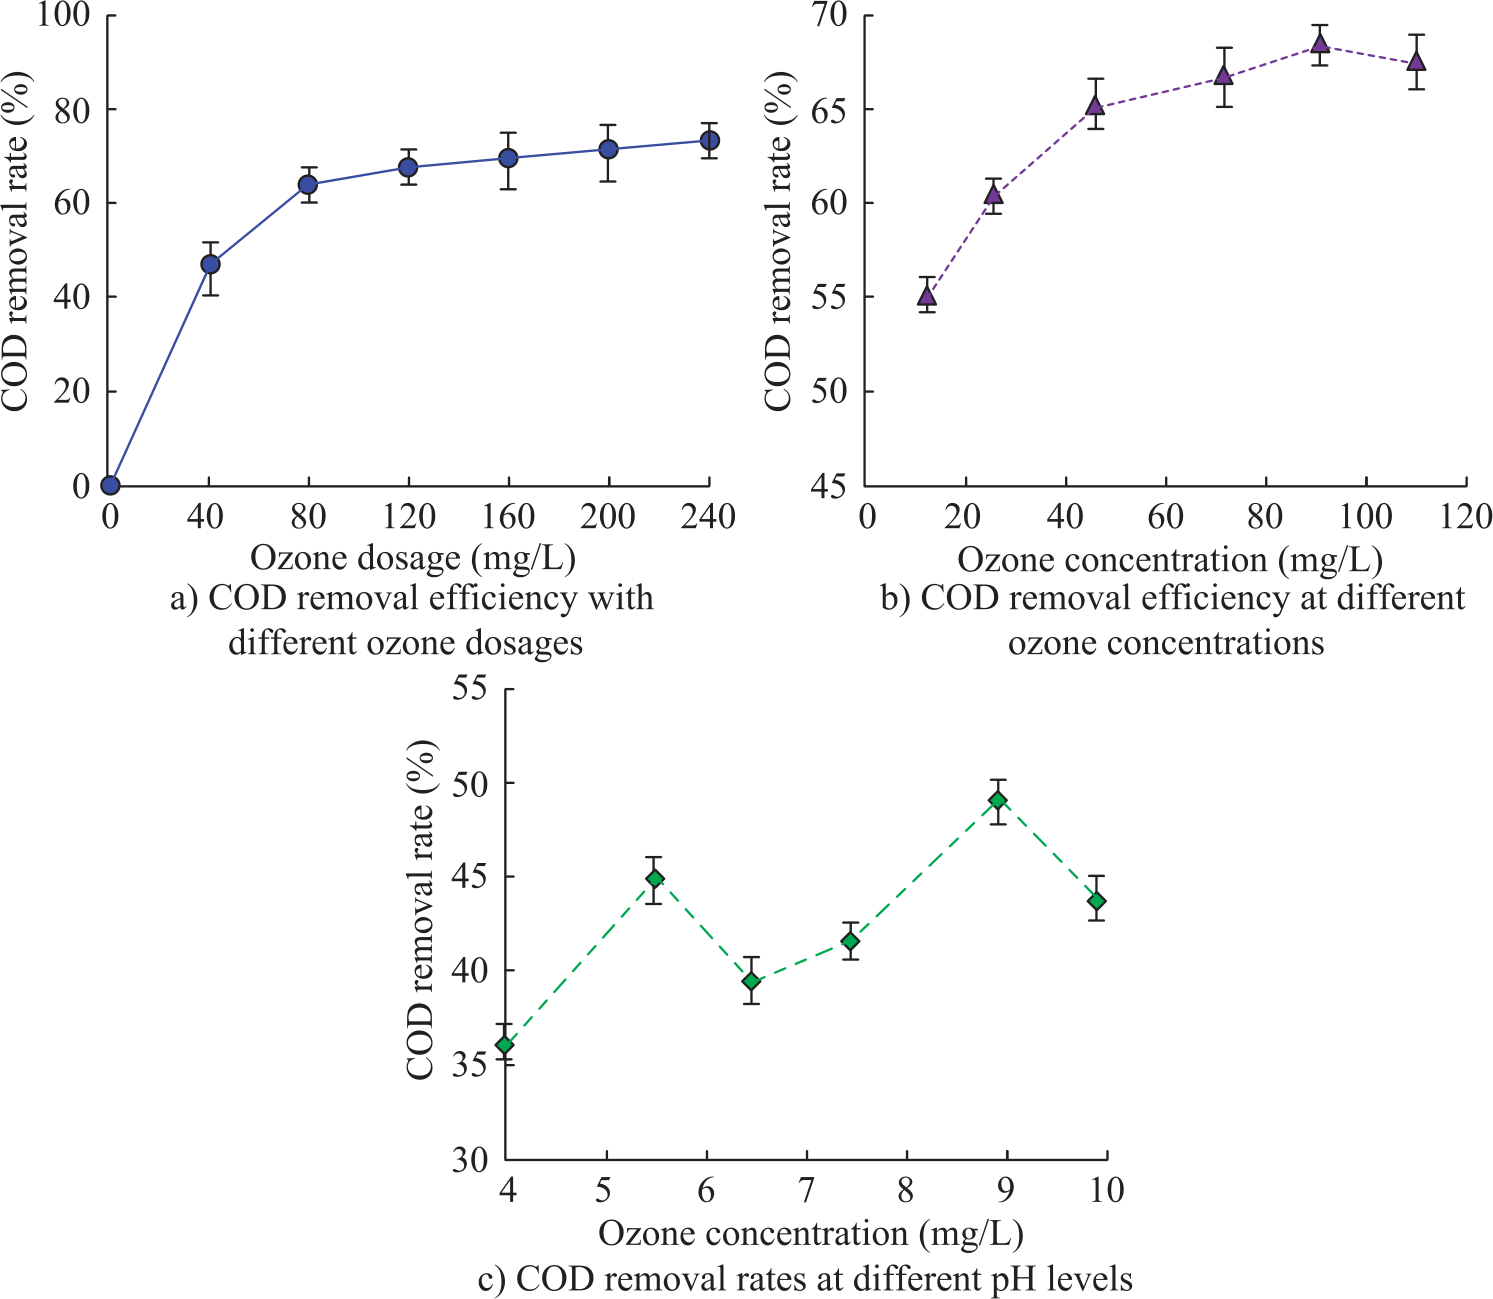
The research further explores the effects of ozone dosage, ozone concentration, and pH value on the catalytic system of ozone oxidation. To verify the effect of ozone dosage on COD removal rate, the influent COD concentration in the experiment is 105.04 mg/L, and the ozone intake is fixed. The ozone dosage is adjusted according to the ozone concentration. To verify the effect of ozone concentration on COD removal rate, the ozone dosage is 72 mg/L. To verify the effect of pH value on COD removal rate, the ozone dosage is 142.1 mg/L. A continuous influent test is used to verify the catalytic effect of the initial pH of the water sample. The COD removal rates under different conditions are shown in Fig. 9. In Fig. 9a), with the increase of ozone dosage, the COD removal rate displayed a rapid upward trend. When the ozone dosage increased to 70 mg/L, the rising speed began to significantly slow down. The reason is that the added ozone cannot completely dissolve into the water sample, and excessive ozone dosage can cause quenching of ·OH and O3, resulting in ozone waste. Therefore, to achieve the best removal effect and avoid waste, the optimal ozone dosage should be 70 mg/L. In Fig. 9b), the COD removal rate exhibited an upward trend with increasing ozone concentration, reaching a maximum value of 68.92%. The reason is that the increase in ozone concentration is conducive to its better dissolution in water, thereby increasing the amount of ozone dissolved in water. This not only increases the opportunity for pollutants to react with ozone, but also increases the probability of ozone coming into contact with catalysts to produce OH. However, as the ozone dosage continues to rise, the improvement rate in COD removal gradually slows down. This is mainly because the dissolution of ozone in water has reached saturation, which limits the removal efficiency. Therefore, to achieve the best removal effect, the optimal ozone concentration should be 70-90 mg/L. According to Fig. 9c), under acidic conditions, when the initial pH value of the water sample was 5.5, the COD removal effect was optimal, with a removal rate of 45.82%. Under alkaline conditions, when the initial pH was 9, the removal efficiency of COD exceeded that under acidic conditions, with a removal rate of 49.02%. Although acidic conditions are not conducive to the conversion of ozone into ·OH in water, a higher COD removal rate can still be achieved at a pH of 5.5. Considering that the original water sample is neutral, the pH drops in 5-6 after pretreatment, which is the range with higher catalytic efficiency. Due to the cost of adjusting the pH to 9, subsequent experiments will no longer adjust the initial pH value. Therefore, considering various factors comprehensively, the pH value should not be adjusted in the study.
Analysis of Ozone Oxidation Catalysis-BAF Combination Treatment
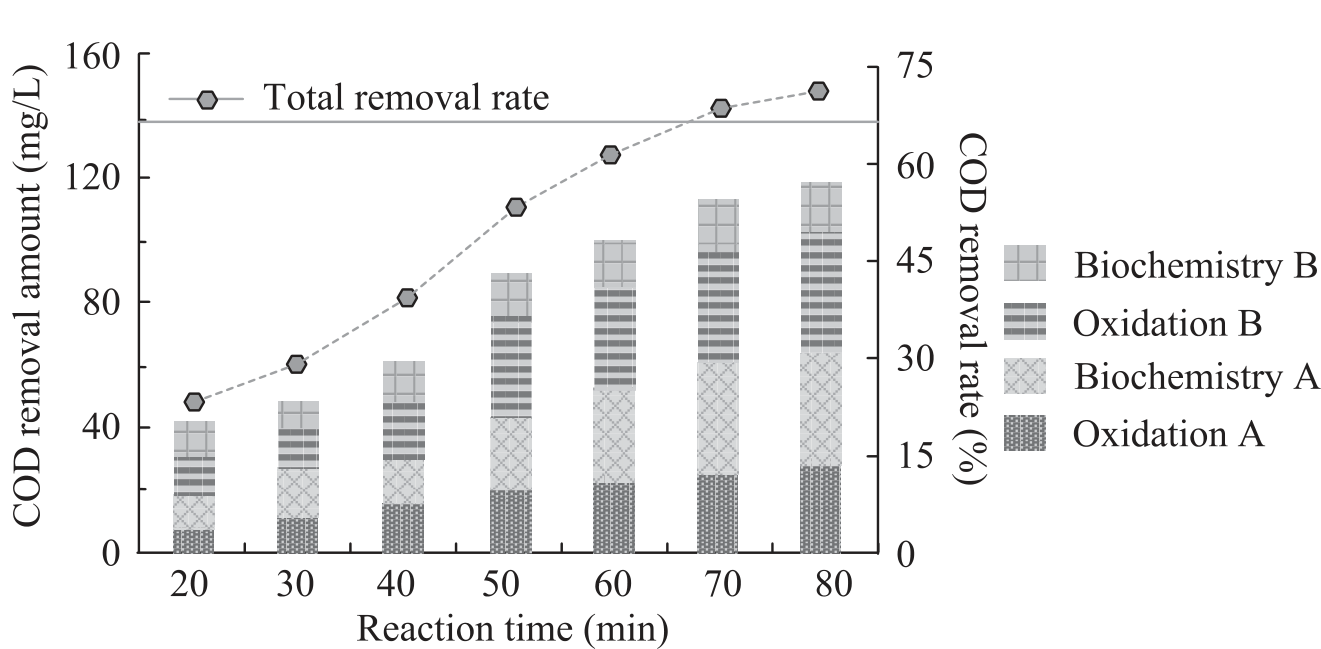
To verify the effectiveness of the ozone oxidation catalytic-BAF combined process technology in the biochemical treatment of PDW, a comparative analysis is conducted on the treatment effects of single-stage and two-stage ozone oxidation catalytic-BAF systems. The water sample of the single-stage system passes through oxidation column A-oxidation column B-biochemical column A-biochemical column B in sequence. The water sample of the two-stage system passes through oxidation column A-biochemical column A-oxidation column B-biochemical column B. The system treatment results under different ozone dosages are displayed in Fig. 10. The solid red line is the total removal rate of the single-stage system at an ozone dosage of 80 mg/L, at 67.12%, corresponding to an effluent COD of 48.92 mg/L. From Fig. 10, when the ozone dosage of the two-stage system reached 67.01 mg/L, the COD removal rate reached 67.12%, and the effluent COD decreased to 48.12 mg/L, meeting the target of less than 50 mg/L. When the ozone dosage increased to 80 mg/L, the COD removal rate of the two-stage system reached 73.61%. Compared with a single-stage system, a two-stage ozone oxidation catalytic BAF system can effectively improve COD removal efficiency and also help reduce ozone consumption. In addition, the two-stage system can achieve better removal effects at lower ozone dosages. Therefore, under the same effect, the two-stage system uses less ozone and reduces consumption.
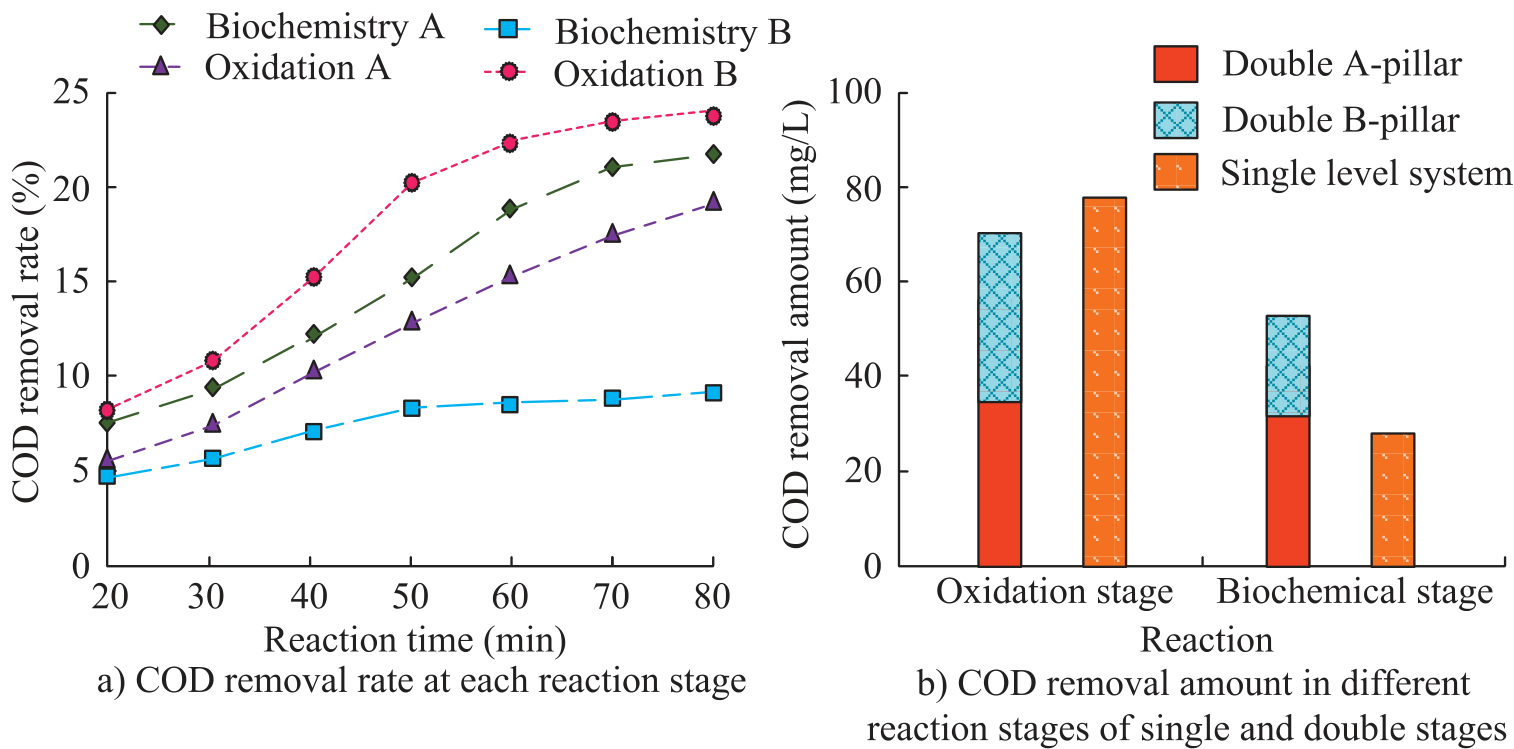
The research further explores the COD removal efficiency of single-stage and two-stage systems at different stages. The experimental results are displayed in Fig. 11. In Fig. 11a), in the two-stage system, the removal effect of oxidation column B was the most significant, with the greatest contribution to the total COD removal. When the ozone dosage was 80 mg/L, the maximum removal rate of this section reached 23.57%. Next was biochemical column A, with a maximum removal rate of 22.13%. The removal contribution of biochemical column B was the smallest, with a maximum removal amount of only 7.64%. In Fig. 11b), the oxidation section of the single-stage system had better COD removal effects than the two-stage system. However, in terms of treatment efficiency in the biochemical stage, the single-stage system is significantly lagging behind the two-stage system. The latter can better leverage the advantages of biochemical treatment processes, thereby improving the COD removal efficiency of the entire system.
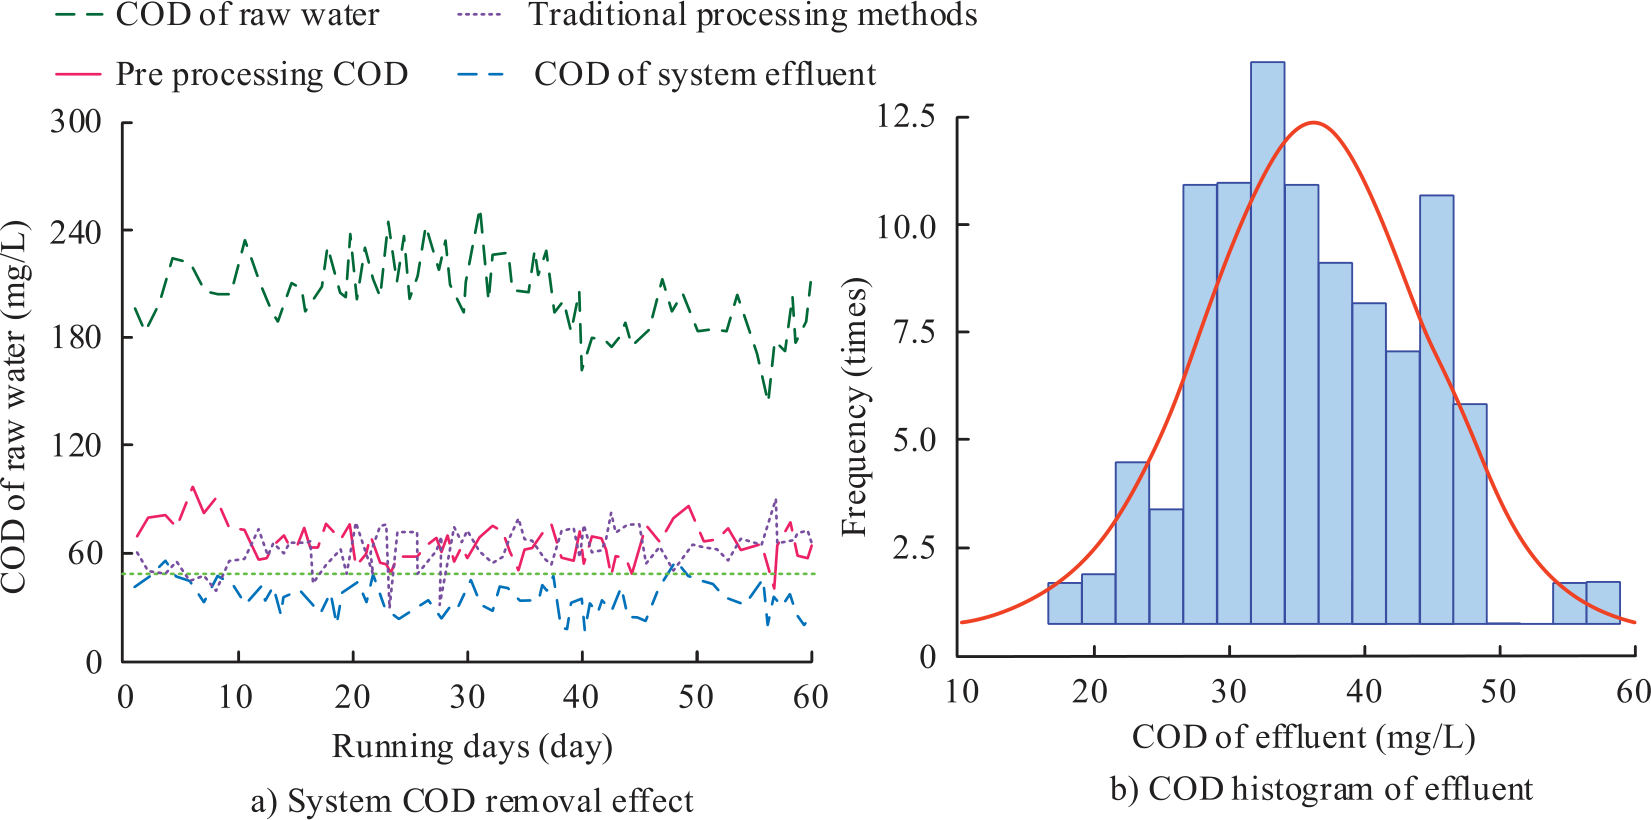
Further pilot tests are conducted at a comprehensive sewage treatment plant in a printing and dyeing park. After debugging and ensuring system stability, the system ran continuously for 60 days. The COD removal efficiency and the effluent COD histogram are displayed in Fig. 12. According to Fig. 12a), the average COD value of the raw water was 203.36 mg/L, and the average COD of the pre-treated effluent was 68.39 mg/L. After being treated by the system, the average COD of the effluent was maintained at 35.52 mg/L, with a corresponding removal rate of up to 82%. The average COD value of the effluent from the traditional factory method was as high as 65.28 mg/L, which was significantly higher than that of the pilot system used in the study. In Fig. 12b, the COD of the effluent was mainly concentrated in a narrow range, at 30-40 mg/L. This indicates that the effluent quality of the system fluctuates less, which signifies good stability. Meanwhile, the effluent quality of the system meets the limit standard of less than 60 mg/L. The pilot system based on the ozone oxidation catalytic-BAF combination process has efficient and stable performance, which has good treatment effects on the biochemical effluent from PDW. In addition, the economic feasibility of the system also needs to be considered. After testing, it was found that this technical solution has good effluent quality, significant economic benefits, and environmental friendliness. The treated water quality can meet the Class A standard in the “Emission Standards for Water Pollutants in Textile Dyeing and Finishing Industry”. However, during the ozone oxidation process, disinfection by-products such as bromate are produced. Therefore, when applying this technology to large-scale wastewater treatment, it is necessary to evaluate these potential environmental risks and take appropriate control measures to reduce secondary pollutants.
Conclusions
In the textile industry, the treatment and reuse of PDW has always been a challenge. Therefore, the combination process of ozone oxidation catalysis and BAD was tested. The results showed that both MAc and CAc catalysts showed excellent performance in organic matter adsorption, with COD removal rates of 58.26% and 56.15%, respectively, far exceeding other catalysts. Meanwhile, MAc exhibited the most outstanding performance in COD removal. After 25 minutes of reaction, the COD removal rate reached 35.68%. In the pilot experiment, the average COD value of the raw water was 203.36 mg/L. After pretreatment, the average COD of the effluent declined to 68.39 mg/L. After being treated by the system, the average COD of the effluent further declined to 35.52 mg/L, corresponding to a removal rate of 82%. From the histogram, the COD of the effluent was mainly concentrated in the narrow range of 30-40 mg/L. The effluent quality of the system fluctuated less, indicating good stability. Meanwhile, all effluent quality met the limit standard of less than 60 mg/L. In addition, in the two-stage system, the removal effect of oxidation column B was the most prominent, contributing the most to the total COD removal. When the ozone dosage was 80 mg/L, the highest removal rate in this section reached 23.57%. The removal effect of biochemical column A was also quite significant, with a maximum removal rate of 22.13%. The removal contribution of biochemical column B was relatively small, with a maximum removal amount of only 7.64%. In addition, the oxidation section of a single-stage system had better COD removal efficiency than the two-stage system. However, for the treatment efficiency in the biochemical stage, the single-stage system is significantly inferior to the two-stage system. The combination process of ozone oxidation catalysis and BAF has significant treatment effects on PDW. It can be used for actual biochemical effluent and reuse. However, there is still some room for optimization in the catalytic activity of MAc, which can be further improved in the future.

