

Introduction
The edible fungi industry has witnessed rapid global expansion in recent years, owing to the rich nutritional value and distinctive flavor of mushrooms [1]. Statistics indicate that the global mushroom industry will reach approximately 20.46 million tons by 2026 [2]. However, the production of 1 kg of mushrooms generates 5 kg of spent mushroom substrate (SMS), with global SMS waste anticipated to surpass 100 million tons by 2026 [3]. If not properly managed, SMS can cause environmental pollution of water bodies, the atmosphere, and the soil [2, 4]. Despite these risks, SMS is a valuable resource for bio-organic fertilizer production due to its rich nutrients, low bulk density, abundance, and low cost [5, 6]. To systematically evaluate the practical application effects of SMS-based bio-organic fertilizers in agriculture, this study selected the economically valuable passion fruit (Taiwan No. 1) as the experimental subject and conducted field trials to comprehensively assess fruit quality, rhizosphere soil physicochemical properties, and microbial community diversity [7, 8].
Modern agriculture heavily relies on chemical fertilizers, especially compound fertilizers containing nitrogen, phosphorus, and potassium, to ensure fruit quality and yield [9]. However, long-term use of these fertilizers can deplete soil micronutrients and destroy native microbial communities, which are crucial for crop health [10, 11]. Bio-organic fertilizers have gained attention in sustainable agriculture for their capacity to improve soil quality and promote crop growth while reducing environmental pollution [12, 13]. They enhance soil physical, chemical, and biological properties [14, 15].
Research has demonstrated that the organic matter and nutrients in bio-organic fertilizers can undergo slow release, providing sustained nutrient supply for crops, reducing the usage of chemical fertilizers, and mitigating agricultural non-point source pollution [16, 17]. In recent years, significant progress has been made in bio-organic fertilizer research. For instance, studies have shown that microbial communities in bio-organic fertilizers can decompose organic matter to release nutrients required by plants. They can also secrete plant growth-promoting substances like hormones and enzymes, thereby directly or indirectly promoting crop growth [18-20]. In addition, the microbes in bio-organic fertilizers can form symbiotic relationships with plant roots to enhance nutrient absorption efficiency [21, 22]. However, despite extensive research on the mechanisms of bio-organic fertilizers, studies on the use of SMS as a bio-organic fertilizer are relatively limited. SMS, a common agricultural waste, is rich in organic matter and nutrients and has potential resource utilization value. Moreover, existing bio-organic fertilizer research mainly focuses on linear effects under single concentration gradients, lacking systematic studies on the commonly used basal and top-dressing fertilization methods by farmers. Furthermore, the application effects of SMS-based bio-organic fertilizers under different soil types and cropping systems, as well as their long-term impacts on soil microbial communities and nutrient cycling, remain unclear.
Based on the above research background, this study takes SMS-based bio-organic fertilizer as the research object and employs a basal and top-dressing fertilization method. The study explores the effects on passion fruit survival rate, yield, and fruit quality by adjusting the ratios and application times of basal and top-dressing fertilizers. Soil physicochemical properties are measured, including total and available nutrients, pH, and organic matter content in the rhizosphere soil. High-throughput sequencing technology is used to investigate the diversity, structure, and functional genes of rhizosphere soil microbial communities. The study aims to determine the optimal ratio of SMS - based bio-organic fertilizer to compound fertilizer, providing new ideas for sustainable agriculture and enhancing the economic and ecological benefits of passion fruit cultivation.
Materials and Methods
Site Description
The field experiment was conducted in Xingyi City, Guizhou Province, China (geographic coordinates: 25°11′45″N, 104°56′1″E; altitude: 1247 m). The region has an average annual temperature ranging from 14 to 19ºC, with an annual rainfall between 1300 and 1600 mm, and a frost-free period of approximately 300 days. The predominant soil type in this area is yellow soil.
Experimental Design
The experimental field was divided into different zones, each corresponding to a specific fertilization treatment. The treatments included: CK (control group with no basal or top-dressing fertilizer), CF (top-dressing with compound fertilizer only at 8 g/plant), MBF (basal application of bio-organic fertilizer at 2 kg/plant without top-dressing), HBF (basal application of bio-organic fertilizer at 4 kg/plant without top-dressing), MBF-CF (basal application of bio-organic fertilizer at 2 kg/plant with top-dressing of compound fertilizer at 8 g/plant), and HBF-CF (basal application of bio-organic fertilizer at 4 kg/plant with top-dressing of compound fertilizer at 8 g/plant). Each treatment was replicated with 7 passion fruit plants, with a plant spacing of 30 cm and a plot spacing of 2.5 m. The application rate of compound fertilizer was determined based on local growers’ experience. The bio-organic fertilizer used as a basal fertilizer in this study was supplied by Guizhou Shinon Fertilizer Co., Ltd. With organic matter ≥50% and N+P+K≥4%, it is a water-insoluble solid powder. This fertilizer was applied only once at the basal fertilizer stage. During application, it was uniformly mixed with the soil, covered with a film, and one week later, passion fruit seedlings were transplanted. The compound fertilizer used for top-dressing was a balanced special fertilizer from Rayno (Beijing) Biotechnology Co., Ltd. (N-P-K+TE: 20-20-20+TE), diluted at a ratio of 1:1000 (weight ratio) and applied every half month to ensure that the fertilizer water was directly irrigated into the roots of the passion fruit.
Sample Collection and Preservation
Passion fruit seedlings were planted in April and harvested in November when the fruit ripened. Fruits turning purple were selected for sampling. This is because the maturity of Tainong No.1 passion fruit is indicated by the purple color, and the fruit indicators at this stage are closer to those of the fruits purchased by consumers. Fruit samples for quality analysis were only collected during the first sampling, while those for yield analysis were collected multiple times throughout the cycle. Blank soil samples (20 cm deep) were collected before the application of basal fertilizer, and soil samples were collected once a month after top-dressing until the last fruit ripening [23]. Soil samples were taken with a soil sampler just above the passion fruit root system, selecting the soil at the bottom of the mud column closest to the root. Five random sampling points were selected, and the soil from these points was mixed evenly to form one sample, with three parallel samples collected for each treatment group. Microbial samples were collected half a month after the passion fruit was planted, as the microbes had already adapted to the environment of each treatment group by this time. The same five-point sampling method was used, with three parallel samples collected for each treatment group, and then the microbial samples were stored in an ultra-low temperature freezer at -80ºC until analysis.
Soil Physicochemical Properties and Fruit Quality Determination
After collecting the fruit samples, the pulp was extracted and juiced. The soluble solids, acidity, and sugar-acid ratio of the fruit were measured using the ATAGO PAL-BXIACID1 sugar-acid analyzer.
The collected soil was air-dried, ground, and sieved for subsequent testing. The pH of the soil was measured using the potentiometric method with a water-to-soil ratio of 2.5:1 (PHS-3C, Shanghai Leici Instrument Co., Ltd.); soil organic matter was measured using the dichromate method; total nitrogen in the soil was measured using a fully automatic nitrogen determinator (K9860, Shandong Haian Scientific Instrument Co., Ltd.); available nitrogen was measured using the alkali diffusion method; total potassium and available potassium in the soil were measured using the flame photometry method (AA-3300F, Shanghai Yuanxi Instrument Co., Ltd.); total phosphorus and available phosphorus in the soil were measured using the molybdenum-antimony anti-colorimetric method (UV-5100, Shanghai Yuanxi Instrument Co., Ltd.).
Soil DNA Extraction and PCR Amplification
This study conducted amplicon sequencing analysis of the 16S rDNA and ITS regions for soil bacterial and fungal communities. DNA extraction was performed by Tiangen Biochemical Technology (Beijing) Co., Ltd. After the DNA of soil samples was extracted and purified, the purity and concentration of DNA were detected by agarose gel electrophoresis and Nanodrop, and the quality of DNA fragments was verified. For bacterial samples, the V3-V4 region of the 16S rRNA gene was amplified using primers 341F and 806R. For fungal samples, PCR amplification was performed using primers ITS3-2024F (GCATCGATGAAGAACGCAGC) and ITS4-2409R (TCCTCCGCTTATTGATATGC).
Statistics and Analysis
Data statistics and processing for soil physicochemical properties and fruit quality were performed using Excel 2020 software, and graph plotting was done using Origin 2022 and R language, as well as Canoco5 software. Correlation analysis, one-way ANOVA (p<0.05), and Kruskal-Wallis tests were conducted using SPSS 26 software.
In the microbial analysis part of this study, the quality of data was assessed by statistically processing bacterial and fungal data from each stage sample sequence number. The main parameters included the number of sequences, Raw Data volume, Clean Data volume, effective data volume, GC content, Q20 and Q30 quality values (Table 1 and 2). The DADA2 method was used to analyze the data, including steps such as primer removal, filtering, denoising, merging, and chimera removal. Bacterial and fungal samples obtained 81,196 and 91,788 effective sequences, respectively, with efficiencies of 77.70% and 86.41% (Table 3 and 4). Subsequently, dereplication was performed on the effective data to obtain amplicon sequence variants (ASVs), and singleton ASVs were removed. The QIIME2 software was used for standardization and diversity analysis. The diversity core-metrics-phylogenetic command was used to standardize the data and calculate alpha and beta diversity (PCoA and NMDS) based on the phylogenetic tree to explore differences in community structure among samples. Finally, statistical methods such as STAMP, MetaStat, and LEfSe were used to test for significant differences in species composition and community structure among grouped samples. The PICRUST software was used to predict functions based on the annotation results and to associate them with functional databases such as KEGG and COG. The overall process aimed to reveal differences and diversity among samples through multi-step analysis, ensuring the accuracy and reliability of data analysis.
Table 1.
Bacterial sample sequencing data processing results statistics.
[i] Sample ID as Sample Name; Raw Reads for the number of raw paired-end reads obtained from sequencing; Bases for the total amount of sequencing data; Clean Reads for the number of high-quality reads obtained after raw sequence quality control; Effective Reads for the number of valid sequences obtained after splicing and filtering chimeras from Clean Reads; GC(%) for the sample’s GC content, which is the percentage of guanine (G) and cytosine (C) bases in the total bases; Q20(%) for the percentage of bases with a quality value greater than or equal to 20 out of the total number of bases, with qualified samples generally having a Q20 above 90%; Q30(%) for the percentage of bases with a quality value greater than or equal to 30 out of the total number of bases, with qualified samples generally having a Q30 above 85%; Avg.Quality for the average data quality; Effective(%) for the percentage of Effective Reads out of Raw Reads.
Results and Discussion
Effects of Bio-organic Fertilizer and Compound Fertilizer on Passion Fruit Yield and Quality
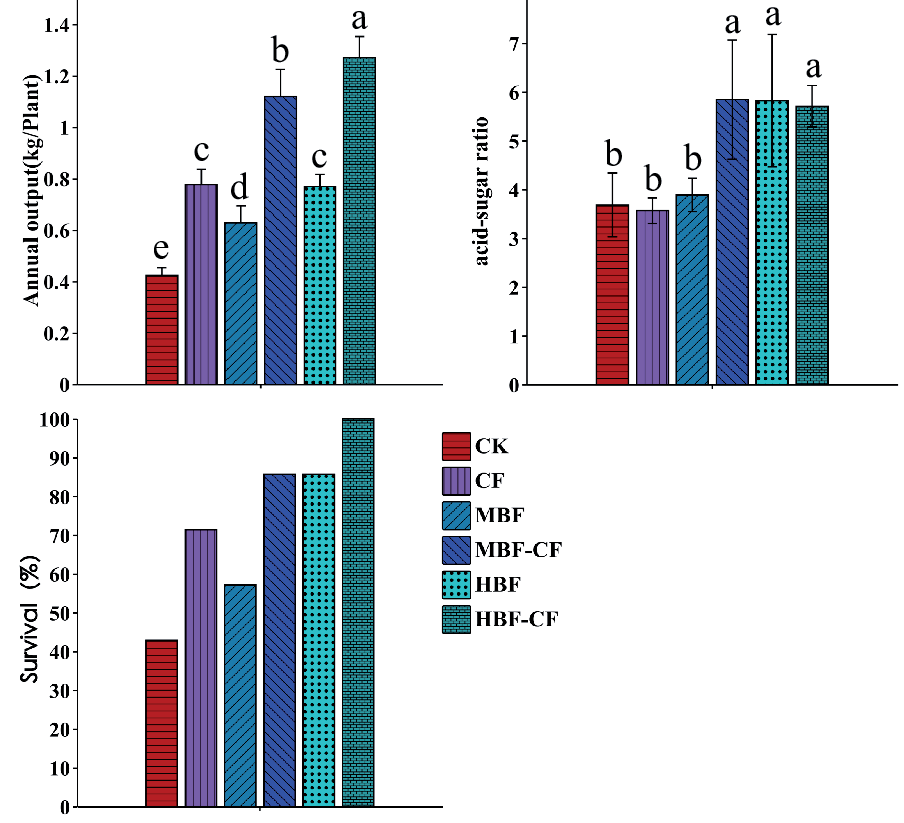
The results of this experiment indicated that different fertilization treatments had a significant impact on the yield of passion fruit (Fig. 1). The control group (CK) had the lowest yield at 0.42 kg/plant, while the highest yield was achieved in the HBF-CF treatment group, reaching 1.27 kg/plant. The yields of the MBF-CF, CF, MBF, and HBF treatment groups decreased successively, with values of 1.15 kg/plant, 1.08 kg/ plant, 0.95 kg/plant, and 0.89 kg/plant, respectively. Compared with the CK treatment, the yields of the MBF and HBF treatments were significantly increased (p<0.05), and the yield of the HBF treatment was significantly higher than that of the MBF treatment (p<0.05). Additionally, the yields of the CF, MBF-CF, and HBF-CF treatments showed a significant positive correlation (p<0.05), indicating that within the yield range of 0-4 kg, the yield of passion fruit increased with the increase in the concentration of organic fertilizer in the basal fertilizer. Further analysis revealed that the yield of the CF treatment was significantly higher than that of the CK treatment (p<0.05), the yield of the MBF-CF treatment was significantly higher than that of the MBF treatment (p<0.05), and the yield of the HBF-CF treatment was significantly higher than that of the HBF treatment (p<0.05). This suggests that top-dressing could significantly increase the yield of passion fruit when the same concentration of bio-organic fertilizer was applied in the basal fertilizer. However, the lack of significant yield difference between the CF and HBF treatments (p>0.05) indicates that applying 4 kg/plant of bio-organic fertilizer as a basal fertilizer can equivalently replace the 8 g/plant of compound fertilizer applied as a top-dressing in this passion fruit experiment.
The significant increase in passion fruit yield may be related to the rich organic matter and microbial activity in bio-organic fertilizers [24, 25]. Organic fertilizers can improve soil structure, enhance soil water and nutrient retention capabilities, thereby promoting plant growth and fruit development [26, 27]. However, the lack of significant yield differences between the CF and HBF treatments suggests that medium – concentration bio – organic fertilizers have the potential to replace compound fertilizers. This potential may be attributed to the slow-release characteristics of nutrients in organic fertilizers, which enable continuous nutrient supply to plants and reduce nutrient loss [28].
Table 2.
Statistics of sequencing data processing results for fungal samples.
[i] Sample ID as Sample Name; Raw Reads for the number of raw paired-end reads obtained from sequencing; Bases for the total amount of sequencing data; Clean Reads for the number of high-quality reads obtained after raw sequence quality control; Effective Reads for the number of valid sequences obtained after splicing and filtering chimeras from Clean Reads; GC(%) for the sample’s GC content, which is the percentage of guanine (G) and cytosine (C) bases in the total bases; Q20(%) for the percentage of bases with a quality value greater than or equal to 20 out of the total number of bases, with qualified samples generally having a Q20 above 90%; Q30(%) for the percentage of bases with a quality value greater than or equal to 30 out of the total number of bases, with qualified samples generally having a Q30 above 85%; Avg.Quality for the average data quality; Effective(%) for the percentage of Effective Reads out of Raw Reads.
The sugar-acid ratio is an important indicator for measuring the quality of passion fruit, and a higher value indicates better fruit taste. The experimental results showed that compared with the CK and HBF treatments, the sugar-acid ratio of passion fruit in the HBF treatment was significantly increased (p<0.05), indicating that the application of high-concentration bio-organic fertilizer in the basal fertilizer without top-dressing could significantly improve the fruit quality of passion fruit. In addition, compared with the CF treatment, the sugar-acid ratio of passion fruit in the MBF-CF and HBF-CF treatments was significantly increased (p<0.05), indicating that the application of bio-organic fertilizer in the basal fertilizer could also significantly improve fruit quality under top-dressing conditions. It is worth noting that the sugar-acid ratio of passion fruit in the MBF-CF treatment was significantly higher than that in the MBF treatment (p<0.05), while there was no significant difference in sugar-acid ratio between the MBF-CF, HBF, and HBF-CF treatments (p>0.05). This suggests that when bio-organic fertilizer with medium concentration is applied as a basal fertilizer, top-dressing can better enhance the flavor of passion fruit. In contrast, when high-concentration bio-organic fertilizer is used as a basal fertilizer, the impact of top-dressing on fruit flavor is relatively small.
The increase in sugar-acid ratio may be related to the rich trace elements and organic acids in bio-organic fertilizers, which can regulate the metabolic processes of fruits, promote sugar accumulation, and reduce the content of organic acids [29, 30]. In addition, the microbial activity in bio-organic fertilizers may indirectly affect fruit quality by secreting plant growth regulators [31, 32]. The sugar-acid ratio of the MBF-CF treatment was significantly higher than that of the MBF treatment, indicating that top-dressing can further optimize fruit flavor when using medium-concentration bio-organic fertilizer. This optimization may be attributed to the additional nutrients provided by top-dressing, such as potassium, which plays a key role in fruit sugar synthesis [33]. However, the insignificant effect of top-dressing on the sugar-acid ratio under high-concentration bio-organic fertilizer conditions may be because high-concentration organic fertilizer has already fully met the needs of fruit development, which reduces the marginal effect of top-dressing.
Table 3.
Statistical analysis of sample data following bacterial denoising (Clustering).
[i] Sample ID: Sample Name; Raw Reads: Raw Data Volume; Filtered Reads: Data Volume After Removing Low-Quality Sequences; Denoised Reads: Sequence Data Volume After Denoising, i.e., Effective Sequence Volume; Merged Reads: Sequence Volume After Merging; Non-chimeric Reads: Sequence Volume After Removing Chimeras, i.e., High-Quality Sequence Volume; Non-singleton Reads: Sequence Volume After Removing Singletons; ASV/OTU Num: Number of ASV/OTU Sequences per Sample; Even Reads Num: Sample Sequence Data Volume After Even Sequencing per Sample; Even ASV/OTUs Num: Number of ASV/OTU Sequences After Even Sequencing per Sample.
Survival rate is an important indicator in agricultural production, especially when facing extreme weather conditions (such as waterlogging and drought), as the survival rate directly affects the economic benefits of crops. The experimental results showed that the survival rate of passion fruit in the CK treatment group was the lowest, at only 42.86%, while the survival rate in the HBF-CF treatment group was the highest, reaching 100%. The survival rates of the HBF and MBF-CF treatment groups were both 85.71%. These results indicate that regardless of whether top-dressing was applied, the survival rate of passion fruit significantly increased with the increase in the concentration of bio-organic fertilizer in the basal fertilizer (p<0.05).
The increase in survival rate may be related to the improvement of the soil environment by bio-organic fertilizers. Bio-organic fertilizers can enhance soil water retention and aeration, thereby mitigating the negative impact of extreme weather on plants [34, 35]. In addition, the beneficial microorganisms in organic fertilizers can inhibit the occurrence of soil-borne diseases and improve plant stress resistance [36]. The 100% survival rate of the HBF-CF treatment group indicates that combining high-concentration bio-organic fertilizer with top-dressing can maximize the stress resistance and adaptability of passion fruit. This finding holds substantial practical significance, particularly in regions with variable climates.
Table 4.
Statistical analysis of sample data following fungal denoising (Clustering).
[i] Sample ID: Sample Name; Raw Reads: Raw Data Volume; Filtered Reads: Data Volume After Removing Low-Quality Sequences; Denoised Reads: Sequence Data Volume After Denoising, i.e., Effective Sequence Volume; Merged Reads: Sequence Volume After Merging; Non-chimeric Reads: Sequence Volume After Removing Chimeras, i.e., High-Quality Sequence Volume; Non-singleton Reads: Sequence Volume After Removing Singletons; ASV/OTU Num: Number of ASV/OTU Sequences per Sample; Even Reads Num: Sample Sequence Data Volume After Even Sequencing per Sample; Even ASV/OTUs Num: Number of ASV/OTU Sequences After Even Sequencing per Sample.
Effects of Bio-organic and Compound Fertilizer on Soil Physicochemical Properties
This study revealed that, compared with the control (CK) treatment, soil available phosphorus (AP) content in the high bio-organic fertilizer (HBF) and high bio-organic fertilizer + compound fertilizer (HBF-CF) treatment groups was significantly elevated (p<0.05). However, no significant difference in AP content was observed between the HBF and HBF-CF groups (Table 5). This result indicates that the application of bio-organic fertilizer significantly promotes the availability of phosphorus in the soil, and the addition of compound fertilizer does not further significantly increase the AP content. This may be because the organic acids and microbial activity in bio-organic fertilizers promote the dissolution and transformation of insoluble phosphorus in the soil, thereby increasing the availability of phosphorus [37, 38]. In addition, the total phosphorus (TP) content in the HBF and HBF-CF treatment groups was significantly higher than that in the CK and single compound fertilizer (CF) treatment groups (p<0.05), and the TP content in the HBF-CF treatment group was significantly higher than that in the HBF treatment group (Table 5). This suggests that the addition of compound fertilizer directly supplements the inorganic phosphorus in the soil, while bio-organic fertilizer further increases the total phosphorus content in the soil by promoting phosphorus mineralization and release [39, 40]. This result is similar to the study of Cui et al. (2024), indicating that the combined application of bio-organic fertilizer and compound fertilizer has a synergistic effect on increasing soil phosphorus content [37].
In terms of soil alkali-hydrolyzed nitrogen (AN), there was a significant positive correlation between the CK, medium bio-organic fertilizer (MBF), and HBF treatment groups and the CF, MBF-CF, and HBF-CF treatment groups (p<0.05). Compared with the CK, MBF, and HBF treatments, the AN content in the CF, MBF-CF, and HBF-CF treatment groups was significantly increased and increased with the increase in bio-organic fertilizer application (Table 5). This trend was also observed in the total nitrogen (TN) content of the soil. TN content was significantly and positively correlated among the CK, MBF, and HBF groups. The CF, MBF-CF, and HBF-CF groups also exhibited a similar trend, with TN content increasing as the concentration of bio-organic fertilizer increased (Table 5). These results indicate that the application of bio-organic fertilizer significantly enhances the availability of nitrogen in the soil, and the addition of compound fertilizer further strengthens this effect [41]. The organic nitrogen in bio-organic fertilizer is gradually mineralized into inorganic nitrogen under the action of microorganisms, thereby increasing the availability of nitrogen in the soil [42]. In addition, the inorganic nitrogen in compound fertilizer directly supplements the nitrogen content in the soil, further enhancing the effect of bio-organic fertilizer [43].
Fig. 1.
Passion fruit yield, sugar-acid ratio, and survival rate under different fertilization treatments. Means with different letters are significantly different according to one-way ANOVA followed by the Waller-Duncan test (p<0.05).
The changes in soil available potassium (AK) showed a similar trend to TN. A significant positive correlation in AK content was found among the CK, MBF, and HBF treatment groups. Similarly, a significant positive correlation was observed in the CF, MBF-CF, and HBF-CF groups, with AK content increasing as the concentration of bio-organic fertilizer increased (Table 5). For the total potassium (TK) content in the soil, the CF, MBF-CF, and HBF-CF treatment groups showed a significant positive correlation, with TK content increasing with the increase in bio-organic fertilizer concentration. However, there was no significant difference in TK content between the MBF, MBF-CF, and HBF treatment groups, but the TK content in the HBF-CF treatment group was significantly higher than that in the HBF treatment group (Table 5). This suggests that potassium from compound fertilizers directly increases soil potassium levels, while bio-organic fertilizers enhance potassium release and availability by improving soil structure and microbial activity. The combined application of bio-organic and compound fertilizers thus has a significant effect on increasing soil potassium content. [44, 45].
The soil pH value in the CK treatment group was 8.20, while the other treatment groups all significantly reduced the soil pH value. There was a significant negative correlation between the CK, MBF, and HBF treatment groups and the CF, MBF-CF, and HBF-CF treatment groups (p<0.05), but there was no significant difference in pH value between the MBF and MBF-CF, HBF and HBF-CF treatment groups (Table 5). With the increase in bio-organic fertilizer concentration, the soil pH value gradually decreased. This result is consistent with the study of Li et al. (2023), indicating that long-term application of bio-organic fertilizer may affect the soil acid-base balance by increasing soil organic matter content and the production of organic acids, thereby reducing the soil pH value [46]. Soil organic matter content is an important indicator of soil health. This study found that compared with the CK treatment, the soil organic matter content in the HBF and HBF-CF treatment groups was significantly increased (p<0.05), and there was no significant difference between the HBF and HBF-CF treatment groups (Table 5).
Table 5.
The impact of different SMS-based bio-organic fertilizer and compound fertilizer combinations on soil physicochemical properties.
[i] The data in the table are expressed as mean values ± standard deviation. Different lowercase letters indicate significant differences between groups (p<0.05). The effects of available phosphorus (AP) and total organic matter (TOM) were tested using the Kruskal- Wallis test, and the effects of total phosphorus (TP), available nitrogen (AN), total nitrogen (TN), available potassium (AK), total potassium (TK), and pH were analyzed using one-way ANOVA followed by the Waller-Duncan test.
This result further confirms the positive role of bio-organic fertilizer in improving soil organic matter content. The increase in organic matter not only improves the physical structure of the soil but also enhances the soil’s water and nutrient retention capabilities, providing a better soil environment for crop growth [47].
Effects of Fertilization on Soil Bacterial and Fungal Diversity and Community
The results of boxplot analysis based on the ACE and Chao1 indices of bacteria and fungi showed that the soil bacterial α-diversity did not change significantly among different treatment groups (Fig. S1-2), while the fertilization treatments had a significant impact on the α-diversity of soil fungi (Fig. S3-4, p<0.05). This finding is similar to previous studies by Fu et al. (2024), where the abundance of symbiotic fungi in the soil decreased with the application of organic-inorganic nitrogen fertilizer mixtures, and similar results were also obtained by Weixi Li et al. (2021) [48-50].
This may be because fungi generally rely on the decomposition of organic matter to obtain energy and nutrients, and are more sensitive to changes in soil organic matter and nutrients. Therefore, changes in organic matter and nutrients caused by fertilization may directly affect the diversity of fungal communities [51]. In contrast, the relative stability of bacterial community α-diversity may be related to the stronger adaptability of bacteria to environmental changes [52, 53].
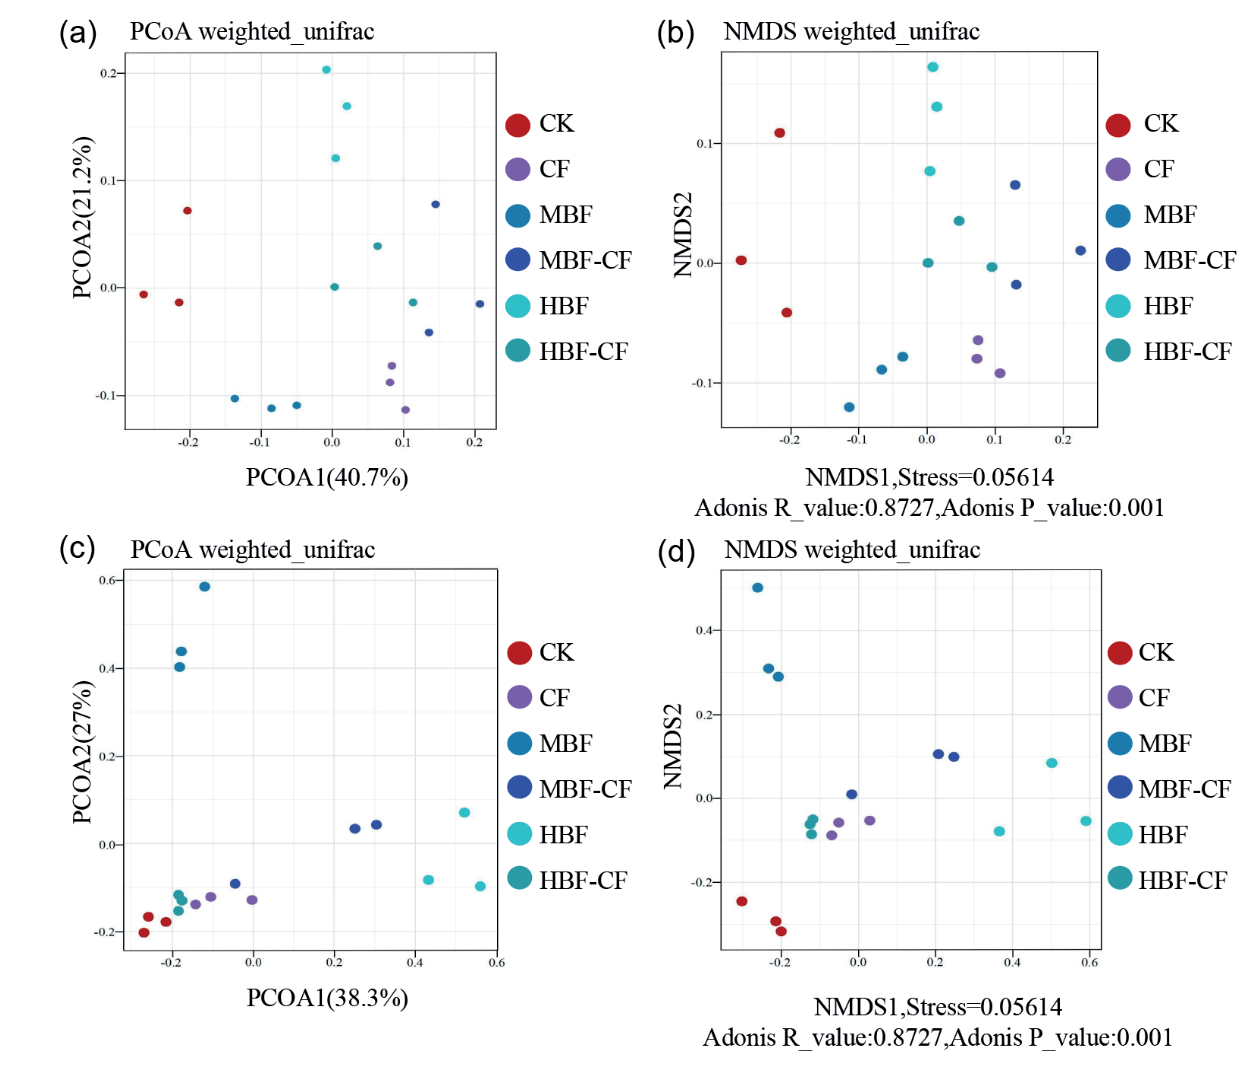
Principal coordinate analysis (PCoA) and non-metric multidimensional scaling (NMDS) were used to assess the β-diversity differences of soil bacteria and fungi. As shown in Fig. 2a) and b), the PC1 and PC2 axes explained 40.7% and 21.2% of the variation in soil bacterial β-diversity among treatments, respectively. NMDS of bacteria showed that the CK treatment was distinctly separated from the other groups, indicating that fertilization significantly affected bacterial community structure (Adonis test, P = 0.001). Similarly, Fig. 2c) and d) showed that the PC1 and PC2 axes explained 38.3% and 27.0% of the variation in soil fungal β-diversity among treatments, respectively. In the fungal NMDS, the CK treatment was significantly separated from other groups, further proving that fertilization significantly affected fungal community structure (Adonis test, P = 0.001). These results indicate that fertilization treatments significantly altered the structure of soil microbial communities, and the application of bio-organic fertilizer reduced the abundance of fungi in the soil, especially the decrease in symbiotic fungi, which is similar to the findings of Ning et al. [18, 54].
A total of 48 phyla and 864 genera of bacteria were detected in the rhizosphere soil of passion fruit under different treatments, among which 11 phyla and 16 genera had an average relative abundance of more than 1%. At the phylum level, the top 10 phyla by average relative abundance were Proteobacteria (33.33%), Actinobacteriota (25.36%), Acidobacteriota (9.34%), Bacteroidota (6.87%), Gemmatimonadota (6.07%), Chloroflexi (5.52%), Myxococcota (2.85%), Patescibacteria (2.02%), Methylomirabilota (1.34%), and Firmicutes (1.21%) (Fig. 3a)). At the genus level, the top 10 genera by average relative abundance were Streptomyces (2.90%), Vicinamibacteraceae (2.68%), Achromobacter (2.37%), Micromonospora (2.13%), Sphingomonas (1.89%), Cellvibrio (1.63%), RB41 (1.52%), Massilia (1.42%), Nocardioides (1.37%), and 67-14 (1.36%) (Fig. 3b)). These dominant genera mainly belonged to four phyla: Actinobacteriota, Proteobacteria, Gemmatimonadota, and Methylomirabilota.
Fig. 2.
Impact of different fertilization ratios on fungal and bacterial β-diversity. β-diversity of bacteria (a, b) and fungi (c, d) was analyzed using PCOA and NMDS based on the weighted UniFrac algorithm.
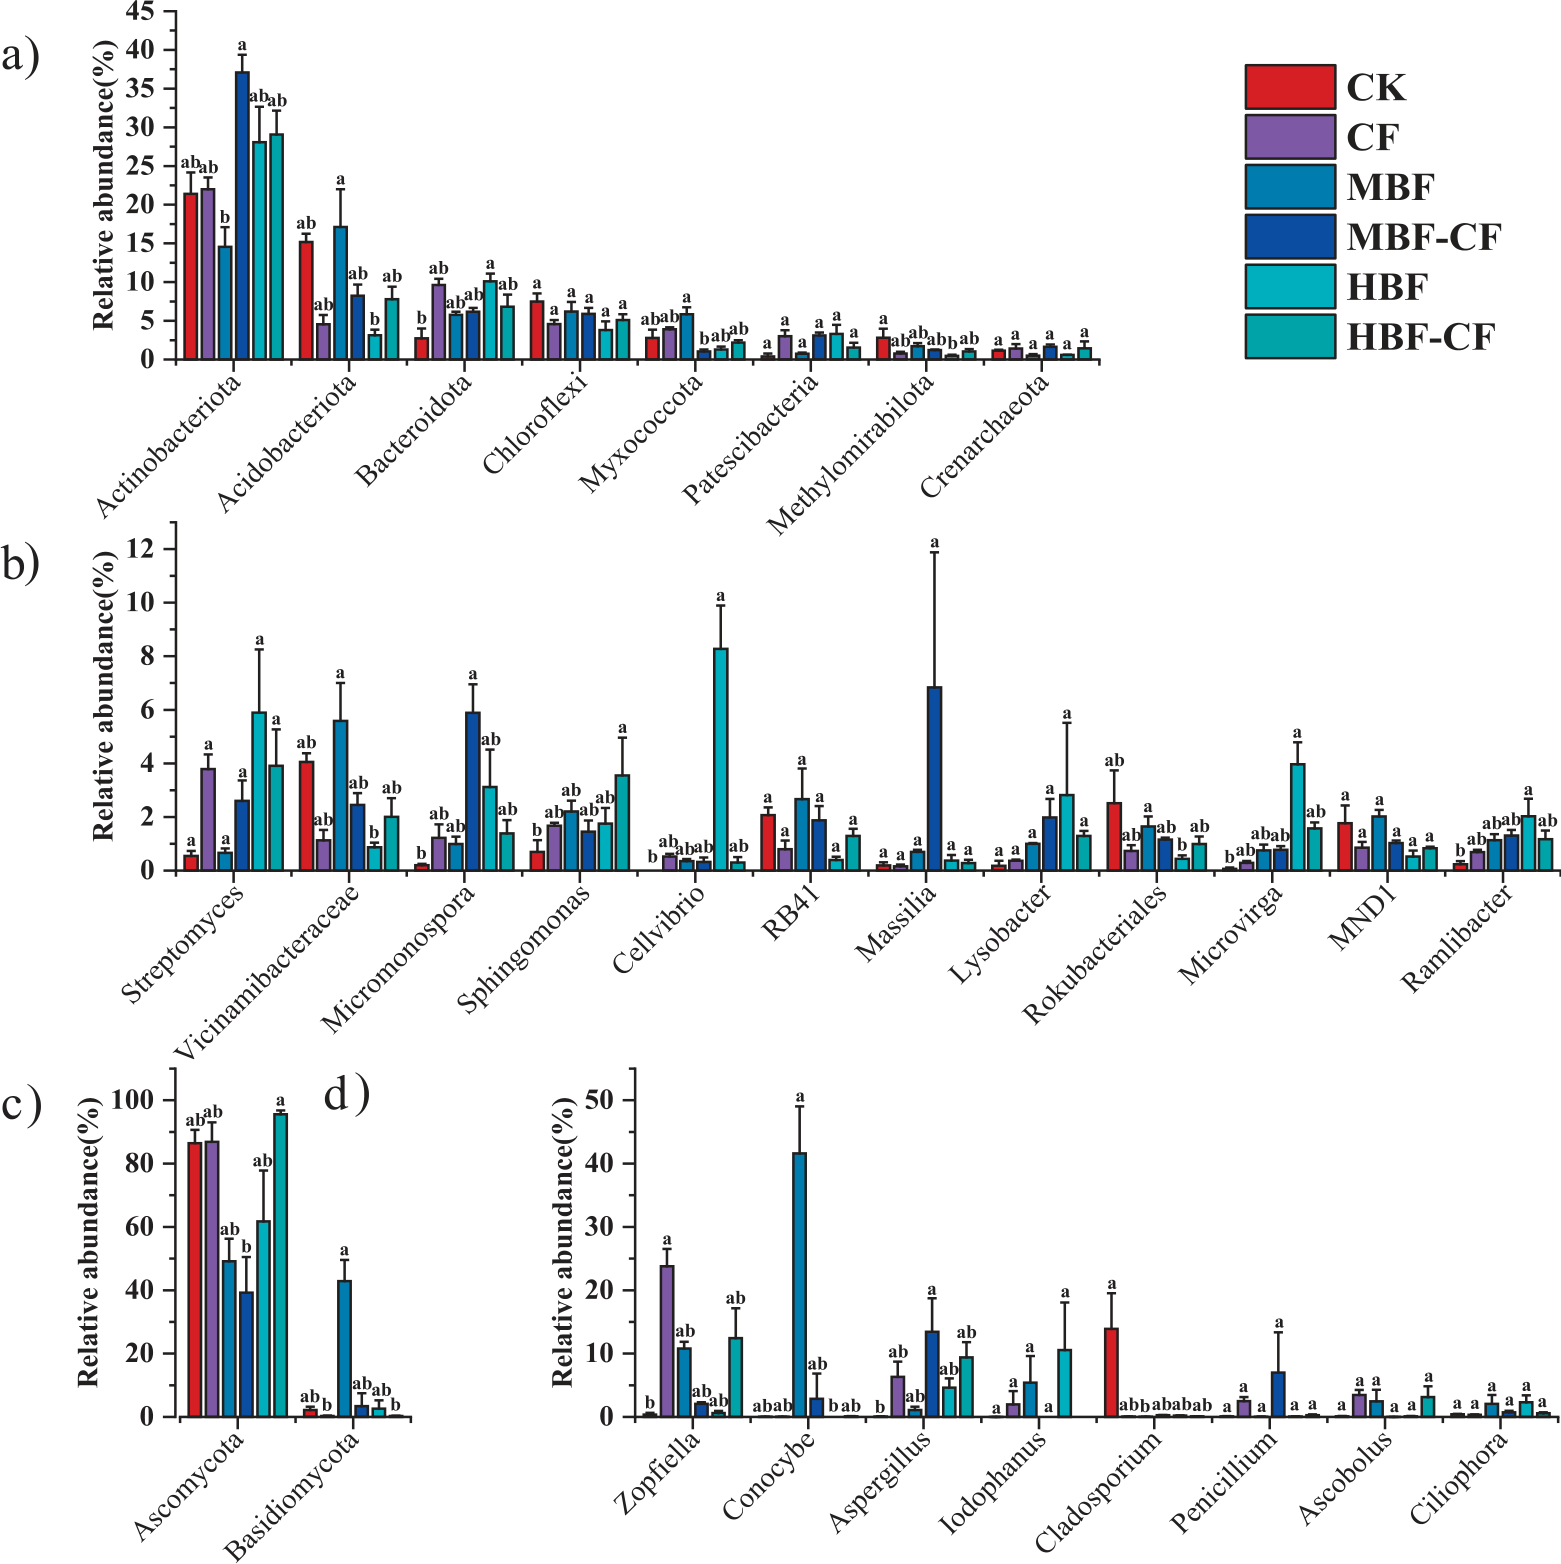
Kruskal-Wallis test analysis revealed that fertilization treatments significantly affected the abundance of some bacterial phyla and genera (p<0.05). Among the significantly different bacterial species, the abundance of Actinobacteriota (phylum) increased in the groups treated with basal fertilizer + top-dressing compared to those treated with the same concentration of basal fertilizer + no top-dressing, and the increase was significant in the MBF-CF treatment (Fig. 4a)). Actinobacteriota is an important group of soil bacteria that can decompose complex organic matter and participate in nitrogen cycling. The increase in its abundance may be related to the supplementation of inorganic nitrogen from compound fertilizer and organic matter. In addition, Kong et al. (2022) found that Actinobacteriota is abundant in the rhizosphere of healthy plants and can inhibit bacterial wilt, indicating that bio-organic fertilizer treatment may reduce the incidence of passion fruit disease by increasing the abundance of Actinobacteriota [55, 56]. Low concentration bio-organic fertilizer treatment promoted the growth of Acidobacteriota (phylum) and Vicinamibacteraceae (genus), but this effect was inhibited in high concentration bio-organic fertilizer treatment (Fig. 4b)). Acidobacteriota is usually associated with acidic soil environments, and its abundance changes may be related to the changes in soil pH caused by fertilization. It is also closely related to soil physicochemical properties and heavy metal resistance, and its increased abundance may enhance the heavy metal resistance of passion fruit [57, 58].
Compared with the CK treatment, the abundance of Bacteroidota (phylum), Cellvibrio (genus), Microvirga (genus), and Ramlibacter (genus) increased significantly in all other treatment groups, with the most significant increase in the HBF treatment group (Fig. 4a) and b)). Bacteroidota is directly related to soil quality and crop yield, and its increased abundance may indicate improved soil quality [59]. Myxococcota was positively correlated with soil organic matter, AP, and AK, and could promote crops to obtain sufficient nutrients from the soil [60]. The increase in its abundance further indicates that bio-organic fertilizer treatment enhanced the availability of soil nutrients. However, compared with the CK treatment, the abundance of Methylomirabilota (phylum) decreased in all other treatment groups, with the most significant decrease in the HBF treatment group (Fig. 4a)). Liu et al. (2024) showed that Methylomirabilota may be related to soil physicochemical properties, and its decreased abundance may be due to the increased soil porosity caused by bio-organic fertilizer application, which altered the soil’s physical structure [61].
Fig. 3.
The impact of different fertilization ratios on the abundance of dominant populations at the phylum and genus levels. Dominant populations are species with a relative abundance of microorganisms exceeding 1%. a) species with microbial abundance exceeding 1% at the bacterial phylum level; b) species with microbial abundance exceeding 1% at the bacterial genus level; c) species with microbial abundance exceeding 1% at the fungal phylum level; d) species with microbial abundance exceeding 1% at the fungal genus level.
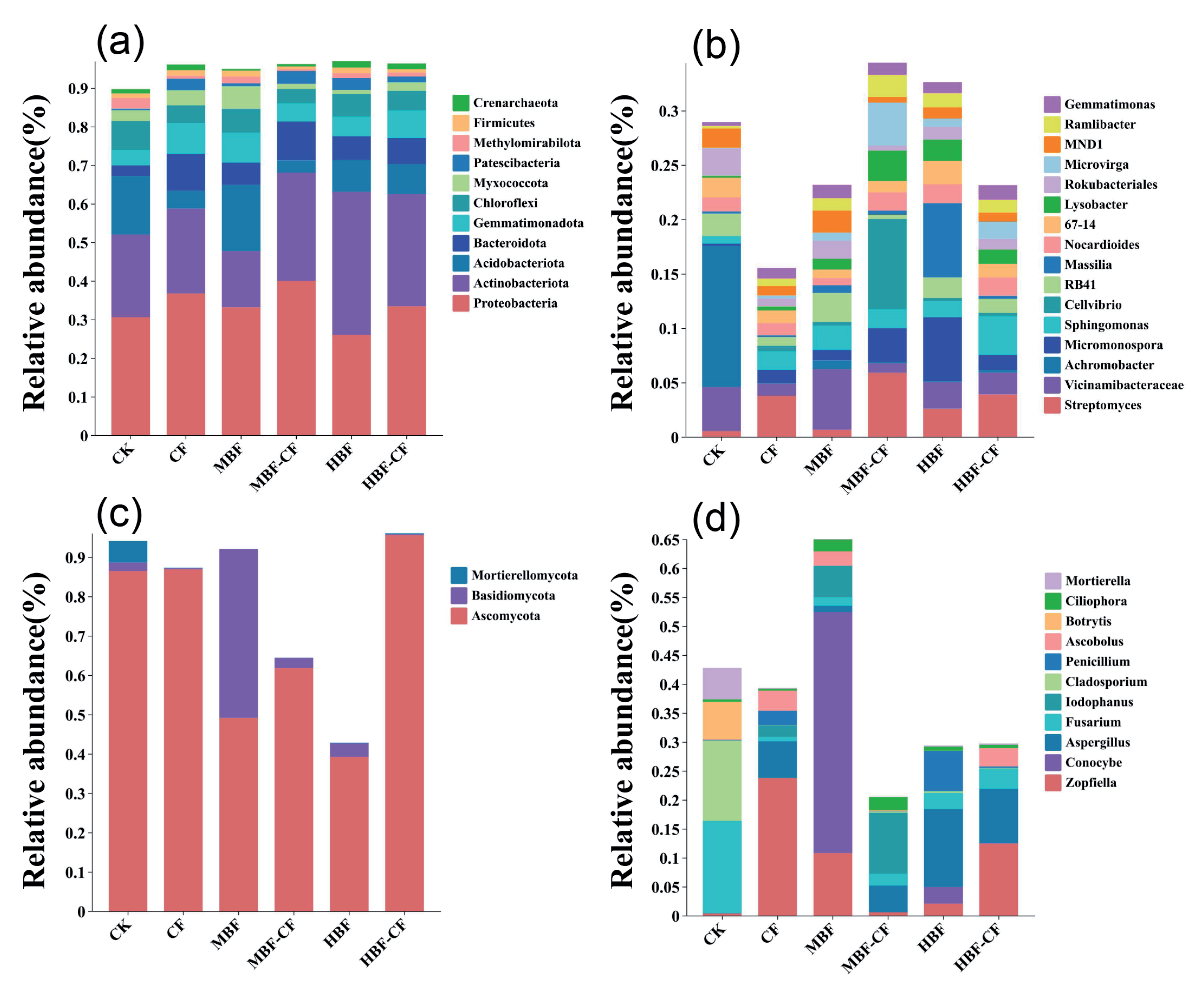
In terms of fungal communities, a total of 14 phyla and 298 genera of fungi were detected, among which 3 phyla and 11 genera had an average relative abundance of more than 1%. At the phylum level, Ascomycota (69.84%) dominated, followed by Basidiomycota (8.60%) and Mortierellomycota (1.01%) (Fig. 3c)). At the genus level, the top 10 genera by average relative abundance were Zopfiella (8.35%), Conocybe (7.44%), Aspergillus (5.83%), Fusarium (4.40%), Iodophanus (2.99%), Cladosporium (2.42%), Penicillium (1.66%), Ascobolus (1.54%), Botrytis (1.09%), and Ciliophora (1.07%) (Fig. 3d)). These dominant genera mainly belonged to three phyla: Ascomycota, Basidiomycota, and Mortierellomycota.
Kruskal-Wallis test analysis showed that fertilization treatments significantly affected the abundance of some fungal phyla and genera (p<0.05). The abundance of Ascomycota (phylum) in the HBF-CF treatment group was significantly higher than that in the MBF-CF treatment group (Fig. 4c)). Ascomycota is a widely distributed group of fungi in the soil that can decompose complex organic matter, and its increased abundance may be related to the combined application of compound fertilizer and bio-organic fertilizer, which provides more organic matter and nutrients [62]. The abundance of Basidiomycota (phylum) in the MBF treatment group was significantly higher than that in the other groups, indicating that a medium concentration of bio-organic fertilizer promoted the growth of Basidiomycota, while too high or too low concentrations of organic fertilizer inhibited its growth (Fig. 4c)). Compared with the CK treatment, the abundance of Zopfiella (genus) increased significantly in all other treatment groups, with the most significant increase in the CF treatment group (Fig. 4d)). The abundance of Conocybe (genus) in the MBF treatment group was significantly higher than that in the other groups, indicating that a medium concentration of organic fertilizer promoted its growth (Fig. 4d)). Liu et al. (2023) showed that Conocybe can induce the production of carboxylic acids and amino acids, stimulating the growth of microorganisms that degrade recalcitrant organic matter, and its increased abundance may further promote the decomposition of soil organic matter and the release of nutrients [63]. Compared with the CK treatment, the abundance of Aspergillus (genus) increased in all other treatment groups, with the most significant increase in the MBF-CF group (Fig. 4d)). In contrast, the abundance of Cladosporium (genus) decreased in all treatment groups, with the most significant decrease in the MBF treatment group (Fig. 4d)). Aspergillus is an important decomposer fungus, and its increased abundance may be related to the organic matter and nutrients provided by fertilization. Cladosporium is usually associated with plant diseases, and its decreased abundance may indicate that bio-organic fertilizer treatment reduced the disease risk of passion fruit.
Fig. 4.
The impact of different fertilization ratios on the significantly different species of fungi and bacteria. Dominant populations (with a relative abundance greater than 1%) were selected for Kruskal-Wallis test analysis at the phylum, family, and genus levels, and the resulting species with statistically significant differences (p<0.05) are presented. a) significantly different species at the bacterial phylum level; b) significantly different species at the bacterial genus level; c) significantly different species at the fungal phylum level; d) significantly different species at the fungal genus level. Different lowercase letters indicate significant differences between groups (p<0.05).
Effects of Fertilization Treatments on Soil Microbes and Environmental Factors
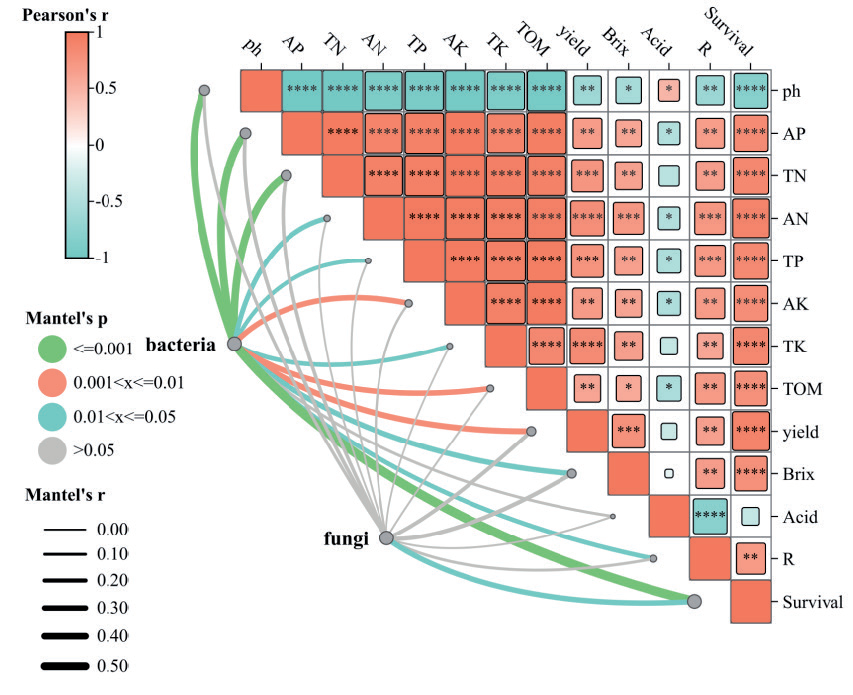
Correlation analysis between environmental factors and soil microbial communities (Fig. 5) revealed that soil pH, available phosphorus (AP), and total nitrogen (TN) exerted the greatest influence on the composition of soil bacterial communities (p<0.001). In contrast, the survival rate of passion fruit exhibited the most significant relationship with soil bacterial communities (p<0.001). All physicochemical indicators were significantly correlated with each other, likely because they were all directly affected by fertilization treatments. Additionally, soil ammonium nitrogen (AN) and total potassium (TK) had the greatest impact on the annual yield of passion fruit, while AN had the most significant impact on soil acidity. Soil pH, AP, AN, total phosphorus (TP), available potassium (AK), and soil organic matter (TOM) all had significant effects on the sweetness of passion fruit, with AN and TP having the greatest impact on the sugar-acid ratio. All physicochemical indicators had significant effects on the survival rate of passion fruit, indicating that soil nutrient status was closely related to the growth and yield of passion fruit.
The significant impact of soil pH, AP, and TN on bacterial communities may be due to their direct regulation of microbial metabolic activities and growth environments. pH is a key factor affecting soil microbial community structure because it directly influences microbial enzyme activity and nutrient availability. AP and TN, as important nutrient indicators, can further affect microbial community composition by altering the phosphorus and nitrogen content in the soil [38, 41, 64]. The significant correlation between the survival rate of passion fruit and bacterial communities suggests that soil microbes play an important role in maintaining plant health and disease resistance [55, 57]. Additionally, the significant impact of AN and TK on the annual yield of passion fruit may be related to the key roles of nitrogen and potassium in plant growth and fruit development [33, 65]. The significant impact of AN on soil acidity further indicates that the application of nitrogen fertilizer may indirectly affect microbial communities and plant growth by changing soil pH values.
Fig. 5.
Correlation heatmap overlaying Mantel test analysis of soil microorganisms, physicochemical properties, passion fruit quality, and yield. The Mantel test is used to examine the correlation between community matrices and environmental variable matrices. The larger the correlation coefficient of the Mantel test and the smaller the P-value, the greater the impact of environmental factors on microbial communities. Additionally, partial Mantel tests can eliminate the interference of autocorrelation among environmental factors. In the figure, rectangular frames indicate the correlations between different environmental factors established by Pearson, with green indicating negative correlation and red indicating positive correlation, and the deeper the color, the more significant the correlation. Different ranges of P-values in the figure are represented by lines of different colors, and the Mantel test_r values are indicated by the thickness of the lines, with *, **, ***, **** respectively representing significant correlations at the 0.05, 0.01, 0.001, 0.0001 levels.
To further explore the relationships between environmental factors and core OTUs (species with relative abundance > 1% and significant differences) in the bacterial and fungal phyla and genera under different fertilization treatments, redundancy analysis (RDA) was conducted in combination with soil nutrients and passion fruit yield. As shown in Fig. 6a), the first two axes of RDA explained 58.23% of the variation in bacterial core OTUs, with RDA1 explaining 46.13% and RDA2 explaining 12.10%. Soil pH, total potassium (TK), ammonium nitrogen (AN), and total phosphorus (TP) were the four main environmental factors affecting bacterial phyla and genera communities (p<0.05), with pH having the greatest impact on bacterial communities, explaining 27.40% of the variation in core OTUs. pH was positively correlated with Acidobacteriota, Myxococcota, Methylomirabilota, Vicinamibacteraceae, and Rokubacteriales, with the strongest correlation with Rokubacteriales; it was negatively correlated with Actinobacteriota, Bacteroidota, Micromonospora, Sphingomonas, Cellvibrio, Microvirga, and Ramlibacter, with the strongest correlation with Bacteroidota. As shown in Fig. 6b), the first two axes of RDA explained 58.14% of the variation in fungal core OTUs, with RDA1 explaining 34.31% and RDA2 explaining 23.82%. Ammonium nitrogen (AN), available potassium (AK), available phosphorus (AP), and soil organic matter (TOM) were identified as the four main environmental factors influencing fungal phyla and genera communities (p<0.05). Among these, AN exerted the greatest influence on fungal communities, accounting for 25.90% of the variation in core OTUs. Soil pH exhibited a positive correlation with Ascomycota and Cladosporium, showing the strongest correlation with Cladosporium. In contrast, pH displayed a negative correlation with Basidiomycota, Zopfiella, Conocybe, and Aspergillus, with the strongest correlation observed with Zopfiella.
Fig. 6.
Redundancy analysis of soil nutrients and microorganisms under different fertilization ratios (a) for bacteria, b) for fungi). Actinob: Actinobacteriota; Acidoba: Acidobacteriota; Bacter: Bacteroidota; Myxoco: Myxococcota; Methyl: Methylomirabilota; Vicina: Vicinamibacteraceae; Microm: Micromonospora; Sphing: Sphingomonas; Cellvi: Cellvibrio; Rokuba: Rokubacteriales; Microv: Microvirga; Ramlib: Ramlibacter; Ascomy: Ascomycota; Basidi: Basidiomycota; Zopfie: Zopfiella; Conocy: Conocybe; Asperg: Aspergillus; Clados: Cladosporium.
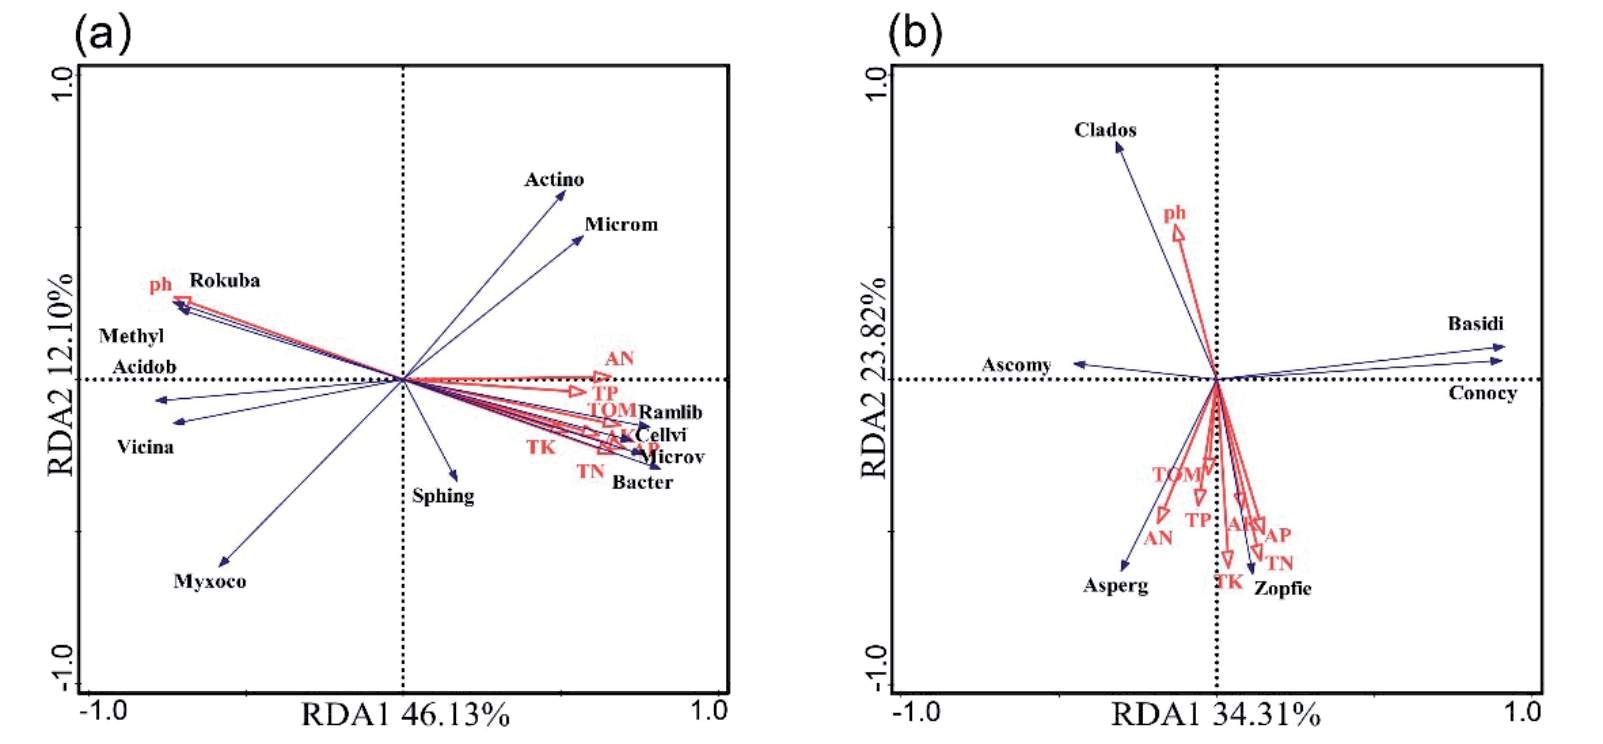
Acidobacteriota typically thrives in acidic conditions, with its abundance positively correlated with pH, giving it a competitive edge under low pH. Similarly, Ascomycota and Cladosporium show positive pH correlations, indicating they also favor acidic soils [66, 67]. Conversely, Bacteroidota’s negative pH correlation suggests it may prefer neutral or alkaline soils. Likewise, Basidiomycota and Zopfiella’s negative pH correlation implies they are better adapted to neutral or alkaline conditions [53, 68, 69].
The significant impact of AN on bacterial and fungal communities indicates that nitrogen supply indirectly affects microbial community structure by altering soil nitrogen cycling processes [65]. The significant impact of TK and TP on bacterial communities may be related to the important roles of potassium and phosphorus in microbial metabolism [70]. The significant impact of AK and AP on fungal communities may be related to the important roles of potassium and phosphorus in fungal growth and reproduction [71, 72]. The significant impact of TOM on fungal communities indicates that the increase in organic matter promotes fungal growth and activity by providing more carbon sources and energy [73].
Conclusions
The combined application of bio-organic fertilizer and compound fertilizer has a significant impact on soil quality and microbial communities. This fertilization strategy not only increases the nutrient content of the soil but also improves its physicochemical properties, particularly by reducing soil pH, creating more favorable conditions for the growth of passion fruit.
Soil microbial diversity is closely related to the growth and yield of passion fruit. The application of bio-organic fertilizer increases the number of beneficial microorganisms in the soil, which helps reduce the incidence of diseases in passion fruit, enhances the crop’s resistance to heavy metals, and thereby indirectly increases the yield and improves the quality of passion fruit.
Using statistical methods like RDA, Mantel tests, and Pearson correlation analysis, we found that the soil microbial composition under the treatment of 2 kg/plant of bio-organic fertilizer as a basal fertilizer combined with 8 g/plant of compound fertilizer as a top-dressing (MBF-CF) is more favorable for passion fruit growth. In this treatment, half the amount of bio-organic fertilizer used in the HBF-CF treatment resulted in a passion fruit yield of 1.12 kg/plant, with no significant difference in fruit sugar-acid ratio compared to the HBF-CF treatment. This indicates that appropriate fertilization strategies can optimize soil microbial community structure, thereby promoting healthy crop growth. Environmental factors are closely linked to the structure and function of microbial communities, which in turn directly affect the growth status and yield of passion fruit. Therefore, rational regulation of fertilization strategies and maintenance of soil microbial diversity are of great significance for increasing crop yield and quality.
In summary, this study underscores the importance of combining bio-organic and compound fertilizers for enhancing soil quality and crop yield, highlighting the pivotal mediating role of soil microbes. However, the research solely investigated this fertilizer combination in a single-region soil condition. Further refinement regarding different fertilizer ratios and top-dressing options is necessary. Future studies should explore how various fertilizer ratios and methods impact crop growth and soil environments across different regions and crops. Future research should also evaluate the applicability of these strategies under diverse soil and climate conditions to provide more precise and sustainable guidance for agricultural production.

