

Introduction
Wheat is the third largest crop in cereal production after maize and rice, and it contributes 40% of the protein and 45% of the calories to our population [1, 2]. It is estimated that by 2050, our population’s demand for wheat will increase by 60%, which poses a serious challenge to increasing the production of food in our country [3]. In addition, by the end of the 21st century, climate change and global warming will lead to severe droughts in more than 15% of the world’s wheat-growing areas, which in turn will affect 5% of wheat productivity [4]. It is well known that Xinjiang is located in the inland arid region of Northwest China, which is an important base for cereal crop production due to its abundant light and heat resources. Wheat is the main grain crop in Xinjiang, and the sown area is around 1.1×10⁶ ha in recent times [5]. Moisture deficit and climatic drought are important factors causing serious losses in wheat production in China, and the total water consumption of winter wheat in the north of China during the whole reproductive period is 400-600 mm. Precipitation alone cannot meet the water demand of winter wheat during all reproductive periods, especially in the Xinjiang region, where arid climate, low precipitation, serious waste of water resources, and conflicting problems of supply and demand between precipitation and crop water demand have seriously hampered the sustainable development of wheat in Xinjiang [6, 7, 8]. Therefore, it is significant to explore a drought-resistant and water-saving program suitable for water conservation and a yield increase of winter wheat in Xinjiang and for water conservation and a yield increase of drip-irrigated winter wheat in Xinjiang.
A water deficit and the uneven distribution of precipitation have become major challenges in meeting the growth requirements of winter wheat; thus, supplemental irrigation is imminent for wheat production [9]. Deficit-regulated irrigation is an efficient water-saving irrigation technique widely used in recent years for crops such as fruit trees [10] and maize [11]. It has been reported that wheat under water stress during the starting period will result in a significant reduction in plant height, tiller number, leaf area index, photosynthesis, and relative chlorophyll content (SPAD), which ultimately leads to a decrease in dry matter accumulation and the yield of wheat [12]. It has been shown that deficit-regulated irrigation during the nutritive growth period of crops can increase the remobilization of pre-flowering carbon retained in the nutritive tissues to the grain and that insufficient water in the pre-reproductive stage not only reduces redundancy in the growth of stems and leaves but also improves the drought tolerance of the crop in the late reproductive stage. It ultimately facilitates the translocation of photosynthesis assimilates to the final products, thus achieving a stable or even an increased yield [13]. Irrigation at the early reproductive stage (jointing and heading) is beneficial for increasing wheat yield and water productivity. XU et al. showed that 60 mm of irrigation at the critical reproductive stage (jointing) of winter wheat is the optimal irrigation scheme for efficient water use and relatively high winter wheat yields in the North China Plain [14]. MEN et al. showed that compared with irrigation of 2700m3 ha-1 during the whole life cycle of wheat, 2025m3 ha-1 irrigation would reduce the total water consumption of wheat by 9.80%, while water use efficiency would be increased by 9.68% [15]. ZHOU et al. showed that irrigation of 75 mm at each of the nodulation and anthesis stages of wheat could achieve a stable yield of winter wheat and the maximum water-saving effect [16].
More studies on wheat yield formation and water use efficiency under deficit-regulated irrigation have been conducted by previous researchers, but the research direction has geographical differences and fertility period differences. Due to the specificity of geographic and climatic factors in Xinjiang, little research has been reported on the theory and technology related to water saving from the starting period to the filling period of wheat in applying deficit-regulated irrigation technology. In view of the current irrigation volume on the yield and water utilization efficiency of drip-irrigated winter wheat in Xinjiang, there are still different results, and the appropriate level of irrigation for water conservation and high yield in various places still needs to be determined. Therefore, based on previous research, this experiment used a two-factor split-area experimental design with two variety levels, five water deficit treatments, and one normal irrigation treatment to clarify the key water factors affecting winter wheat yield and to determine the effects of different deficit-regulated irrigation schemes on winter wheat yield and its water-use efficiency by studying the effects of different deficit-regulated irrigation schemes on winter wheat yield and its water-use efficiency. This study aims to provide some reference and theoretical basis for the development of precise irrigation programs in winter wheat production areas in Xinjiang.
Materials and Methods
The Experiment Site
The experiment was conducted in 2023-2024 at the Qitai Wheat Experiment Station of the Xinjiang Academy of Agricultural Sciences (43°59′57″N, 89°45′23″E) on sandy loam soil, with the basic physicochemical properties of organic matter of 12.22g kg-1, alkaline dissolved nitrogen of 54.6mg kg-1, effective phosphorus of 16.1mg kg-1, quick-acting potassium of 81.3mg kg-1, effective precipitation of 48.04 mm, effective cumulative temperature of 2087.5°C (>0°C), and climatic changes during the reproductive period of wheat as shown in Fig. 1 (provided by the local weather station).
Experimental Design
A two-factor split-area experimental design was used, with New Winter 22 (A1) and New Winter 18 (A2) as varieties in the main area (A), and 2280m3 ha-1 (W1), 2820m3 ha-1 (W2), 3360m3 ha-1 (W3), 3900m3 ha-1 (W4), 4440m3 ha-1 (W5), and 4980m3 ha-1 (CK), and the irrigation method was drip irrigation (Table 1), with water volume precisely controlled by a water meter. The sowing rate was 3 million grains ha-1, manually sown in strips with a row spacing of 0.2 m. The plot area was 12 m2 (2m × 6m) with three replications. Before sowing, 223kg ha-1 of pure nitrogen (the base-to-track ratio was 6:4, and the supplementary fertilizer was applied in a furrow during the pulling period), 121kg ha-1 of P2O5, and 122kg ha-1 of K2O were applied uniformly. Protective rows were set up around the experimental site, and the other management measures were consistent with those of local fields.
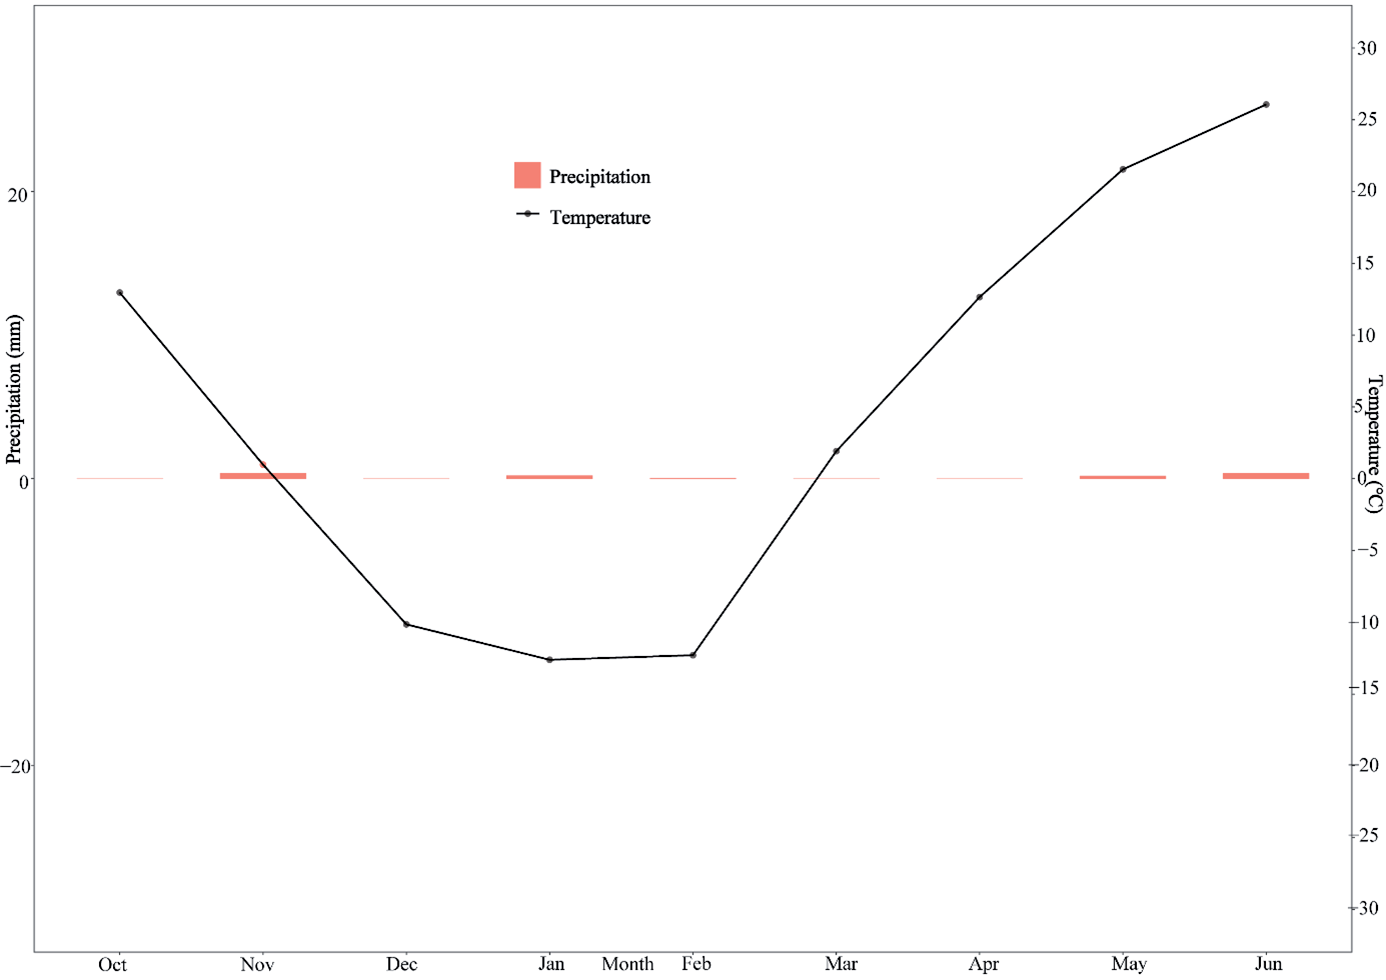
Table 1.
Drip irrigation amount at different growth stages of winter wheat m3 ha-1.
Determination of Leaf Area Index
Twenty whole plants were randomly selected from each treatment at the seedling, regenerating, rising, jointing, botting, heading, flowering, and grain-filling stages. The leaf area was determined using the aspect coefficient method, and the leaf area index was calculated [17]:
Leaf area (cm2) = Length (cm) × Width (cm) x 0.83 (correction factor)
Leaf area index = Total leaf area per unit land area/ Land area;
Measurement of SPAD Values
Using the SPAD-503 chlorophyll meter, 20 plants were randomly selected from each treatment at the seedling, regenerating, rising, jointing, botting, heading, flowering, and grain-filling stages. The SPAD average values of fully expanded leaves (emergence and nodulation) or flag leaves, inverted second leaves, and inverted third leaves were measured from 10:00 a.m. to 12:00 p.m. [18].
Determination of Water Consumption and its Water Use Efficiency
Soil mass moisture content was determined by the drying method, with one layer per 20 cm soil layer and a total of four layers, and soil water consumption and water use efficiency were determined in the following manner [19]:
WUE = Y/ET (WUE is water use efficiency (kg ha-1 mm-1); Y is yield (kg ha-1); and ET is water consumption (mm)).
Total water consumption during the entire reproductive period (m3 ha-1) = soil water storage consumption during the whole reproductive period + effective precipitation during the whole reproductive period + total irrigation during the whole reproductive period + groundwater recharge.
Full-birth period soil water storage consumption = 10ΣρiHi (θi1-θi2), (i = 1, 2, ......, n);
Where i is the soil layer number; n is the total number of soil layers; ρi is the dry bulk weight of soil in layer i; Hi is the thickness of the soil in layer i; and θi1 and θi2 are the water content of the soil in layer i before sowing and at the time of harvesting, respectively. In terms of the percentage of dry soil weight, effective precipitation during the whole reproductive period is 36.60 mm (provided by the local weather station), and the total irrigation volume of the whole reproductive period is accurately determined by the water meter. The groundwater burial depth of the test site is greater (the groundwater depth at the test site was more than 5m, and the groundwater recharge was negligible).
Irrigation water use efficiency (kg ha-1) = wheat grain yield/total irrigation water volume during the whole reproductive period;
Water use efficiency (kg ha-1) = wheat grain yield/ total water consumption during the whole reproductive period.
Statistical Analysis
Data were collated using Microsoft Excel 2017 software, analyzed by ANOVA, and plotted using R.4.2.1 language software. Where there were significant (P<0.05) differences, multiple comparisons were made using the least significant difference (LSD) method [20].
Results
Effect of Deficit-Regulated Irrigation on LAI of Drip-Irrigated Winter Wheat at Different Fertility Periods
Wheat leaf area index (LAI) varied significantly among different deficit-regulated irrigation treatments at different fertility periods, with LAI showing a tendency to increase and then decrease with decreasing irrigation (Fig. 2). Under CK treatment, LAI of the A1 variety was significant (P<0.05) or higher than that of the A2 variety at the jointing stage, while it was highly significant (P<0.001) higher than that of the A2 variety at the jointing, botting, heading, flowering, and filling stages. Compared with CK, the average decrease in the LAI index under different deficit-adjusted irrigation treatments from jointing to filling was, from largest to smallest, in the following order: 34.05% (W1) > 23.80% (W2) > 13.95% (W3) > -4.14% (W4) > -22.29% (W5). As the reproductive process progressed, the LAI index under different deficit-regulated irrigation treatments showed an increasing and then decreasing trend. It reached a maximum at the tasseling stage at 5.06 (W5), 4.32 (W4), 3.47 (W3), 3.46 (W2), and 3.20 (W1), respectively. The LAI index of the A2 variety increased by 48.06, 33.65, 43.22, and 70.22% under W4, W3, W2, and W1 treatments, respectively, compared to the A1 variety. This indicates that the A2 variety has the ability to significantly increase wheat LAI as the degree of deficit-regulated irrigation increases.
Effects of Deficit-Regulated Irrigation on SPAD Values of Drip-Irrigated Winter Wheat at Different Fertility Periods
Deficit-regulated irrigation significantly affected the SPAD values of different winter wheat varieties, which showed an increasing and then decreasing trend with decreasing irrigation (Fig. 3). In particular, under extreme drought conditions, the A2 variety was able to maintain higher leaf photosynthesis compared with the A1 variety. From the heading to the filling stage, the average decreases in SPAD values of winter wheat under different irrigation treatments compared with CK were, in descending order, 13.90% (W1) > 6.03% (W2) > -0.05% (W3) > -3.81% (W5) > -7.07% (W4). During the period from heading to filling, the SPAD values of A1 and A2 varieties under different deficit-regulated irrigation treatments were 56.63 (W5) > 47.95 (W4) > 44.45% (W3) > 40.28 (W2) > 35.08 (W1) and 54.78 (W4) > 51.51 (W5) > 50.42 (W3) > 47.54 (W2) > 44.04 (W1), where the SPAD values reached maximum at the tassel stage in the A1 variety and the flowering stage in the A2 variety. This indicates that the A2 variety was able to maintain high photosynthetic vigor in the later stages of wheat fertility.
Fig. 2.
Leaf area index of wheat at different fertility stages with different water stress treatments.
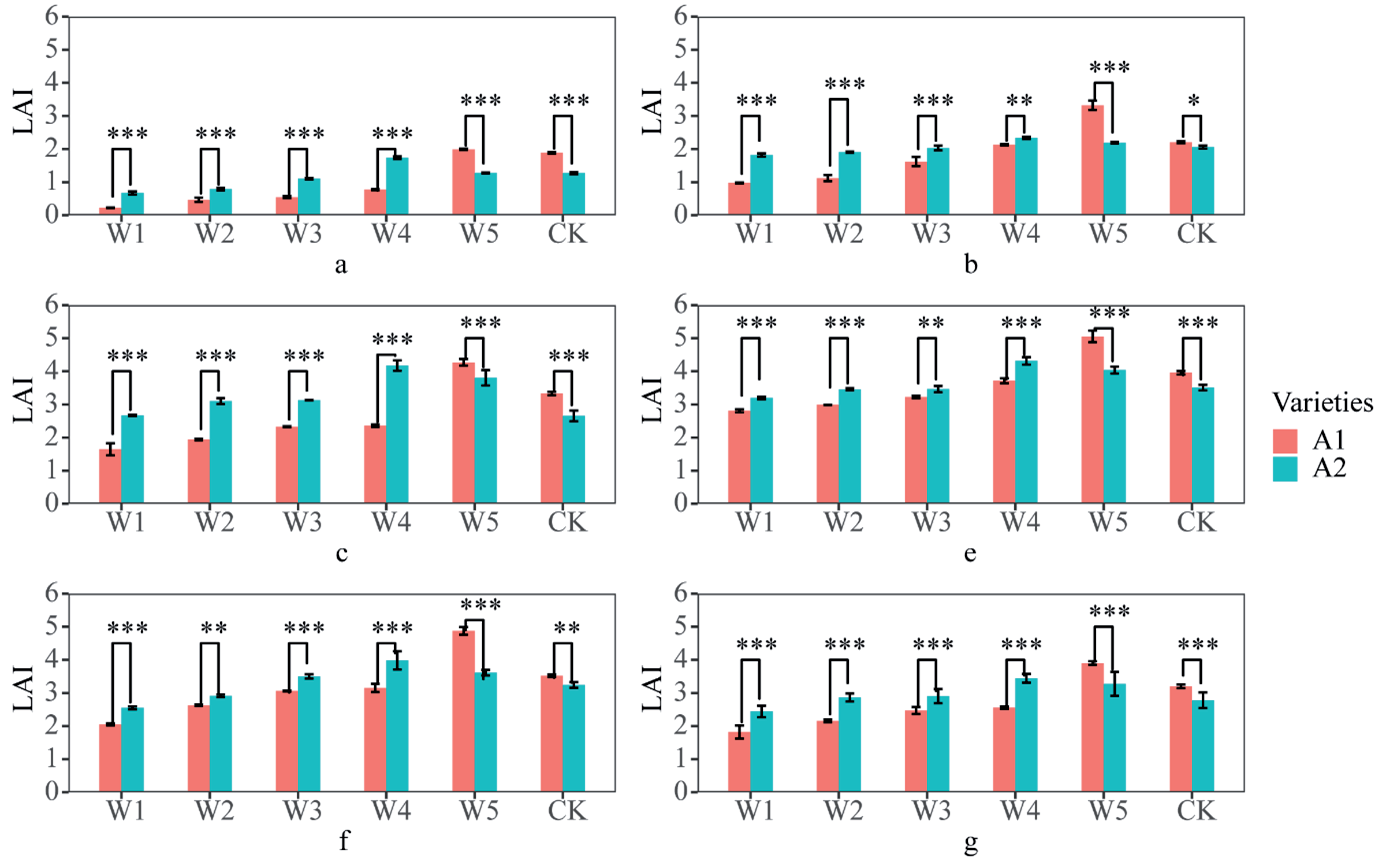
Fig. 3.
Effects of regulated deficit irrigation on the SPAD value changes of winter wheat at different growth stages. Note: ns, not significant at P<0.05; * Significant at P < 0.05; **Significant difference at P<0.01; ***Extremely significant difference at P<0.001, The same below; Fig. 3a, c, d, e, f show the stage of rising, jointing, botting, heading, flowering, grain filling stage, respectively, The same flow.
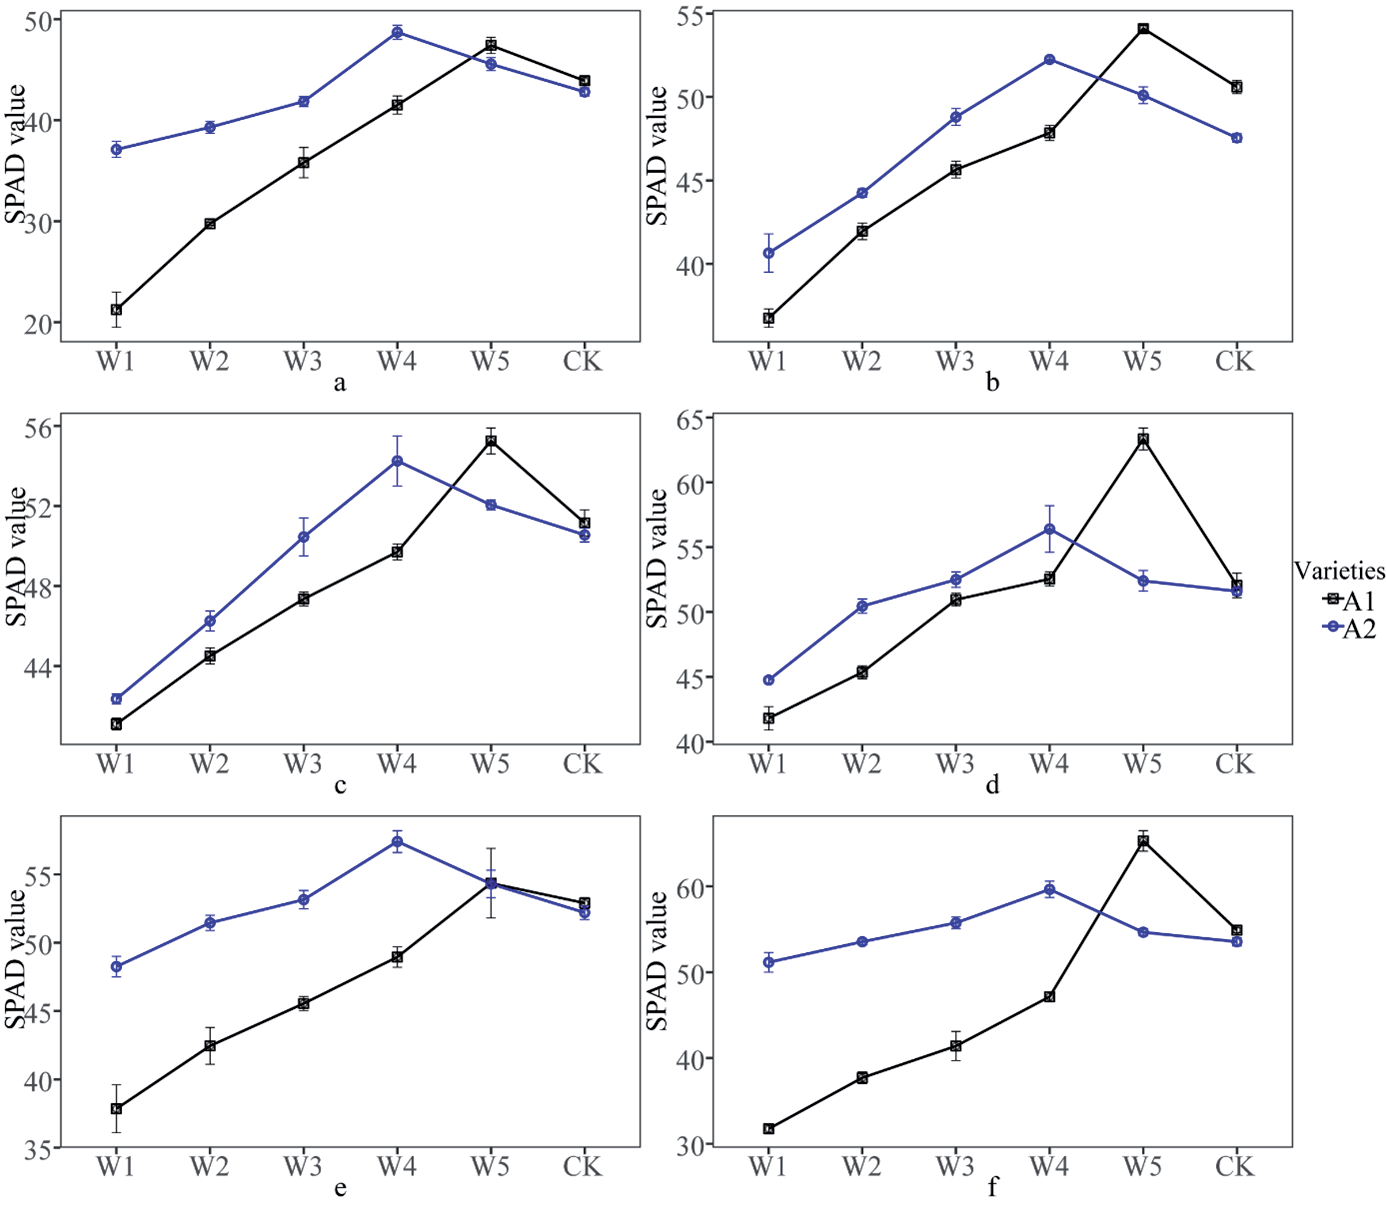
Table 2.
Effects of regulated deficit irrigation on winter wheat yield and yield components.
The Effects of Deficit-Regulated Irrigation on The Yield and Components of Drip-Irrigated Winter Wheat
Regulated deficit irrigation had a significant effect on the number of spikes, number of grains per hectare, 1000-grain weight, and yield of wheat, which showed increasing and then decreasing trends with decreasing irrigation volume (Table 2). Compared to CK, the average decreases in the number of spikes, number of grains per hectare, and thousand-grain weight of wheat under different deficit-regulated irrigation treatments were, in descending order, 35.00% (W1) > 25.83% (W2) > 16.67% (W3) > 2.50% (W4) > -13.33% (W5), 8.75% (W1) > 6.09% (W2) > 4.23% (W3) >2.20% (W4) >-3.66% (W5) and 18.90% (W1) >14.00% (W2) >7.34% (W3) >0.99% (W4) >13.33% (W4) >-3.73% (W5), where the number of spikes, number of grains per spike per hectare, and 1,000-grain weight of wheat showed a significant trend, increasing with an average increase of 13.33% under the W5 treatment, respectively, and 3.66% and 3.73%, respectively. Compared to CK, yield showed an increasing and then decreasing trend with decreasing irrigation and decreased by an average of 14.47%, 10.10%, and 2.39% under W1, W2, and W3 treatments, whereas it increased by an average of 13.49% and 11.38% under W4 and W5 treatments. Compared to the A1 variety, the A2 variety showed a yield, and its components showed a significant increase, reaching a maximum under W4 treatment with 1710 (×104 ha- 1), 27.04, 46.03 (g), and 6550.03 (kg ha-1), respectively. This suggests that selecting the A2 variety under W4 treatment may lead to better economic benefits when implementing water conservation and yield enhancement strategies.
Effects of Deficit-Regulated Irrigation on The Spatial and Temporal Patterns of Water Changes in Drip-Irrigated Winter Wheat at Different Fertility Periods
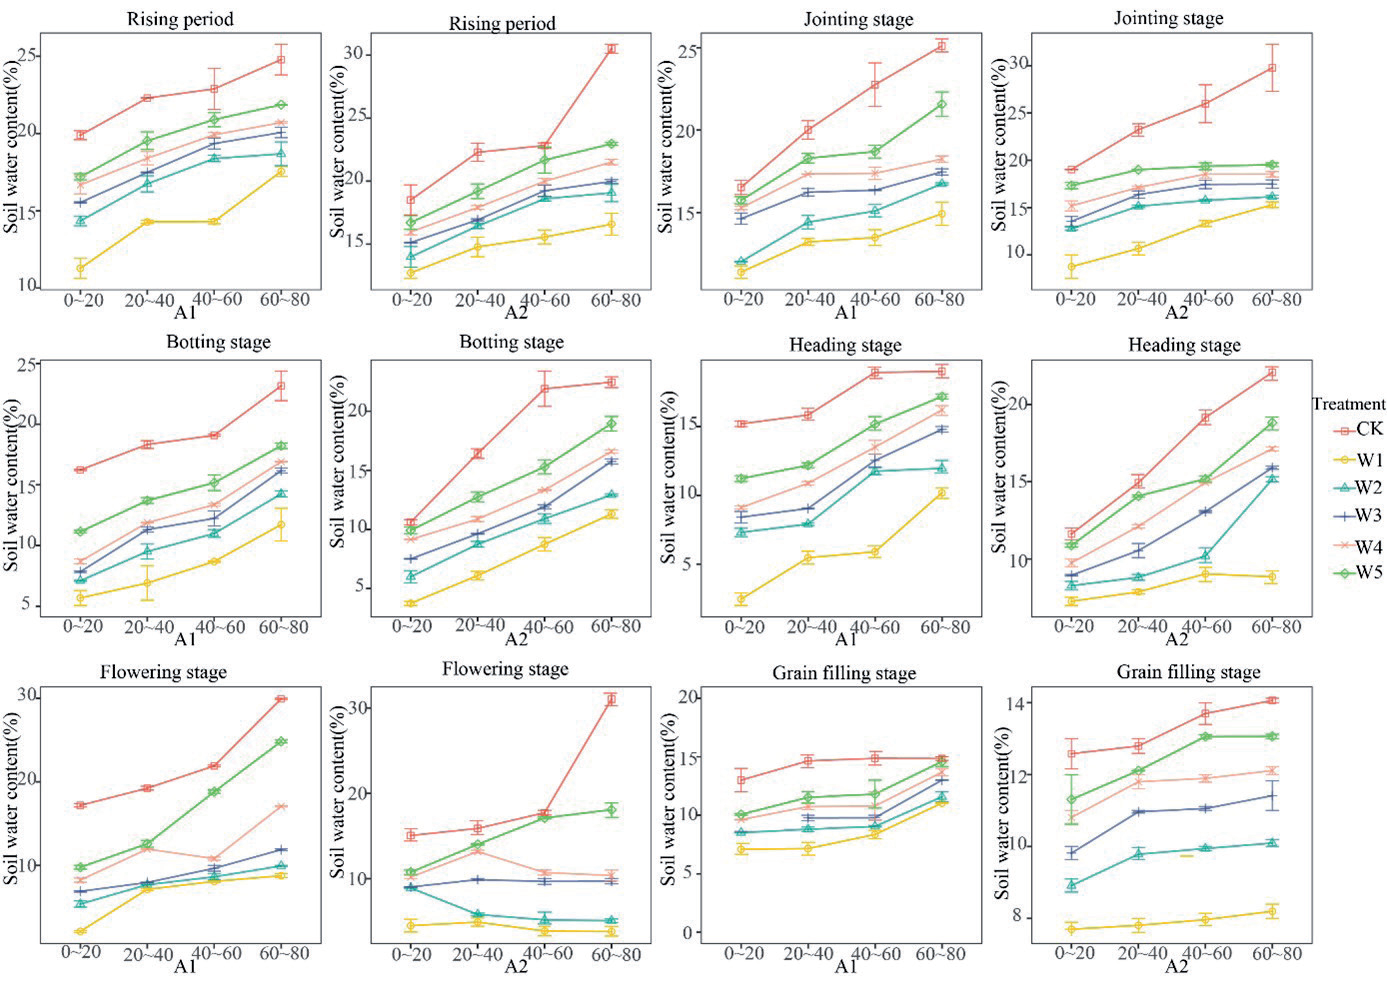
The soil water content of the A1 variety showed a significant increasing trend with increasing soil depth from 0~80 cm from the rising stage to the filling stage, whereas the soil water content of the A2 variety showed a decreasing trend under W1, W2, and W3 treatments at the flowering stage (Fig. 4). Compared with CK, the average decrease in soil water content under different deficit-regulated irrigation treatments was 51.88% (W1) > 40.31% (W2) > 26.30% (W3) > 26.10% (W4) > 17.07% (W5) in descending order at soil depths of 0-80 cm, with an average decrease in soil water content in different soil layers during the period of initiation to filling being 20~40% (W1) > 40.31% (W2) > 26.30% (W3) > 26.10% (W4) > 17.07% (W5), in descending order. The average decrease of soil water content in different soil layers is 20~40 (35.33%) > 40~60 (33.34%) > 0~20 (31.62%) > 60~80 (29.10%), in order of size. With the advancement of the reproductive process, the decrease of soil water content in 0~80 cm of wheat showed a trend of rising and then decreasing, among which the decrease of soil water content in the flowering stage reached the maximum, which was 74.9% in different deficit-regulating irrigation treatments in order of large to small. The decreases were 74.00% (W1) > 64.87% (W2) > 53.40% (W3) > 43.46% (W4) > 24.30% (W5) in descending order. Further analysis showed that the average increase in soil water content from 0 to 80 cm in the A2 variety was 1.04% compared to the A1 variety, where the average increase under different deficit-regulated irrigation treatments was 5.84% (W1)>1.61% (W2)>1.57% (W3)>0.16% (W4)>-1.18% (W5)>-1.78% (W5) in descending order, where the average increase was 5.84% (W1)>1.61% (W2)>1.57% (W3)>0.16% (W4)>-1.18% (W5)>-1.78% (W5), where the average decrease in soil water content in different soil layers was 60~80 (4.99%) > 0~20 (4.07%) > 20~40 (3.10%) > 40~60 (1.96%) in descending order. This indicates that the wheat root system of the A2 variety can effectively utilize water in the deeper layers of the soil at the later stages of fertility.
Effect of Deficit-Regulated Irrigation on Water Use Efficiency in Drip-Irrigated Winter Wheat at Different Fertility Periods
Under the deficit-regulated irrigation treatment, the total water consumption showed a significant decreasing trend with a decreasing irrigation volume. On the contrary, irrigation water use efficiency and water use efficiency showed an “N” trend (Table 3). Compared to CK, the average increases in irrigation water use efficiency and water use efficiency under different deficit-regulated irrigation treatments were, in descending order, 86.80% (W1) > 58.76% (W2) > 44.91% (W4) > 44.66% (W3) > 24.89% (W5) and 60.48% (W1) > 43.45% (W2) > 39.32% (W4) > 35.49% (W3). 35.49% (W3) > 22.78% (W5), while the total water consumption showed a significant decreasing trend, from large to small, of 46.77% (W1) > 37.37% (W2) > 27.99% (W3) > 18.59% (W4) > 9.26% (W5). Compared to CK, the average increase in irrigation water use efficiency and water use efficiency under the deficit-adjusted irrigation treatments were 52.00% and 40.30%, respectively. Irrigation water use efficiency and water use efficiency reached a maximum under W1 treatment, and total water consumption reached a maximum under CK treatment. Under W1, W2, W3, and W4 treatments, total water consumption, irrigation water use efficiency, and water use efficiency of the A2 variety increased by an average of 0.28, 13.97, and 13.68 percent, respectively, compared to the A1 variety. At the same time, they decreased by 0.16, 23.92, and 23.79 percent under W5 and CK treatments, respectively. It indicates that W1, W2, and W4 treatments of the A2 variety were beneficial in increasing irrigation water use efficiency, and the water use efficiency of wheat is highly significant (P < 0.001).
Table 3.
Effects of regulated deficit irrigation on water use efficiency of winter wheat.
Discussion
The level of leaf area index (LAI) is an important parameter reflecting the dynamic growth rate of the crop; therefore, LAI plays an important role in the growth and development process of wheat, and a higher LAI not only improves leaves’ ability to accumulate dry matter but also increases yield and reduces the waste of light and heat resources [21]. The present study showed that the leaf area index is closely related to the irrigation volume. Compared to CK, the average decrease in the LAI index under different deficit-adjusted irrigation treatments was W1 > W2 > W3 > W4 > W5, in descending order from start-up to filling. Under extreme drought conditions, the leaf area index of wheat showed a significant decreasing trend with the decrease of irrigation volume, while under mild or moderate drought conditions, the leaf area index of wheat showed an increasing and then decreasing trend with the decrease of irrigation volume, which was consistent with the results of the present experiment. Relative chlorophyll content is one of the important indicators reflecting the photosynthetic efficiency of leaves, which can directly affect the absorption, transmission, and distribution of light energy and the efficiency process of photosynthesis [22]. LUO et al. showed that its SPAD value increased by 5.41% and 4.42% under 4200m3 ha-1 irrigation compared to 3000m3 ha-1 and 3600m3 ha-1 irrigation treatments, respectively [23]. In this experiment, it was found that the SPAD value of drip-irrigated winter wheat under the deficit-regulated irrigation mode showed a tendency to increase and then decrease with the increase of irrigation volume. With advances in the fertility process, the SPAD value showed a tendency to increase and then decrease. It was found that the SPAD value was not only affected by the irrigation volume but also by the wheat varieties. The SPAD value of the A1 variety reached the maximum value at the tassel stage compared to the A2 variety, and the SPAD value of the A1 variety reached the maximum value at the flowering stage, which may be due to the fact that the A1 variety is more important in the flowering stage of wheat. This may be due to the reduced efficiency of soil water use by the A1 variety in the later stages of wheat fertility and reduced chlorophyll synthesis due to increased evaporation. This is roughly the same as the findings of YANG et al. [24] and AN et al. [25].
The level of soil moisture content is the main factor affecting crop uptake of soil nutrients and dry matter translocation and accumulation [26, 27]. It has been shown that reducing the irrigation volume favors the water use of deep soil layers by wheat, and the soil storage consumption from 0 to 200 cm was reduced by 15.50% at 3360 m3 ha-1 irrigation volume compared with 710m3 ha-1 irrigation volume [28]. This experiment showed that, compared with CK, at 0-80 cm soil depth with the decrease of irrigation water volume, there was a significant decreasing trend, in which W1 decreased the most. With the deepening of soil depth, there was a gradually decreasing trend. This indicates that the decrease in irrigation volume benefits wheat’s use of soil water content in the deeper soil layer. This is roughly the same as the results of WU et al. [29]. It indicates that W1 treatment is conducive to the soil’s own water supply capacity, thus saving irrigation water and making full use of deep soil moisture.
Irrigation volume has a significant effect on crop yield and water use efficiency. In contrast, water use efficiency (WUE) plays an important role in crop growth and development as an important indicator for evaluating the degree of crop utilization of soil moisture, atmospheric precipitation, and irrigation water [30, 31]. Studies have shown that under limited water supply conditions, irrigation time and irrigation volume are two key factors to improve WUE [32]. Reducing irrigation water use and improving water use efficiency without affecting crop production have become increasingly important for sustainable agricultural development [33]. SAI et al. showed that with the increase of total irrigation water in the whole fertility of wheat, the water use efficiency of winter wheat showed a trend of “first rising and then falling”, and the maximum water use efficiency was obtained under the treatment of 3600m3 ha-1 [34]. The results of this experiment found that, with the reduction of irrigation water, the irrigation water use efficiency and water use efficiency of wheat generally showed an “N” trend, indicating that the water use efficiency of winter wheat is not only related to the total amount of irrigation water throughout the reproductive period but also affected by the total amount of irrigation water allocated in the whole reproductive period. DING et al. showed that the water use efficiency of winter wheat increased by 4.30% on average under water-limited irrigation compared with normal irrigation [35]. The results of this experiment showed that the irrigation water use efficiency of winter wheat increased by 52.00% under deficit-regulated irrigation treatment compared with CK. In comparison, water use efficiency increased by 40.30%, and the water use efficiency of wheat reached the maximum at 2280 m3 ha-1. This is the same as the previous results. It indicates that wheat favors the efficient use of soil moisture and irrigation water under the influence of water deficit.
Irrigation is a key measure for increasing grain yield in wheat production, especially in arid and semi-arid regions. Wheat grain yield increases significantly with increasing irrigation levels [36]. YI et al. showed that increasing the irrigation level can not only effectively improve the water content of the soil in the surface soil layer but also improve the population structure and increase seed yield by boosting the number of spikes, the number of grains in a spike, and the thousand-grain weight of wheat, which in turn improves the population structure and seed yield [37]. It has been shown that irrigation at critical wheat growth periods, such as pre-tilling, jointing, heading, and flowering, can increase the number of spikes, improve thousand-grain weight, and ultimately increase seed yield [38]. A large number of studies have shown that with the increase of irrigation water, winter wheat yield and its components (thousand-grain weight, number of spikes, number of grains in a spike) change in a consistent trend, all of them first increasing and then decreasing [39, 40]. The results of the study showed that with an increase in irrigation, the winter wheat yield constituting factors of thousand-grain weight, number of spikes, and number of grains in spikes changed in a more consistent trend. The results of this experiment showed that the deficit-regulated irrigation treatment had a significant effect on the number of spikes, the weight of a thousand grains, and the yield of wheat per hectare. With the decrease in irrigation volume, the yield and its constituent factors showed a trend of first increasing and then decreasing. This is consistent with the results of previous studies. In the present study, it was found that the yield of the A2 variety reached the maximum value of 6550.03 kg ha-1 at 3900 m3 ha-1 irrigation water. In contrast, the yield of the A1 variety reached a maximum value of 7100.04 m3 ha-1 at 4440 m3 ha-1 irrigation water. The average decrease in the number of spikes, number of grains, and weight of 1000 grains per hectare of wheat was observed in 3900m3 ha-1 irrigation water compared to that of 4980 m3 ha-1 irrigation water. The average decrease in the number of spikes, number of grains, and weight of 1,000 grains was the smallest at 2.50 percent, and the increase in yield and its components was larger at 18.37 percent under the 3900 m3 ha-1 treatment in the A2 variety compared to the A1 variety.
Conclusion
Considering the response of yield and water use efficiency of different Xinjiang winter wheat varieties to water deficit, the range of irrigation volume to achieve a high yield of the winter wheat population combined with the water-saving effect under drip irrigation water-fertilizer integration conditions in Xinjiang is 3360 m3 ha-1 to 4440m3 ha-1. The most suitable cultivars are the A2 variety, and compared with the A1 variety, the A2 variety in this range of irrigation can obtain 5733.36 kg ha-1 of seed yield and achieve the highest water use efficiency.

