

Introduction
Agrosystems are frequently subjected to various fertilizer inputs aimed at enhancing crop yield and quality, predominantly nitrogen (N) and phosphorus (P) [1]. Long-term application of chemical fertilizers results in the accumulation of available nutrients in the soil [2], potentially hindering plant productivity [3]. This practice increases farmers’ costs and heightens the risk of surface runoff contamination by N and P [4]. Furthermore, soil acidification from chemical fertilization adversely affects plant growth and may reduce crop yields. Reducing chemical fertilizer usage is crucial for improving soil properties [3]. Previous studies have indicated that decreasing fertilizer application does not negatively impact the yield and quality of wheat [5]. In contrast to conventional crop production systems, limited research has examined the effects of reduced chemical fertilizer use on soil quality, fruit yield, and quality within orchard forest ecosystems [6].
Soil quality is a multifactorial indicator that reflects the potential of soil to sustain its ecological services and productivity [7]. The Soil Quality Index (SQI) is a comprehensive measure of soil degradation, quality, and health [8, 9]. Most studies have primarily focused on assessing soil quality for only one year or one growing season [7, 10, 11], resulting in a limited understanding of the dynamic changes in soil quality through continuous evaluation. However, insufficient attention has been given to how chemical fertilizer reduction affects soil quality and its linkages to fruit yield and quality within orchard agroecosystems.
Bayberry (Myrica rubra) is widely distributed across tropical and subtropical regions globally, including countries such as China, Japan, the United States, and Brazil [12, 13]. In China, bayberry orchards span over 334,000 hectares and provide significant economic benefits to farmers [12]. Agroforestry management practices, including chemical fertilization [14] and the removal of understory vegetation, are commonly employed in bayberry orchards to enhance the growth of bayberry plants and fruit yield. However, these practices, particularly chemical fertilization, have resulted in several adverse effects on soil health and quality, such as soil acidification [2] and soil organic carbon loss [15], which undermine the sustainable development of the bayberry industry. Consequently, reducing fertilizer usage presents a viable and effective strategy to mitigate these negative impacts [4]. Nonetheless, it remains unclear how much fertilizer should be reduced and what the appropriate proportions of the essential nutrients involved are without compromising fruit yield and quality.
This study examines soil properties and evaluates soil quality after reducing chemical fertilization (N and P) in a bayberry orchard. Additionally, we assessed fruit yield and quality to explore their relationships with soil quality and health, ultimately aiming to identify the most appropriate ratio for chemical fertilization reduction. We hypothesized the following: (1) a suitable decrease in chemical fertilization does not negatively impact fruit yield and quality while enhancing soil quality, and (2) variations in soil quality are associated with changes in fruit yield and quality resulting from the reduction of chemical fertilization.
Materials and Methods
Study Site
The experiment was conducted in Huangtan Township, Wenzhou (27º73′N, 119º99′E), located in the southeastern region of China. The study site experiences a monsoonal subtropical climate characterized by an annual mean temperature of 17.1ºC and total precipitation of 1,680 mm. The site is situated at an elevation of approximately 200 m and has an average of 245 frost-free days and 2,000 hours of sunlight annually. The soil at the site has a clay loam texture derived from gneiss and is classified as Ferralsol [16].
In July 2021, we designated a section of a bayberry forest orchard for this field study. Traditional fertilization practices for these orchards involve the application of urea (450 kg ha-1), superphosphate (100 kg ha-1), and potassium sulphate (450 kg ha-1). The planting density of fruit trees is 300 trees per hectare. When fertilizing, dig a ring-shaped ditch around each fruit tree and apply the corresponding fertilizer. Typically, 20% of N fertilizer and 60% of K fertilizer were used in late May, while the remaining 80% of N fertilizer and 40% of K fertilizer were applied in June. All P fertilizers were applied in November. Furthermore, the orchard owner routinely clears the understory vegetation annually. During our study period, no additional fertilizers were applied; however, the understory vegetation was removed each year.
Experimental Design, Management Practices, and Sample Collection
The study used a randomized block design comprising 9 treatments (3 gradient levels of N fertilizer reduction × 3 gradient levels of P fertilizer reduction) with 3 replicates for 27 plots. Each plot measures 100 m2 (10 m × 10 m). Three gradient levels of N fertilizer reduction were applied with 450 kg ha-1 (N), 300 kg ha-1 (2/3N), and 150 kg ha-1 (1/3N) urea. Three gradient levels of P fertilizer reduction were applied with 100 kg ha-1 (N), 67 kg ha-1 (2/3P), and 33 kg ha-1 (1/3P) superphosphate (Table 1). All plots were applied 450 kg ha-1 potassium sulphate as K fertilizer.
In July 2021, March and July 2022, and March 2023, the chemical N and P fertilizers were uniformly applied to their respective treatment plots within 0-20 cm of the soil layer, with 50% of the application amount calculated based on plot area (Table 1). In each plot, five randomly-located soil cores (0-20 cm) separated by at least 2 m were collected and mixed thoroughly to form a composite sample. The mixed samples were air-dried at room temperature and were passed through a 2-mm sieve for soil nutrients and other properties analysis.
Analysis of Soil Chemical Properties
The soil’s chemical properties were measured following the method described by Lu [17]. In detail, soil pH was determined by a glass electrode (Mettler-Toledo, Switzerland) with a soil-to-water ratio of 1:2.5. Soil organic C (SOC) and total nitrogen (TN) were determined by wet digestion using K2CrO7 oxidation and the Kjeldahl procedure, respectively. Soil available phosphorus (P) was determined according to the procedure described by Bray et al. [18]. Soil available N was determined by the hot alkaline permanganate method.
Soil available microelement (including Si, S, Mo, B, Fe, Mn, Cu, and Zn) contents were extracted by 0.025 M DTPA solution, and the concentrations of the elements in the extractants were determined using ICP-OES (Optima 8300, PerkinElmer, Waltham, MA, USA) [19]. Exchangeable Ca and Mg concentrations were extracted by NH4C2H3O2 (pH = 7.0) and determined using ICP-OES.
Analysis of Fruit Yield and Quality
The fruit yield of bayberry in each plot was weighted and recorded between May and June every year. At the same time, the responses of chemical fertilizer reduction on bayberry fruit quality were evaluated by measuring soluble solids and titratable acidity. The content of soluble solids was determined using a portable reflectometer [20]. Titratable acidity was determined by the indicator-based titration method using 0.1 M NaOH-methylene blue indicator [21].
Calculation of Soil Quality Index
Soil quality index (SQI) was calculated using minimum datasets (MDS) and principal component analysis (PCA) methods [22]. In detail, PCA was employed to identify the indicators of MDS while minimizing the information loss [23]. The principal components having eigenvalues >1 and explaining >5% were considered [11]. Select the maximum Norm value from each group to enter the MDS [11], where the Norm value is the vector magnitude in the multi-dimensional space composed of principal components. The higher Norm value represents a more significant comprehensive load of the indicator on all principal components, indicating a richer reflection of soil quality information [7, 10]. Considering the important role of soil organic matter and N, P, and K elements in soil quality and ecological function, available N, P, and K, and soil organic matter were included in MDS [24, 25].
To eliminate the magnitudes of different soil indicators, they were transformed by the linear scoring method to score the values ranging from 0 to 1 [26].
Where StPi, Pi, min(Pi), and max(Pi) indicate the standardized index, actual observed value, maximum value observed in all samples, and minimum value observed in all samples, respectively.
Finally, the radar maps of soil quality were established using the standardized indexes [27, 28], and the coverage area reflects soil quality. SQI was calculated as follows:
Where SQI and n indicate the soil quality index and the number of indicators in MDS.
Statistical Analysis
Significant analysis was performed by SPSS 26.0 (IBM Inc., Chicago, IL, USA). Two-way analysis of variance (ANOVA) was explored to determine the significant changes in the soil’s physical and chemical properties, fruit yield and quality, and SQI. One-way ANOVA was employed to assess the differences under the same N or P fertilizer reduction level. The correlation coefficients involving the correlative relationships between SQI and fruit yield and quality were obtained using the Spearman correlation. Random forest analysis was performed to estimate the importance of soil properties for explaining SQI and fruit yield by using “rfPermute” and “A3” packages in R [29]. Structural equation modeling (SEM) was further constructed to identify how chemical fertilizer reduction affected SQI and fruit yield based on the linkages among soil available nutrient content. An adequate fit was indicated by the chi-square test (df>5; P>0.05), a low root-mean-square error of approximation (RMSEA) (<0.05), and a high goodness-of-fit index (GFI) [30].
Results
Changes in Soil Chemical Properties
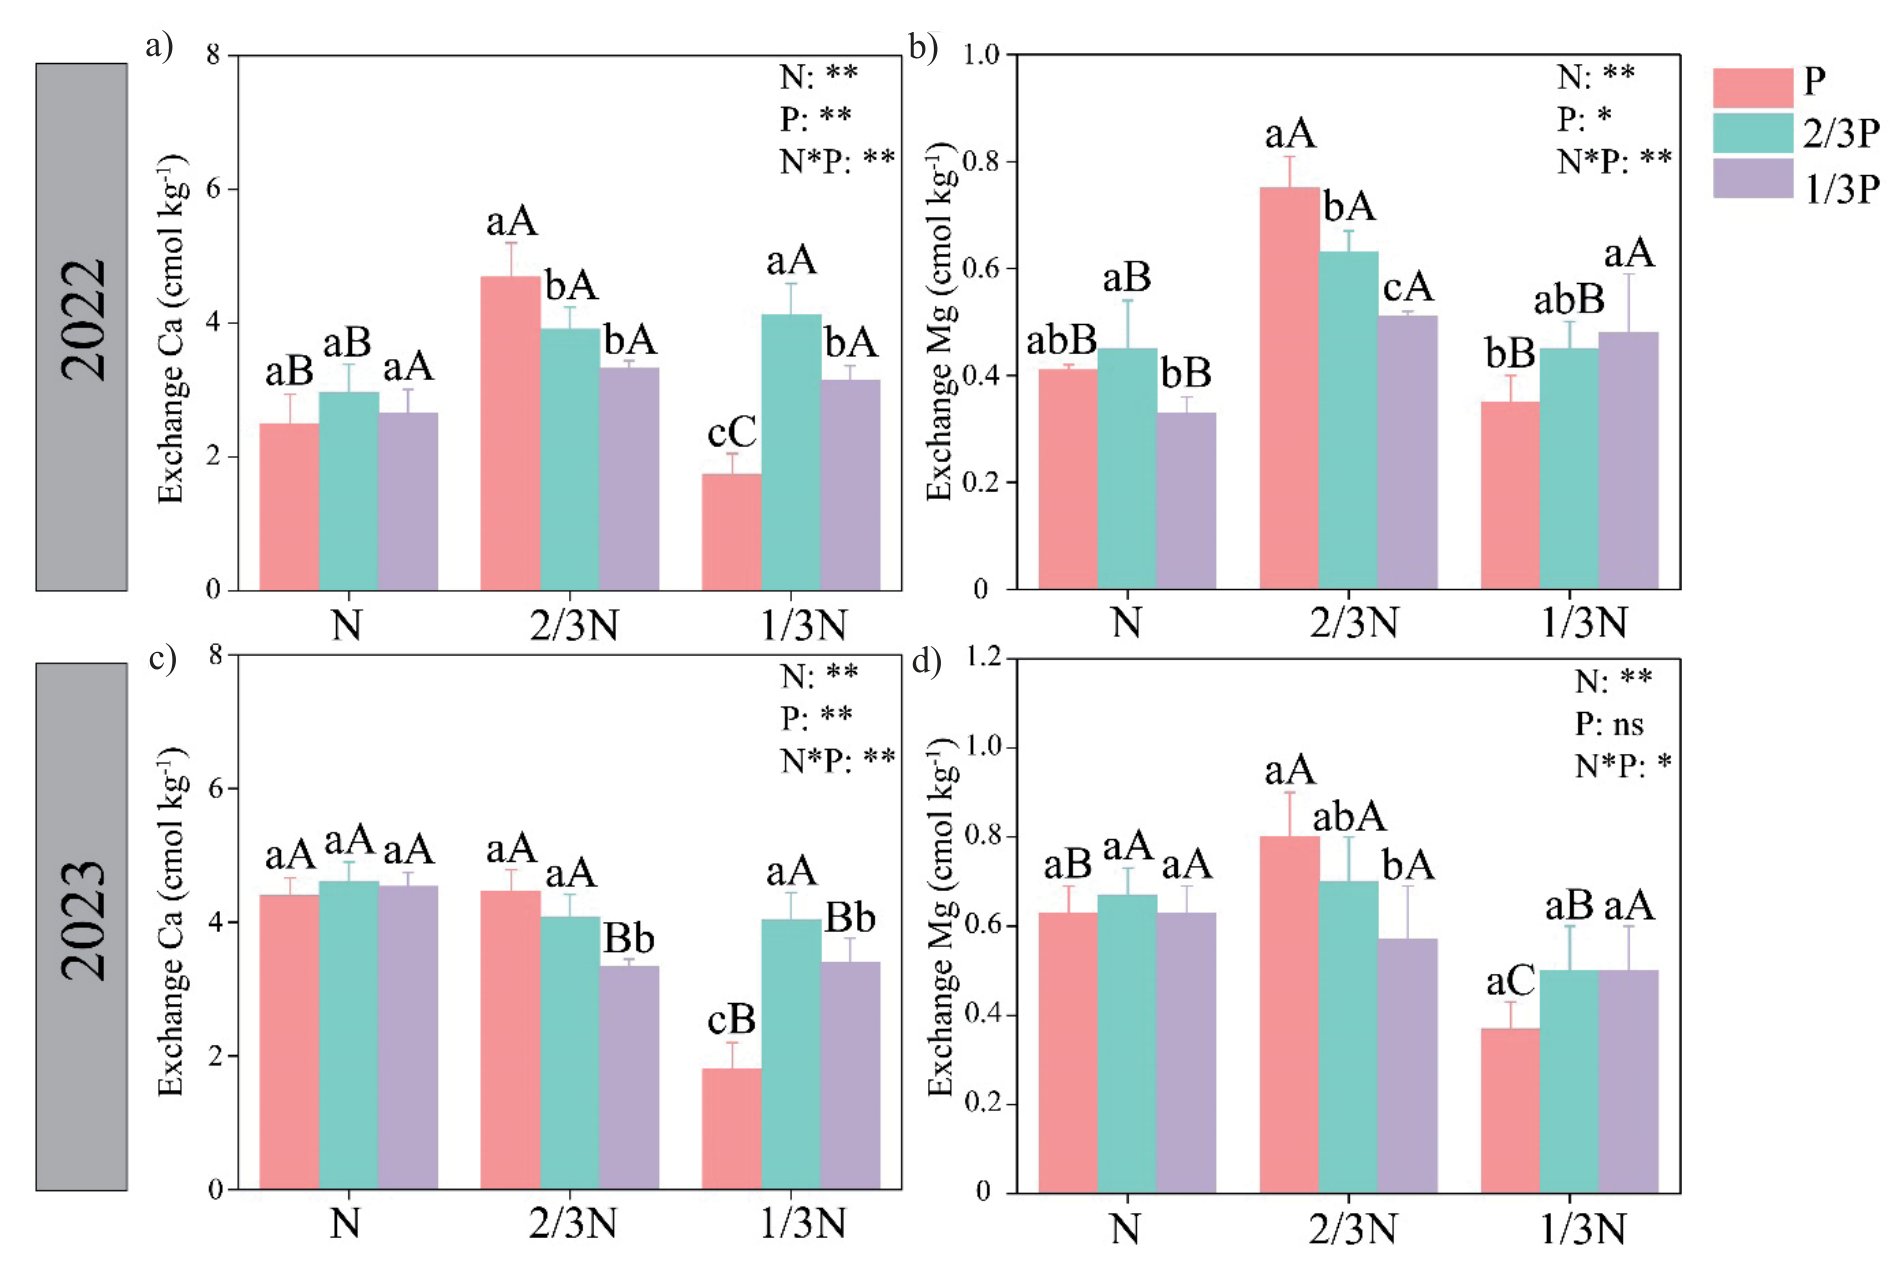
Chemical N and P fertilizer reduction significantly affected soil chemical properties, including common nutrient and micro-element contents. The reduction of N fertilizer significantly increased soil pH and organic matter and decreased available N, available P, and total N content (P<0.05, Table 2). The reduction of P fertilizer did not affect soil pH and TN, but significantly decreased soil available P and available N and increased soil organic matter (P<0.05). Additionally, the reduction of N and P fertilizers did not consistently affect soil exchange Ca and Mg in 2022 and 2023 (Fig. 1).
Compared to the N treatment, the 2/3N treatment had higher available S, Mo, Fe, Mn, Zn, and B contents (Table 3), while the 1/3N treatment had lower available Si, S, Fe, Cu, and Zn contents. Chemical P fertilizer reduction significantly increased available Si, S, Mn, Cu, and Zn contents, and there was no significant difference in available Fe and B contents (Table 3).
Changes in Fruit Yield and Quality
In 2022, the chemical N fertilizer reduction had significant effects on fruit yield and had no significant changes on fruit diameter, edible rate (Fig. 2), soluble solid and titratable acidity (Fig. 3), while the chemical P fertilizer significantly changed fruit yield and soluble solid and not impacted fruit diameter, edible rate, and titratable acidity. In 2023, compared to 1/3N treatment, N and 2/3N treatment had a higher fruit yield and titratable acidity content (Fig. 3). N fertilizer reduction did not affect fruit diameter, edible rate, or soluble solid contents. Furthermore, the chemical P fertilizer reduction did not affect fruit yield and titratable acidity contents, while only significantly increasing soluble solid contents in 1/3P treatment.
Table 2.
Changes in soil nutrient content affected by the reduction of N and P fertilization.
[i] *and ** indicated significance based on two-way ANOVA at 0.05 and 0.01 levels, respectively. Ns, no significance. Different letters in the same column indicate significant differences at the P<0.05 level. Lowercase letters denote statistically significant differences (P<0.05) in P fertilizer reduction effects on soil nutrient contents under each N fertilizer reduction levels, whereas uppercase letters represent N fertilizer reduction impacts under each P fertilizer reduction levels.
Fig. 1.
Soil exchange Ca (a and c) and Mg (b and d) contents and their response to chemical fertilizer reduction in 2022 and 2023. Lowercase letters denote statistically significant differences (P<0.05) in P fertilizer reduction effects on soil nutrient contents under each N fertilizer reduction levels, whereas uppercase letters represent N fertilizer reduction impacts under each P fertilizer reduction levels.
Changes in Soil Quality Indexes
In this study, the eigenvalue of PC1-PC6 was >1, and cumulatively explained the variance of 82.442% in the whole data using PCA analysis (Table 4). The soil pH, soil organic matter, bulk density, moisture, exchange Mg, and available N, K, P, Mn, and B were selected as important soil quality evaluation indicators by using MDS and PCA analysis (Fig. 4). Compared to the N treatment, the SQI significantly improved under the 2/3N treatment in 2022 (P<0.05), while there is no significant difference between the N treatment and the 2/3N treatment in 2023 (Fig. 4g) and h)). In both 2022 and 2023, compared to the N treatment, the SQI largely decreased under the 1/3N treatment. The reduction of chemical P fertilizer had no significant impacts on SQI in 2022 and 2023 (P>0.05).
The Relationships between Soil Chemical Properties, Soil Quality, and Fruit Quality
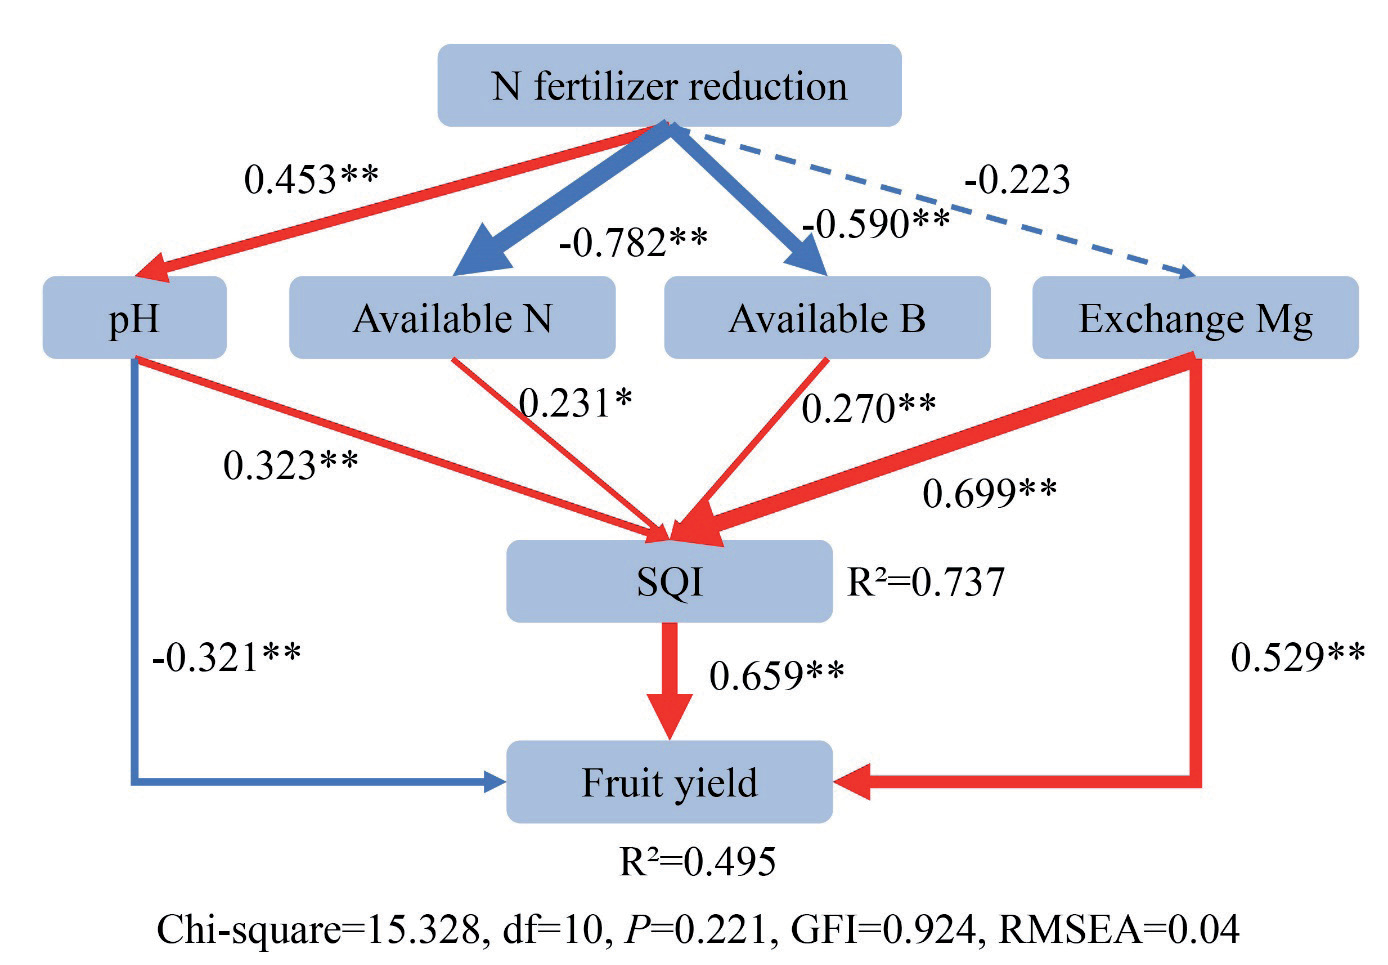
The SQI was strongly and positively correlated with fruit yield in both 2022 and 2023 (Fig. 5a)). The SQI had no significant correlations with the fruit quality, including soluble solids and titratable acidity in 2022 and 2023, as expected for SQI and fruit titratable acidity exerting a close correlation (Fig. 5b) and c)). Random forest analysis showed that soil chemical properties (including exchange Mg, moisture, available N, soil organic carbon, available K, pH, available Mn, available B, and available P) were significantly important for SQI variation. All the indicators explain 73.4% of the SQI variation. Furthermore, soil pH and SQI showed the highest importance for fruit yield variation, followed by available N, exchange Mg, and available K. All the indicators explain 49.8% of the fruit yield variation. The SEM proved a good fit to the data (Chi-square = 15.328, df = 10, GFI = 0.924, RMSEA = 0.04) and accounted for 73.7% of the variation in SQI, and 49.5% of the variation in fruit yield (Fig. 6). According to the model, the chemical N fertilizer reduction significantly and directly influenced soil pH, available N, and available B. SQI was affected by soil pH, available N, available B, and exchange Mg. Moreover, fruit yield is impacted by soil pH, exchange Mg and SQI.
Table 3.
Changes in micro-elements (including Si, B, Mo, Fe, Mn, Cu, Zn) content in the bayberry orchard in 2022 and 2023.
[i] *and ** indicated significance based on two-way ANOVA at 0.05 and 0.01 levels, respectively. Ns, no significance. Different letters in the same column indicate significant differences at the P<0.05 level. Lowercase letters denote statistically significant differences (P<0.05) in P fertilizer reduction effects on micro-elements contents under each N fertilizer reduction levels, whereas uppercase letters represent N fertilizer reduction impacts under each P fertilizer reduction levels.
Fig. 2.
Impacts of chemical fertilizer reduction on fruit yield (a and d) and quality, including fruit diameter (b and f) and edible rate (c and f) within a bayberry orchard in 2022 and 2023. Lowercase letters denote statistically significant differences (P<0.05) in P fertilizer reduction effects on soil nutrient contents under each N fertilizer reduction levels, whereas uppercase letters represent N fertilizer reduction impacts under each P fertilizer reduction levels.
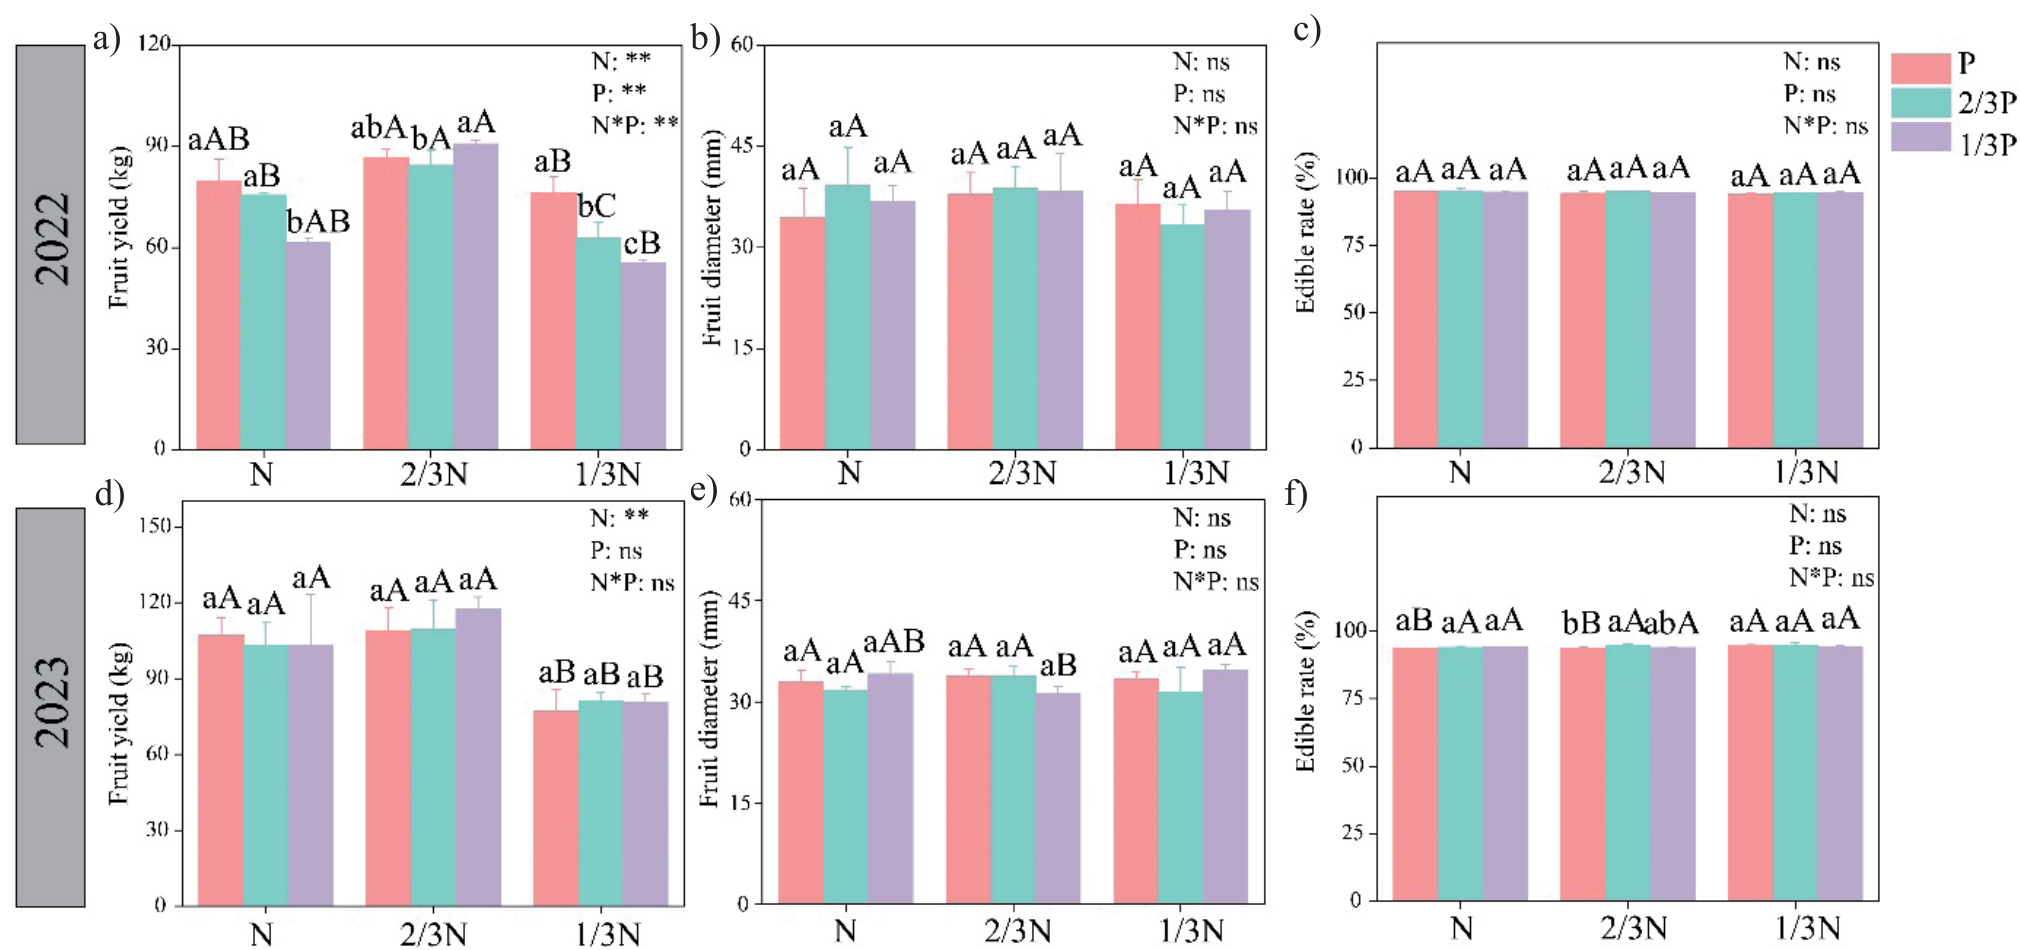
Fig. 3.
Impacts of chemical fertilizer reduction on fruit quality, including soluble solid (a and c) and titratable acidity (b and d) within a bayberry orchard in 2022 and 2023. Lowercase letters denote statistically significant differences (P<0.05) in P fertilizer reduction effects on soil nutrient contents under each N fertilizer reduction levels, whereas uppercase letters represent N fertilizer reduction impacts under each P fertilizer reduction levels.
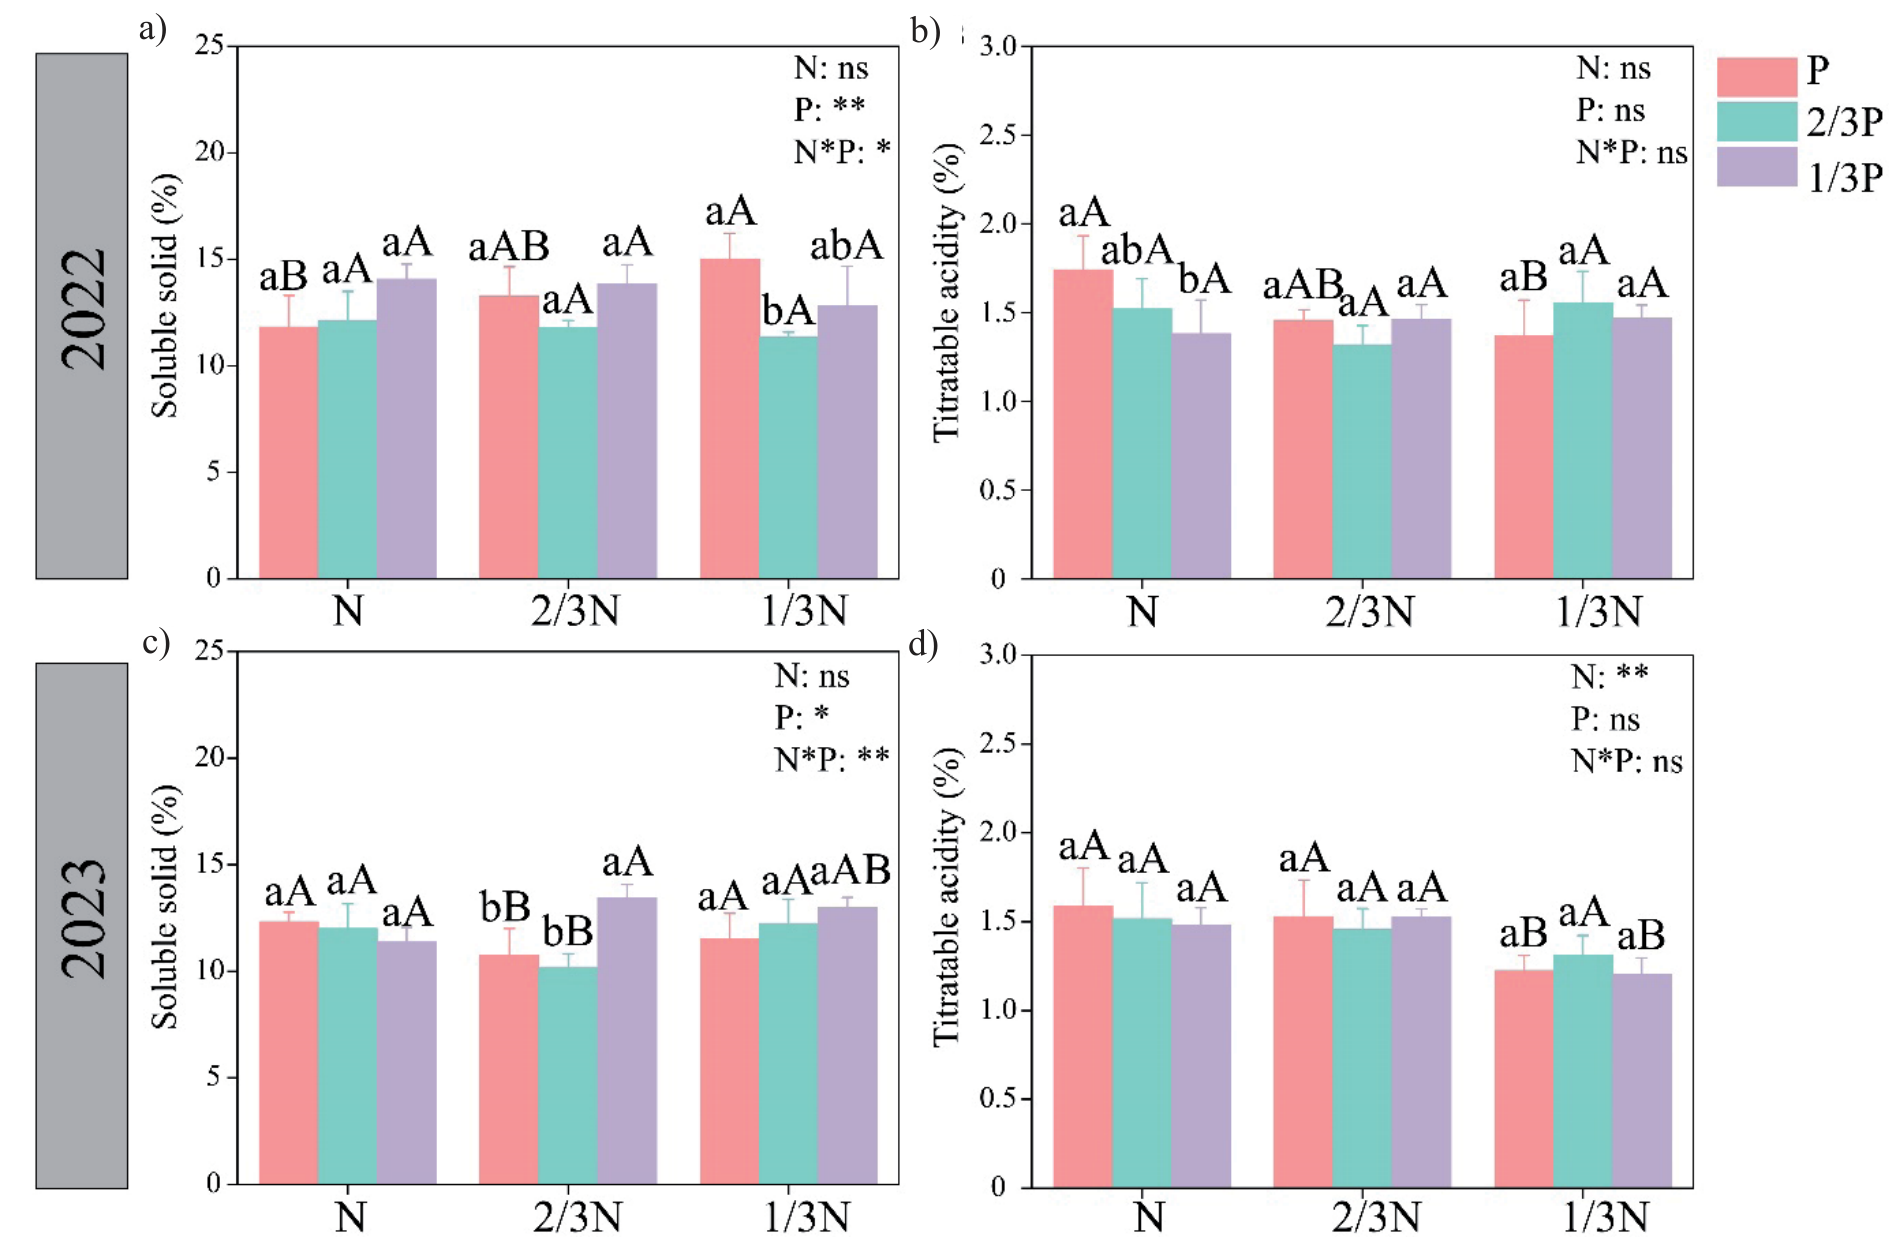
Table 4.
Load matrix and Norm value of each soil property with principal component (PC) analysis.
Discussion
The Reduction of N and P Fertilization Affected Soil Available Nutrient Contents and Improved Soil Quality in the Bayberry Orchard
Our results showed that chemical N fertilizer reduction increased soil pH (Table 2). Consistent with previous studies [2, 15], applying chemical N fertilizer significantly decreased soil pH due to ammonium-based fertilizers that release hydrogen ions when converted to nitrate by soil microorganisms. We further found that reducing chemical fertilizer enhanced soil organic matter (Table 2), possibly due to improved greenhouse gas emissions and organic carbon mineralization caused by long-term chemical fertilization [31, 32]. In addition, the reduction of chemical fertilizer significantly decreased soil available N and P (Table 2), indicating that long-term fertilization resulted in the accumulation of available nutrients in the soil with low efficiency of nutrient use [33]. The 2/3N treatment increased the availability of Mg, Ca (Fig. 1), and micro-elements (Table 3). This phenomenon could be explained by the enhancement of soil pH [34], while there was no additional corresponding macro- and micro-elements input to the soil. Additionally, the input of inorganic P may largely affect the availability of Mg, Ca, and microelements due to the association of PO43- and metal ions [35].
This study developed a comprehensive SQI by integrating key soil property indicators to systematically evaluate the effects of reducing chemical N and P fertilizer application on soil quality. We illustrated that soil pH, organic matter, bulk density, moisture, exchangeable Mg, and available N, P, K, Mn, and B from the whole data set, as the MDS could be used to evaluate soil quality under different chemical fertilizer reduction levels (Fig. 3). The results of SQI were higher with 2/3N applied treatment and lower within 1/3N applied treatment, compared to the whole N applied treatment (Fig. 3g) and h)). Consistent with previous studies [7, 36], long-term chemical fertilization resulted in soil degradation, and appropriate reduction of chemical fertilizer would improve soil quality. Nevertheless, it should be noted that the SQIs under 1/3N treatment were significantly decreased, which indicated it also had some negative effects on soil quality (Fig. 3). This may be due to the limited input of N and the inability to meet the demand for plant uptake [27]. Therefore, the effects of chemical N fertilizer reduction on soil quality depend on the reduction rates. It is recommended to combine with organic fertilizers or return straw to the soils [37] if a significant reduction of chemical N fertilizer is required.
Fig. 4.
Radar map of soil quality under chemical fertilizer reduction practices in 2022 (a, b, and c) and 2023 (d, e and f); and soil quality index (SQI) (g and h) response to chemical fertilizer reduction practices. Lowercase letters denote statistically significant differences (P<0.05) in P fertilizer reduction effects on soil nutrient contents under each N fertilizer reduction levels, whereas uppercase letters represent N fertilizer reduction impacts under each P fertilizer reduction levels.
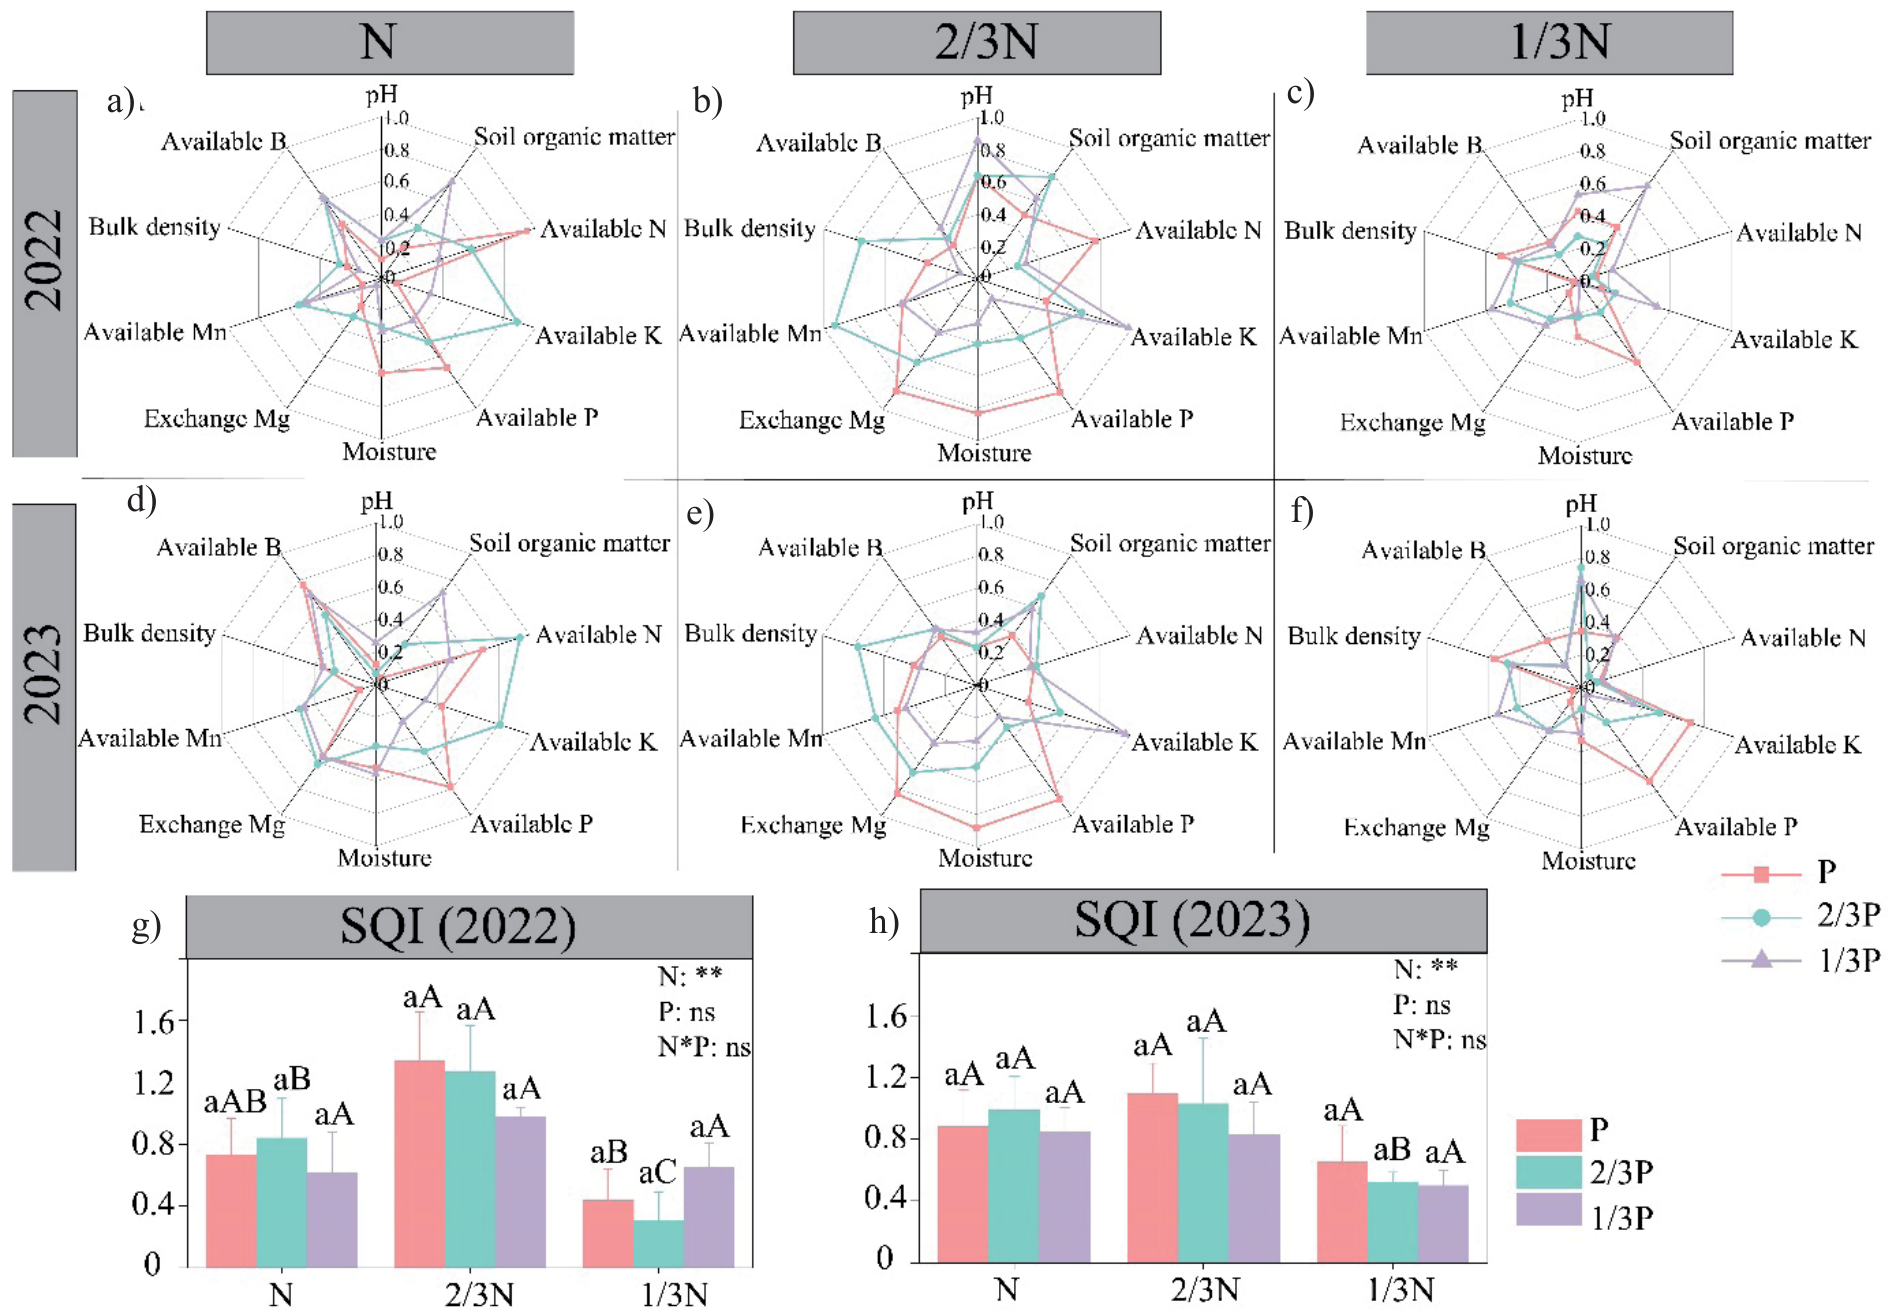
Fig. 5.
Correlation analysis of soil quality index (SQI) with fruit yield (a) and quality (b and c) in a bayberry orchard; random forest model of SQI (d) and fruit yield (e) with soil properties.
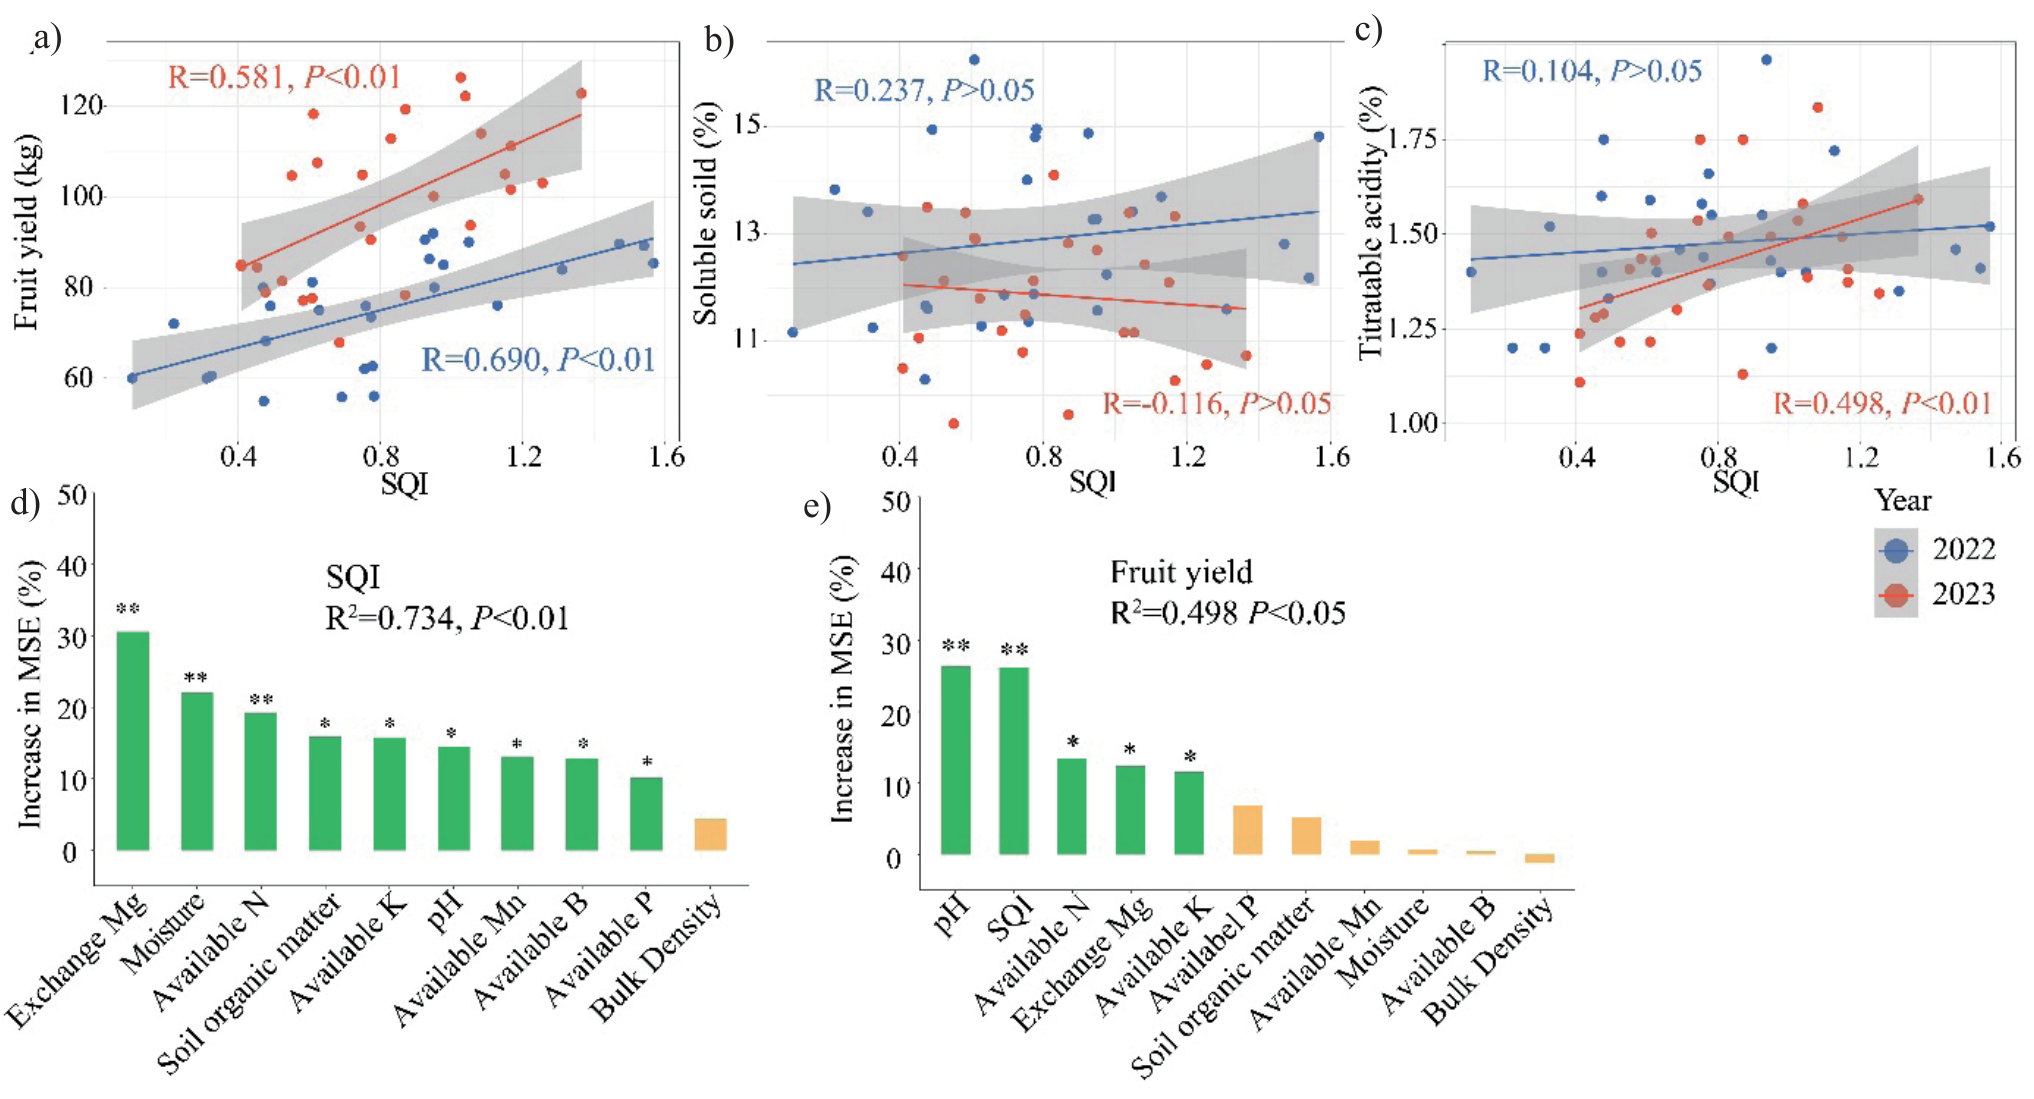
Fig. 6.
Structural equation model (SEM) illustrating relationships between soil properties (pH, available N, available B, and exchange Mg), soil quality index (SQI), and fruit yield. Red and blue lines indicate positive and negative effects, respectively. Correlation coefficients and significant level (*, P<0.05; **, P<0.01) are shown with lines.
Furthermore, reducing P fertilizer did not affect soil quality (Fig. 3). This could be attributed to the weaker effects of chemical P fertilizer reduction on soil nutrients and chemical properties than the reduction of N chemical fertilizer (Table 2). Additionally, compared to the availability of P in southeast China [38], the available P contents in the bayberry orchard were relatively high; thereby, the reduction of P fertilizer did not affect soil quality. Notably, the differential mobility of N and P in soil systems may also explain their contrasting impacts: N losses via leaching or volatilization can rapidly deplete soil N pools, whereas P tends to remain sequestered in less labile forms, buffering against abrupt changes in availability [38]. The reduction of chemical N fertilizer, rather than that of chemical P fertilizer, drove the changes in soil quality.
The Appropriate Reduction of Chemical N and P Fertilization did not Decrease Bayberry Yield and Quality
In the present study, the appropriate reduction of chemical N and P fertilization did not decrease fruit yield and quality in a bayberry orchard (Fig. 2). Firstly, this could be explained by the improvement of soil pH. It is well documented that soil pH is an important factor affecting plant growth [39, 40], with a low pH reducing plant resistance to diseases [41], as well as root growth, which is detrimental to fruit yield and quality. This mechanism could be evidenced by the SEM and random forest model (Fig. 4 and 5). Moreover, a global meta-analysis showed that the average N-use efficiency was only 39% [42]. In long-term fertilized systems, residual soil N often accumulates, creating a buffer that sustains plant growth even with reduced inputs. Thus, the N was not the limiting factor of fruit yield and quality in long-term fertilized agroecosystems. Additionally, the availability of Mg, Ca, and microelements enhanced under 2/3N treatment could support fruit yield and quality. Li et al. [43] reported that the content of microelements could be the limiting factor of plant growth. Mg is integral to chlorophyll synthesis and photosynthetic efficiency, while Ca strengthens cell walls and prolongs fruit postharvest quality [44]. Micronutrients like Zn and Fe, which act as enzyme cofactors, may have bolstered metabolic processes critical for fruit development. The results of SEM supported the idea that available B had a significant contribution to fruit yield (Fig. 6). Furthermore, plants in N-reduced systems may activate stress-responsive pathways, elevating the synthesis of secondary metabolites (e.g., phenolics, anthocyanins) that improve fruit antioxidant capacity and color [45]. Balanced micronutrient supply [44] under reduced N can sustain or even improve quality by alleviating hidden hunger. Thus, strategic N reduction aligns with “less is more” agronomy, where precision in nutrient delivery – rather than quantity – drives quality outcomes.
Soil quality, an indicator of sustainable soil management, can help sustain biological productivity, maintain environmental quality, and promote plant and animal health [36]. Our results showed that SQI was an important driving factor in fruit yield (Fig. 5). The high positive correlation that typically exists between soil quality and crop yield [46, 47] allowed us to evaluate the accuracy of assessment methods [28]. Our results revealed that there was a positive and significant correlation between fruit yield and SQI (Fig. 4), which indicated that PCA analysis and the MDS method could be used to assess soil quality in a fruit orchard with chemical fertilizer reduction practice. These results were similar to those of Cheng et al. [48] and Chen et al. [49] in the navel orange production systems of the red soil region of China and the agricultural land management systems of Northeast China, respectively. However, the threshold of N reduction warrants careful consideration. While moderate reductions (e.g., 33.3% in our study) preserved yield, steeper cuts might risk inducing nutrient deficits, particularly in high-demand growth stages [15]. Site-specific factors, including soil type, climate, and crop genotype, further modulate these outcomes. Thus, dynamic SQI monitoring, coupled with real-time nutrient diagnostics, is essential for tailoring fertilizer regimes to local conditions. Overall, our study suggested that the appropriate chemical N fertilizer reduction did not decrease fruit yield and quality by improving soil quality and soil chemical properties in a subtropical bayberry orchard.
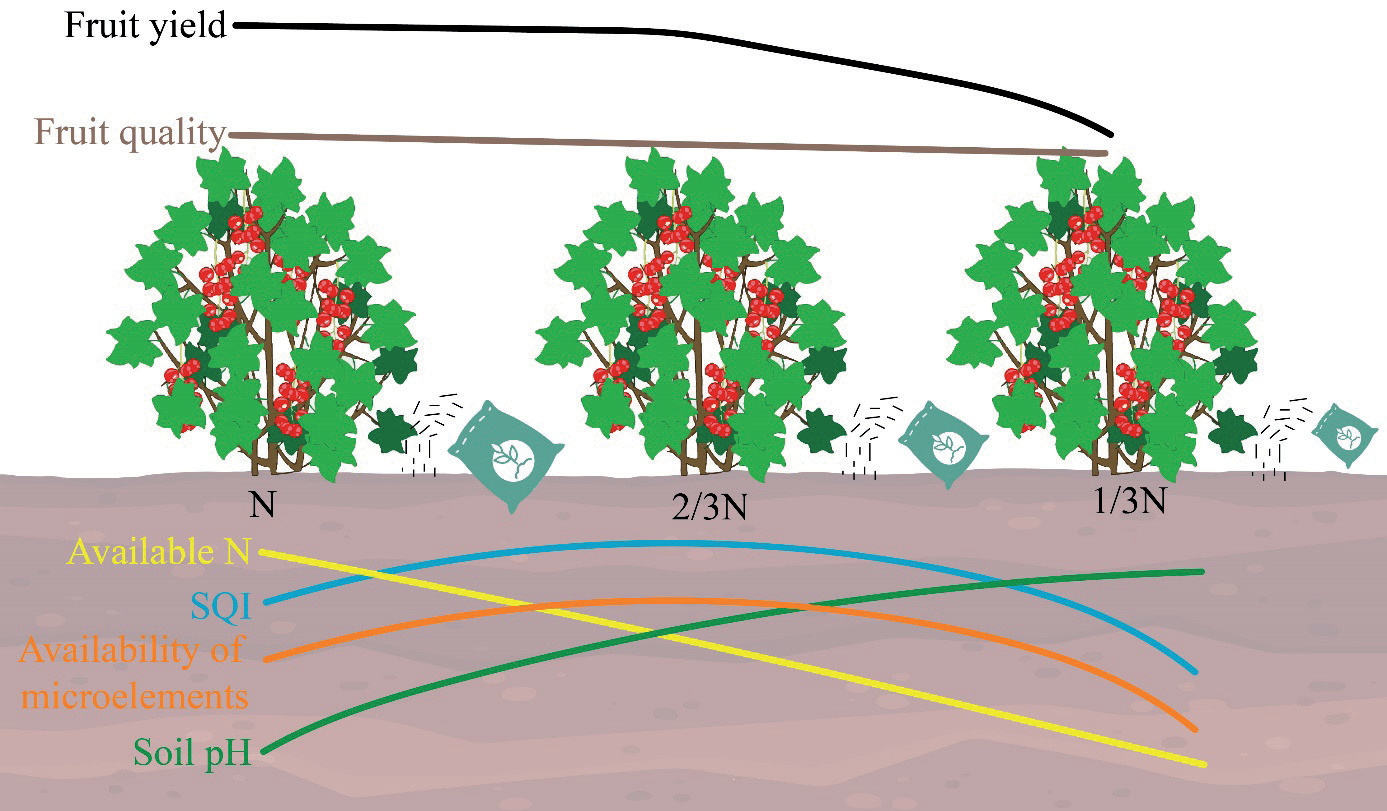
Conclusions
Our results showed that chemical fertilizer reduction significantly increased soil pH and microelement availability in a subtropical bayberry orchard. The appropriate reduction of N fertilization (2/3N) did not decrease bayberry yield and quality, while it increased the soil quality index (SQI) through the 2-year field experiments. However, the 1/3N treatment (two-thirds N reduction (Fig. 7)) unexpectedly decreased SQI, highlighting the non-linear relationship between fertilization intensity and soil health. The reduction of chemical P fertilizer had no significant effects on SQI and fruit quality. Furthermore, SQI was mainly driven by the availability of nutrients and soil pH, while fruit yield was driven primarily by SQI and soil pH. These results deepen our understanding of the effects of chemical fertilizer reduction on soil properties, fruit yield and quality, and soil health, as well as reveal the role of chemical fertilizer reduction in the sustainability of agriculture and forestry.

