


Introduction
Sorghum [Sorghum bicolor (L.) Moench], belonging to the family Poaceae, once grew wild before it was cultivated as food and feed for humans and animals. It was cultivated in Africa for more than 2000 years prior to European colonization, and subsequently spread to Asia and various parts of the western hemisphere through captive slaves [1]. Presently, sorghum is one of the major food cereal crops, which ranks fifth after rice, wheat, maize, and barley in terms of importance and production. It constitutes the main food grain for over 750 million people who live in the semi-arid tropics of Africa, Asia, and Latin America [2]. More than 70% of the world’s total production of sorghum comes from developing countries in Asia and Africa, where the crop is the mainstay of resources and technology-poor farmers, and is grown with limited inputs of water and nutrients. As a result of being relatively tolerant to heat and drought, sorghum constitutes an integral component of agricultural production throughout Africa [3].
In Bangladesh, sorghum is considered as a minor cereal which provides staple food for the poor class people living in the dry tracts of the country. It is also used as animal feed. In Bangladesh, 3200 metric tons of sorghum grains are produced annually from about 4000 ha of land, and the average yield is 3.6 metric tons per hectare [4]. Farmers of Bangladesh are interested in growing major cereals in their fresh soil for food security of the over-increasing population [5], and hence minor cereals move forward to the problem soils, including high-salinity, and drought-prone areas. Salinity problems are increasing gradually in the world, including Bangladesh, with global climate change progressively affecting the cropping systems, which will pose serious intimidations for global food production [5]. Saline soils are those soils with higher levels of soluble salts, such as sodium, calcium, magnesium, and potassium-containing sulfates (SO4), carbonates (CO3), and chlorides (Cl), and among them, sodium chloride (NaCl) has the highest negative effect on the plant growth and development. Soils contaminated with salts (EC>4 dS m-1 or 40 mM NaCl or osmotic potential <0.117MPa) are defined as saline land, which directly affects all stages of plant growth and development [6, 7]. Salinity affects plant growth, development, and productivity by imposing hyperosmotic and oxidative stresses, ion toxicity, and nutrient deficiency [7, 8].
Rapid seed germination and subsequent seedling establishment are important factors determining crop production and yield under salinity stress [9]. Salinity causes slow seed germination, and consequently restricts root development, reducing growth, development, and finally yield of crops [10]. The salinity problem in agricultural areas is continuously and rapidly increasing day by day as a result of the inappropriate and unconscious management of important agricultural practices [11]. Therefore, several cultural and crop management strategies should be considered to increase agricultural productivity in salinity-affected areas. For this purpose, it is important to reveal the effects of salinity and genotypic variation, especially during the germination and seedling development stages, and to improve the salinity tolerance of some economically important crops.
High genotypic variation for salt stress was reported in many studies on different plant species [7, 9-12]. High genetic variation for salt tolerance among sorghum genotypes that are generally tolerant to abiotic stresses such as drought and salinity was reported [13- 14]. It is important to reveal the genetic variations to determine the most tolerant genotypes to salinity, and in this context, the determination of plants’ response to salinity, especially during the germination and seedling stages, is important to obtain optimum yield under salinity-affected areas. Sorghum is characterized as moderately tolerant to salinity [15, 16]. Therefore, sorghum can be grown in the vast saline-affected area in Bangladesh. Unfortunately, no recognized varieties are available in Bangladesh, and it is treated as a much-neglected crop here. Almost no previous research has been done regarding this issue. Therefore, the current study was conducted to assess the tolerance level of sorghum varieties to salt through germination and seedling growth under a saline stress environment, and to compare sorghum varieties, salinity stress and select the most tolerant and susceptible ones.
Experimental
Location and Period of the Experiment
A Lab experiment was conducted at the Department of Agronomy, Hajee Mohamad Danesh Science and Technology University (HSTU), Dinajpur Bangladesh during the period from 11-25 October 2018, to investigate the effect of salinity on germination and seedling growth on seven varieties of sorghum.
Experimental Treatments, and Design
The treatments consisted of two factors, viz. Factor B: Three levels of salinity (0, 100, and 200 mM of NaCl), and Factor A: Seven varieties of sorghum (Debuday, Jambo, Green Jambuplus, Karmici, Adan Gab, ESP/S01, Elmi Jama). The experiment was laid out in a completely randomized design (CRD) with four replications.
Pot Preparation and Seed Collection
Clean and dry plastic trays (20 cm x 10 cm) were filled with sand. The sand was sterilized with the sun, and the inert materials, visible insect pests, and plant propagates were removed. The seeds of different varieties were collected from India (Debuday, Jambo, and Green Jambuplus), and Somalia (Karmici, Adan Gab, ESP/S01, and Elmi Jama).
Sowing of Seeds
Seeds of all sorghum genotypes were sown in plastic trays on 11-25 October/, 2018. Seed sowing was done by maintaining an equal distance between two seeds, and 100 seeds per tray were used.
Salinity Development
The salt solution was prepared artificially by dissolving a calculated amount of commercially available NaCl with tap water to make 100 and 200 mM NaCl solution. The salt solution was applied as per the treatment specification. The similar moisture content of each tray was maintained by adding water to control trays every day.
Data Recorded on Germination Characters
Germination Percentage (%)
Germination was counted at 24-hour intervals and continued up to the 14th day after sowing. Finally, the germination percentage was calculated by using the following formula:
Data Recorded in Seedling Growth
Shoot and Root Length (cm)
Shoot and root length were recorded at 14 days after sowing. Ten seedlings were carefully uprooted randomly out of all the seedlings grown from all pots of each treatment with the help of a knife. The uprooted seedlings were washed with tap water, and excess water was soaked with tissue paper. Shoot and root portions were separated with the help of scissors. Shoot and root lengths (cm) were measured, and the mean lengths (cm) were calculated as per treatment combination.
Salt Tolerance Index (STI)
The salt tolerance index was calculated as [18] using the following formula:
Table 1.
Germination percentage of sorghum varieties as influenced by salt stress.
Determination of Na and K ions
The plant material, dried in the oven at 80ºC to constant weight, was finely ground and digested with a nitric-perchloric mixture. In the mineral extract the contents of Na+ and K+ were determined by emission spectrophotometry by atomic absorption spectrophotometry [19].
Results and Discussion
Germination Characteristics
Germination Percentage
Salinity caused considerable delay and reduction in seed germination. The germination percentage (GP) of different sorghum varieties drastically reduced and genotype showed dissimilar results with increasing salt stress (Table 1). The maximum GP (85.33%) was recorded in the variety of Debuday, while the lowest (66.67%) was recorded in the variety of Karmici at the control condition. At 100 mM NaCl salinity level, the maximum reduction in GP (35.99%) was found in Karmici, and the minimum reduction (16.40%) was found in Debuday which was followed by the varieties of Green Jambuplus and Elmi Jama (21.51 and 22.21%, respectively). Again, a high salinity level (200 mM NaCl) severely reduced the GP of all sorghum varieties. The maximum reduction (47.99%) was noted in Karmici, whereas the minimum reduction (28.89%) was noted in Debuday compared to the control condition. It is indicated that the GP decreased significantly with the increasing salinity levels. It affects germination in two ways: there may be enough salt in the medium to decrease the osmotic potential to such a point as to retard or prevent the uptake of water necessary for the mobilization of nutrients required for germination, and the salt constituents or ions may be toxic to the embryo.
The results of this experiment also agreed with the results of previous researchers of sorghum [22-25], and of maize [26, 27]. Our results follow Rejili et al. [28], who observed a decrease in the germination percentage of Lotus creticus that resulted from the osmotic effect of salts present in the growth medium. Salt stress reduces the GP primarily by lowering the osmotic potential of the soil solution to impede water absorption by seeds satisfactorily, by causing sodium and/or chloride toxicity to the embryo, or by altering protein synthesis. A similar conclusion was drawn by Farsiani and Ghobadi [26] in maize cultivars. It is well known that germination is the most sensitive time to salinity during the development of plants.
Germination Rate
A general reduction of germination rate (GR) due to salinization was observed in all the varieties (Table 2). The maximum GR (30.93%) was documented in the variety of Debuday though the lowest (19.03%) was documented in the variety Karmici under control conditions. Moreover, at 100 mM NaCl salinity level, the maximum reduction of GR (27.32%) was recorded in Karmici followed by ESP/S01 (15.55%). In contrast, the minimum reduction (4.39%) was observed in Debuday. At high salinity levels (200 mM NaCl), the GR was severely reduced in all sorghum varieties. The maximum reduction (31.42%) was noted in Karmici, although the minimum reduction (10.66%) was recorded in Debuday over the control condition. The reduction in germination rate is due to the toxic effects of certain ions, and also higher concentration of salt reduces the water potential in the medium, which hinders water absorption by germinating seeds and thus reduces the germination rate. Many studies have shown that increased salt concentration reduces germination rate, in several sorghum genotypes [14, 29-31] in sorghum, and other crops such as wheat [32], maize [33], black gram [34], and mung bean [35]. Poor seedling emergence due to salt stress might be caused by the weakness of hypocotyls. High concentrations of NaCl inhibit germination rate due to the effects of high osmotic potential and specific ion toxicity due to higher accumulation of Na+ and Cl- ions [36].
Table 2.
Germination rate of sorghum varieties as influenced by salt stress.
Seedling Growth
Root Length (cm)
Salinity caused a significant reduction in the root length of sorghum genotypes (Table 3). The root lengths treated with 100 mM NaCl stress were significantly reduced over control, and greater subsequent reduction was with 200 mM salt stress for all the varieties. However, the highest root length (9.51 cm) was obtained in Debuday, but the lowest (5.15 cm) was obtained from Karmici under control conditions.
At moderate salt stress (100 mM NaCl), Debuday, ESP/S01, Adan Gab, Green Jambuplus, Elmi Jama, and Jambo showed less than 50% eduction of root length. On the other hand, only the variety Karmici showed more than a 50% reduction in root length, but Debuday showed less than a 50% reduction at high salt stress (200 mM NaCl). In this study, the lowest reduction of root length (40.79 and 49.52%) was witnessed in Debuday, and the highest (54.56 and 70.67%) was witnessed in Karmici at 100 and 200 mM NaCl concentrations, respectively. It is reported that root growth is sensitive to high salt concentrations in the growth due to being the first developing organ in the plant. That is why root lengths are rapidly reduced or prevented by salinity [22, 23, 30, 37, 38]. These findings are in agreement with other researchers [39-41], who observed that the increase in NaCl concentrations decreased the shoot and root length and biomass of all the wheat cultivars tested in their study.
Shoot Length (cm)
The highest shoot length (25.10 cm) was observed in Debuday, and the lowest (17.87 cm) was observed from Karmici under the control conditions (Table 4). Salinity gradually decreased with the increasing salinity levels. Furthermore, at moderate salt stress (100 mM NaCl) Karmici exhibited more than 45% reduction of shoot length, whereas Debuday, Jambo, Green Jambuplus, Adan Gab, and Elmi Jama reduced less than 45%. At high salt stress (200 mM NaCl), Karmici, Jambo, Green Jambuplus, ESP/S01, Adan Gab, and Elmi Jama showed more than 60% reduction in shoot length followed by Debuday exhibited only a 58.12% reduction. In this study, the lowest reduction of shoot length (31.51 and 58.12%) was perceived in Debuday, and the highest (49.24 and 75.13%) was documented in Karmici at 100 and 200 mM NaCl concentrations, respectively. Salinity reduces shoot growth by suppressing leaf initiation and expansion, as well as internode growth, and by accelerating leaf abscission [42, 43]. This result is consistent with the preceding findings in sorghum [23, 30, 31] and in wheat cultivars [41], where it has been reported that the increase in NaCl concentrations decreased the shoot and root length, and biomass tested in those studies. The germinated seeds in saline mediums have reduced shoot length and NaCl-induced salt stress has an inhibitory impact on the emergence of embryonic tissues [44]. The decrease of water potential at the germination medium due to salinity increases the rate of toxicity [8], which might have declined the shoot length. It has been ascribed that salt stress during germination leads to the production of a large amount of reactive oxygen species, damage to cell structures and components such as proteins, DNA, and lipids, and destruction of biofilm structure [45] which may be promoted to inhibit plant height.
Table 3.
Root length of sorghum varieties as influenced by salt stress.
Table 4.
Shoot length of sorghum varieties as influenced by salt stress.
Root Fresh Weight (g)
Significant variation of shoot fresh weight among treatments of all the sorghum varieties was found when grown under normal and saline conditions. Due to the increase in salinity, shoot fresh weight decreased significantly for all the sorghum varieties (Table 5). Under 100 mM saline condition, the maximum reduction of shoot fresh weight (58.06%) was documented in Karmici, whereas the minimum reduction (24.13%) was documented in Debuday. Under 200 mM saline condition, the maximum reduction (64.51%) was recorded in Karmici followed by Jambo (62.84%), showing more susceptible varieties. Contrarily, the minimum reduction was observed in Debuday (37.93%), followed by Adan Gab (40.29%) and Elmi Jama (40.81%). Moreover, the effect of salt stress at 200 mM NaCl concentration on root fresh weight was different among varieties. Similar results were reported in sorghum [46] and barley [47].
Table 5.
Root fresh weight of sorghum varieties as influenced by salt stress.
Table 6.
Shoot fresh weight of sorghum varieties as influenced by salt stress.
Shoot Fresh Weight
Shoot fresh weight of sorghum varieties was significantly inhibited by the salinity, but the trend of inhibition at 100 and 200 mM saline treatments was not similar for all varieties (Table 6). However, Karmici, ESP/S01 and Adan Gab revealed more than 40% reduction, while Debuday, Green Jambuplus, Elmi Jama, and Jambo revealed less than 40% reduction at 100 mM saline treatment as compared to control. At 200 mM NaCl, Karmici, Elmi Jama, Jambo, Green Jambuplus, ESP/S01, Adan Gab reduced more than 50% shoot fresh weight, but Debuday reduced less than 50%. Debuday exposed the lowest reduction (32.63 and 48.42%) and Karmici exposed the highest reduction (47.82 and 62.32%) under 100 and 200 mM salinity levels, respectively. It has been reported that salt stress caused a significant decrease in fresh and dry weights of shoots of of sorghum genotypes [48, 49].
Root Dry Weight (g)
It was evident that there was a significant variation in the root dry weight among treatments in all sorghum varieties (Table 7). The heaviest root dry weight (0.072 g plant-1) was obtained in Debuday although the slightest (0.028 g plant-1) was obtained in Karmici under control conditions. At moderate stress (100 mM NaCl) Karmici, Adan Gab, ESP/S01, Jambo, Green Jambuplus, and Elmi Jama showed more than 40% reduction, whereas Debuday showed less than 40% reduction of root dry weight. At high stress (200 mM NaCl) Karmici, Adan Gab ESP/S01, Green Jambuplus, Jambo, and Elmi Jama reduced more than 50% of root dry weight, but Debuday reduced less than 50% of root dry weight over the control. Salinity reduced the root growth (root length; Table 3 and fresh weight; Table 5), resulting in reduced root dry weight. Reduction in dry weight of plant tissues reflects the increased metabolic energy cost and reduced carbon gain, which are associated with salt adaptation. It also reflects salt’s impact on tissues, and reduction in photosynthetic rates per unit of leaf area [50]. This result is in accordance with the result of Kausar et al. [22] in sorghum, Cicek and Cakirlar [49] in sorghum cultivars. The root is the first developing organ, and is sensitive to salt stress as compared to the shoot, and the result of root growth in our experiment is supported by the results of Kausar et al. [22], Sarker et al. [23], who reported that root is a very sensitive organ to increasing levels of salinity. It has been depicted that salt stress reduces the availability of O2, which deprives the plants from an energy source and accumulates high levels of ethylene that inhibits root growth (Akram et al. [51]), and this might be the reason for lower root dry weight in this study. Nonetheless, Debuday produced the maximum dry weight by showing the minimum reduction (47.22%) as compared to all others, and Karmici remained the lowest root dry weight (0.012 g) with the maximum reduction (65.71%) under severe stress, and showed tolerant behavior the first one and sensitive behavior the last one towards salinity.
Table 7.
Root dry weight of sorghum varieties as influenced by salt stress.
Table 8.
Shoots dry weight of sorghum varieties as influenced by salt stress.
Shoot Dry Weight (g)
The shoot dry weight of sorghum varieties was affected significantly by salinity (Table 8). Sorghum varieties mean indicated that the maximum reduction of shoot dry weight (33.87%) was detected in Karmici, even though the minimum reduction (21.05%) was detected in Debuday at 100 mM NaCl concentration compared to the control. The values of shoot dry weight of other varieties were in between these two varieties. On the other hand, Debuday, Jambo, and Elmi Jama successfully tolerated 200 mM NaCl salinity and exhibited less than 50% reduction in shoot dry weight, while Karmici proved to be sensitive and the shoot dry weight was severely reduced up to 58.06%. The reduction in shoot dry weight could also be associated with a reduced rate of leaf production, hence a lower number of leaves leading to reduced photosynthesis and accumulation of dry matter. Root injury and death due to ionic toxicity may have affected water uptake by the plants and, as a result, increased water deficit in the plants leading to decreased net photosynthesis, which in turn may have affected shoot growth. The reduction of the plant’s dry weight due to increased salinity may be a result of a combination of osmotic and specific ion effects of Cl- and Na+ [52, 53]. This result was supported by Rani et al. [54], Kausar et al. [22], Sarker et al. [23] in sorghum, and Carpici et al. [55] in maize, who found that shoot dry weights were negatively affected by increasing salt stress. In the present study, salinity reduced the shoot growth (shoot height, fresh weight) and ultimately reduced the biomass of the sorghum genotypes. These results are compatible with the results of the previous research that salinity may affect root and shoot growth [54]. The reduction of shoot growth might be due to suppression of leaf initiation and expansion as well as internode growth and by accelerating leaf abscission [43].
Table 9.
Na and K accumulation in shoots of sorghum varieties as influenced by salt stress.
Na and K Accumulation in the Shoot
The Na+ in the shoot significantly increased with increasing salinity in all genotypes, and it varied remarkably among the genotypes (Table 9). The genotype Karmici accumulated the maximum amount of Na (25.14 and 36.25 mg g-1 DW), while Debuday accumulated the minimum Na (18.21 and 27.16 mg g-1 DW) at 100 and 200 mM NaCl stress, respectively. The decreased Na+ accumulation in Debuday at high salinity levels can be explained by its high salt-tolerant ability that produced better growth and biomass production, while an opposite trend was observed in Karmici (Table 7 & Table 8). Some other reports indicate that plant genotypes with reduced Na+, accumulation at high salt levels are more tolerant to salt stress [7, 56]. Excessive amounts of salts in plant growth medium accumulate huge amounts of Na+ which adversely affects different biochemical and physiological processes, resulting in reduced plant growth [7, 57, 58].
The addition of excessive salts in the growth medium considerably decreased the K+ content in the shoot in all genotypes, and the magnitude of reduction diverged among the genotypes (Table 9). However, seedlings treated with salinity (100 and 200 mM NaCl) decreased the uptake of K ranging from 14.95 to 25.02%, and 46.35 to 59.37% over untreated seedlings, respectively. Debuday accumulated the highest amount of K (29.36 and 18.52 mg g-1 DW), while the least was recorded in Karmici (22.68 and 12.29 mg g-1 DW).
It is necessary to maintain low Na+ and high K+ in the cytoplasm to uphold the normal biochemical actions in plant cells. Salinity reduced the K/Na ratio implying the negative effect of salinity on the uptake of K+ and its positive effects on the Na+ uptake. It has been reported that saline stress imbalances the ratio of K+ and Na+ in the plant cytoplasm [59, 60]. The maintenance of low cytosolic Na concentration and K/Na homeostasis is noticed as a salt tolerance mechanism [61]. In this study, the Debuday genotype maintained the peak ratio of K/Na, while Karmici maintained the lowest ratio. This is because a large amount of Na+ enters into the shoot, which may inhibit the absorption of K+ and imbalance the ratio of K and Na in the plant. Meanwhile, it seems that Debuday was the most salt-tolerant genotype because of a higher K/Na ratio than other genotypes, which is in agreement with previous findings [62, 63].
Salt Tolerance Index
Salt Tolerant Index Based on Root Dry Weight
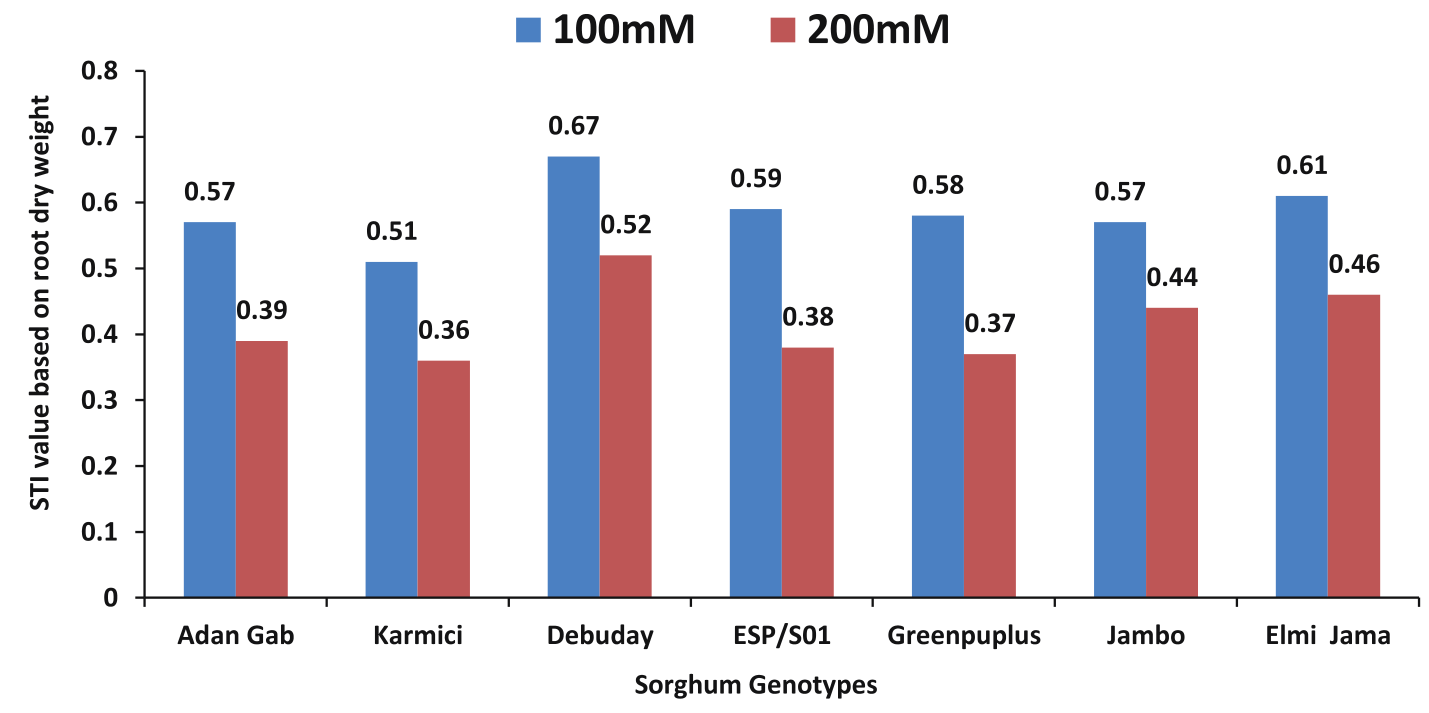
The salt tolerance index (STI) is an important parameter that indicates the salt tolerance of crops, and a higher STI reflects greater resistance to salt stress. Salt tolerance index based on the root dry weight (RSTI) significantly differed among seven genotypes in both salinity levels. At 100 mM levels, it ranged from 00.51 to 0.67 and had an average of 0.59 (Fig. 1). At 200 mM salinity level, the RSTI values ranged from0.36 to 0.52 with an average of 0.42 (Fig. 1). These RSTI values indicated a wide difference in salt tolerance among the sorghum genotypes. At 100 mM salinity levels Adan Gab, Debuday, ESP/S01, Green Jambuplus, Jambo, and Elmi Jama showed more than 0.55 RSTI value, while Karmici less than 0.55 RSTI value. At 200 mM salinity levels the variety Debuday, Jambo, and Elmi Jama showed more than 0.4 RSTI value, whereas Adan Gab, Karmici, ESP/S01, and Green Jambuplus showed less than 0.4 RSTI value. The results are in agreement with the findings of Sayar et al. [64] and Mahmoodzadeh et al. [65] in wheat, and Abari et al. [66] in Acacia species, who reported that salt-tolerant genotypes show a higher value than salt-sensitive genotypes. A higher value of STI means higher stability in yield and stress tolerance [22, 67, 68]. The RSTI of all the sorghum genotypes declined with increasing salinity and the variety Debuday and Karmici showed the highest and lowest RSTI indicating the best tolerance and worst susceptible genotypes, respectively.
Salt Tolerant Index Based on Shoot Dry Weight
Salt tolerant index based on the shoot dry weight (SSTI) varied among the genotype with saline condition (Fig. 2) At 100 mM salinity levels Adan Gab, Debuday Green Jambuplus, Jambo and Elmi Jama showed more than 0.7 SSTI value, while the variety Karmici and ESP/ S01 less than 0.7 SSTI value. At 200 mM salinity levels, the variety Debuday and Elmi Jama showed more than 0.45 SSTI value, whereas Adan Gab, Karmici, ESP/ S01, Green Jambuplus, and Jambo showed less than 0.45 STI value. The stress tolerance index (STI) is positively correlated with respect to grain yield under stress conditions [69]. Generally, higher value of STI reflects the genotypes with high yield potential and stress tolerance. The higher values of STI show higher genotype tolerance and higher yield potential under stress [68]. However, the highest value of SSTI was recorded at Debuday, while the lowest was recorded in Karmici indicating salt tolerance and susceptibility, respectively.
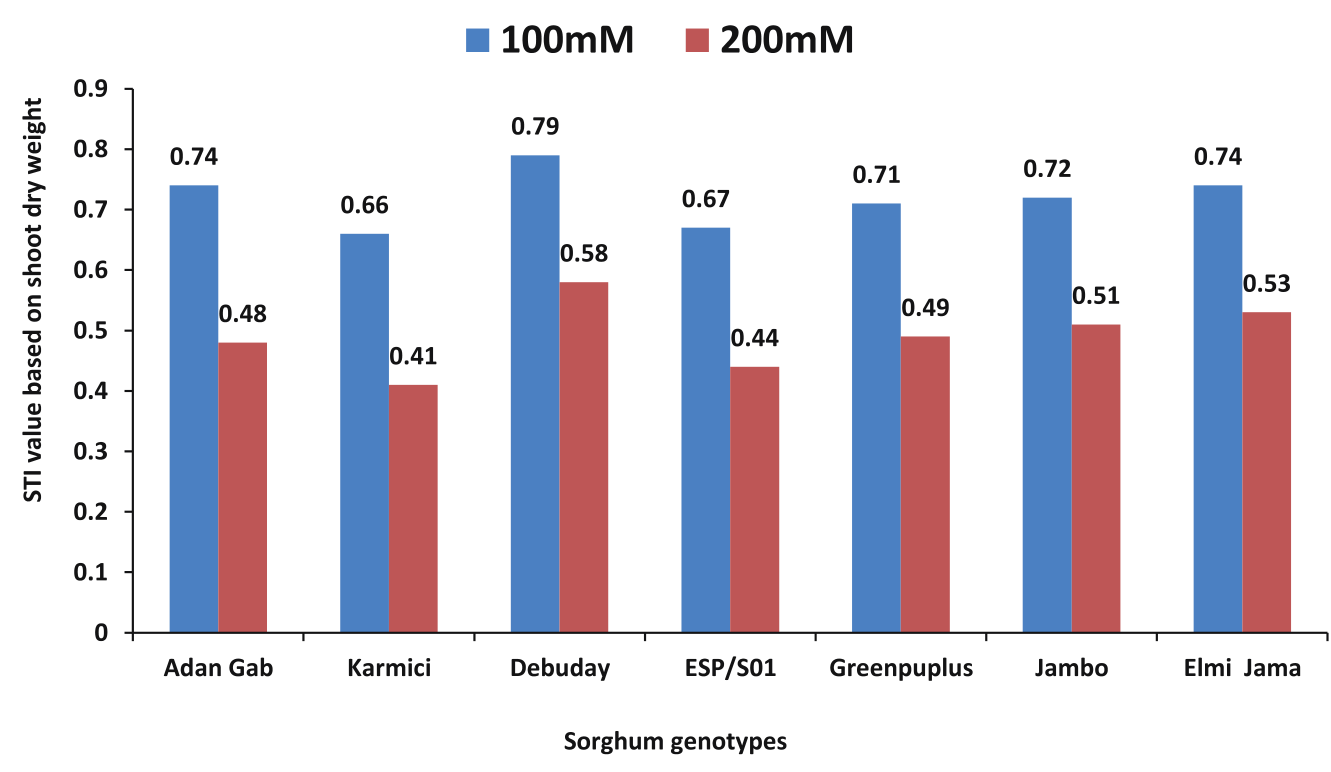
Fig. 3.
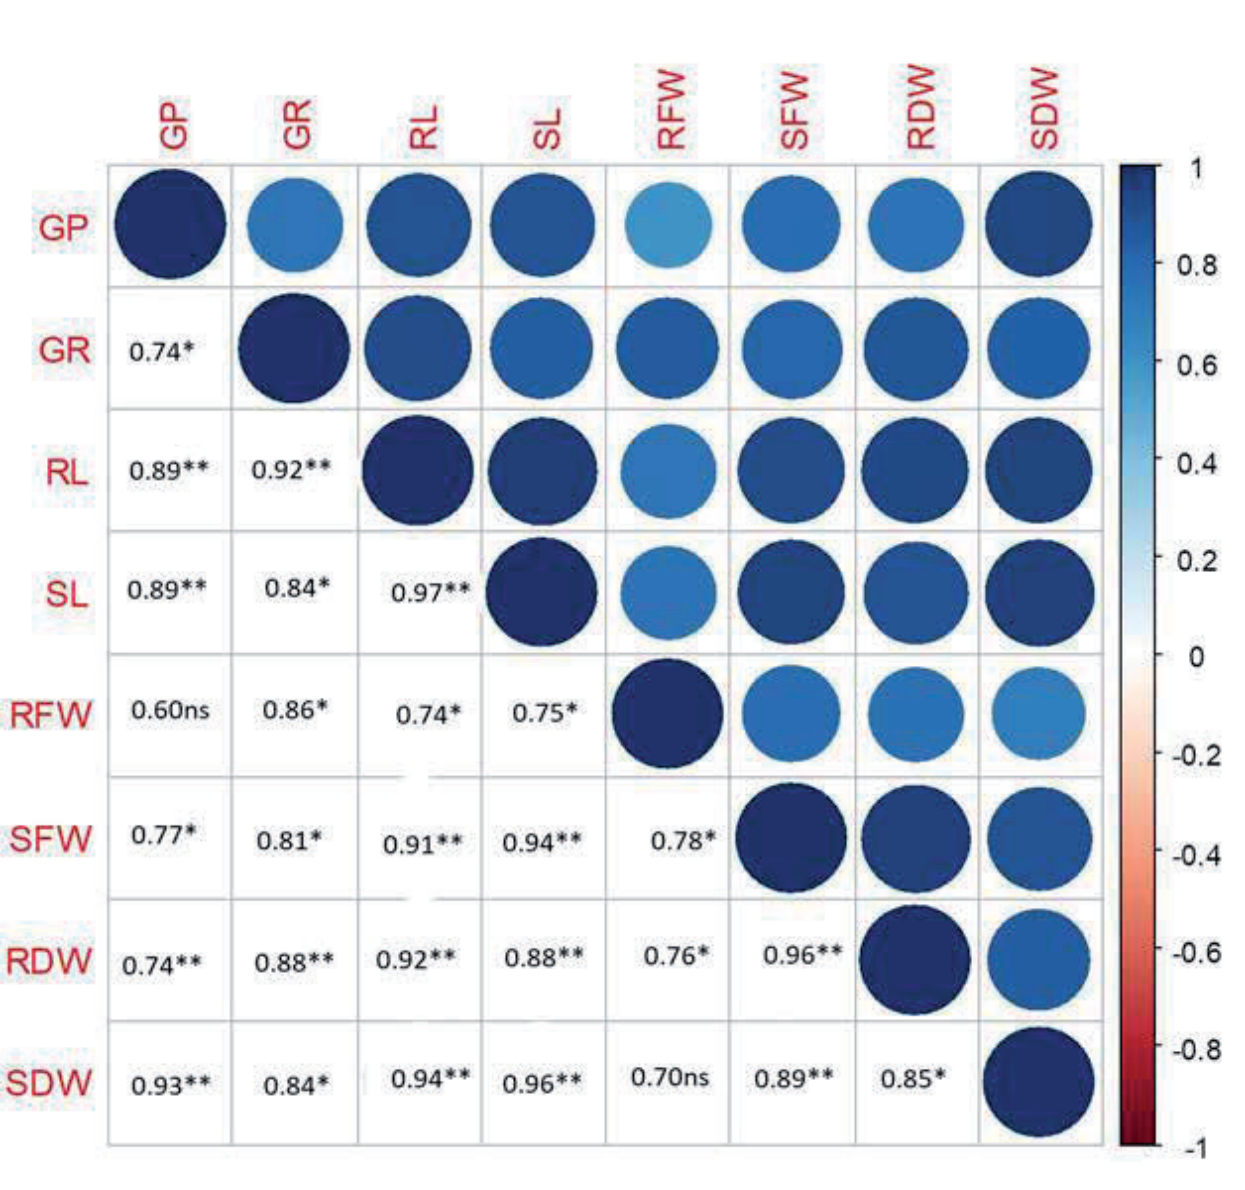
Correlation coefficients of germination and seedling growth traits of S. bicolor. According to the color scale, the darker positive scale represents most of the treatment responses, while the darker negative stripes showed the least response. The dark blue color showed a high positive association, and the dark red color showed a high negative correlation between traits. Similarly, as the color intensity decreases, the treatments showed moderate performance in both the positive and negative ranges (GP, Germination percentage; GR, Germination rate; RL, Root length; SL, Shoot length; RFW, Root fresh weight; SFW, Shoot fresh weight; RDW, Root dry weight; SDW, Shoot dry weight); *significant at 0.05, and **significant at 0.01; NS, Non-significant.
Correlation
All the studied traits showed a positive correlation with each other (Fig. 3). The RFW obtained a positive non-significant association with GP and SDW, and the rest of the characteristics exhibited a positive significant relationship among them. Strong positive significant relationships (r˃94) were found in SL with SDW, RL, and RDW with SFW. Positive significant relationships (r˃90) were obtained in GP with SDW; RL with SDW; RL with SFW, RDW, GR; and SFW with SL. The results are in agreement with the findings of Chen et al. [32], who reported that GP was significantly correlated with SL, RL, and SDW (correlation coefficients of 0.58, 0.68, and 0.64, respectively).
Conclusions
The result showed that the germination percentage (GP) of different sorghum varieties drastically reduced, and there were dissimilar results with increasing salt stress. The GR also varied among the genotypes due to the imposition of salt stress, and analogous trends with GP were found. Salinity stress treatments also had a significant impact on growth parameters and showed a significant decrease in partiality with the increasing salinity stress. The higher salinity level exhibited lower performance, and Debuday showed the best performance by displaying minimum reduction due to salt stress, while Karmici showed the worst performance. Reduced Na and higher K accumulation performance of Debuday genotypes signifies the salt-tolerant nature, while the vise-versa nature was observed in Karmici. The STI based on root and shoot dry weight in both stress conditions, Debuday exhibited the highest STI values under salt stress indicating salt tolerance, and Karmici exhibited the lowest STI values indicating salt susceptible variety. Based on the GP, GR, seedling growth features, and STI performance, Debuday can be considered a tolerant variety and Karmici can be considered a susceptible variety, and the genotypes can be in regard to their to salt tolerance as Debuday>Elmi Jama>Jambo>Adan Gab>ESP/ SO1>Green Jambuplus>Karmici. High or moderately salt-tolerant genotypes could be used in breeding programs as a source for genes of high-yielding ability and confer adaptation genotypes under saline conditions.

