

Introduction
Wastewater-Based Epidemiology (WBE) could be used to monitor the prevalence of illicit drug use, which utilizes the concentration of illicit drug residues in wastewater to estimate their mass loads or consumption at a community level. The concept of estimating drug consumption using wastewater analysis was first introduced by Daughton [1] and subsequently applied by Zuccato et al. [2] to estimate cocaine consumption in Italy.
Due to the ease and cost-effectiveness of collecting these wastewater samples, WBE has been widely applied worldwide to estimate illicit drug consumption [3-5]. An international study (including 47 wastewater treatment plants (WWTPs) in 42 cities in 21 countries) was conducted in Europe in 2013 [6]. The overall mass loads of cocaine, methamphetamine, amphetamine, and 3,4-methylenedioxymethamphetamine (MDMA) were respectively to be 263, 33, 28, and 18 mg 1000 inh-1 day-1, respectively. Across Europe, consumption of the three amphetamine-type drugs was comparable, while cocaine consumption was more than an order of magnitude higher than that of amphetamine-type drugs. Higher use of methamphetamine mainly appeared in northern Europe, whereas the remaining three illicit drugs, including cocaine, amphetamine, and MDMA, showed higher use levels in western Europe. A national study containing 14 WWTPs was conducted in four states and two territories in Australia [7]. Almost all locations in Australia were heavily influenced by methamphetamine, particularly in Queensland, where the mean consumption was higher than 1000 mg 1000 inh-1 day-1 in 2015 [8]. In addition to investigating the spatial distribution of illicit drug consumption based on large-scale wastewater sampling, WBE is a valuable tool for identifying emerging psychoactive substances [9, 10], revealing the synthetic processes used to manufacture illicit drugs [11], assessing changes in illicit drug abuse during specific events [12, 13], and even evaluating the impacts of COVID-19 lockdown on illicit drug consumption [14, 15].
In China, WBE has also been used to estimate illicit drug consumption. Khan et al. [16] assessed ten illicit drug consumption in four megacities, including Beijing, Shanghai, Guangzhou, and Shenzhen. In addition, a large-scale wastewater sampling campaign was conducted in major cities across China in 2014- 2015 to estimate the consumption of methamphetamine, ketamine, and heroin [17, 18]. Similar national sampling campaigns were carried out during the period of 2018- 2019, and the consumption patterns of common illicit drugs were investigated [19, 20]. Note that wastewater samples were typically collected in megacities in previous studies, mainly in Northeast China [21], Northwest China [22, 23], and South China [24, 25], and they were rarely reported in Southwest China.
In this study, wastewater sampling campaigns were conducted in two cities in Southwest China. The aim of this study is (1) to estimate the consumption of methamphetamine and ketamine (mg 1000 inh-1 day-1) in 2019 and (2) to investigate the “weekend effect”, short-term trends, and spatial patterns in the consumption of these two illicit drugs. Understanding spatiotemporal trends of illicit drug consumption is useful to identify hotspots in a region quickly and to assess the effectiveness of illicit drug prevention strategies.
Experimental
Wastewater Sample Collection
Eight WWTPs in two different cities in Southwest China were selected for wastewater sampling. City 1 included WWTP-1, WWTP-2, WWTP-3, and WWTP-4, while City 2 contained WWTP-5, WWTP-6, WWTP-7, and WWTP-8. Four sampling campaigns were carried out in 2019, with the first being conducted in March, the second in June, the third in September, and the fourth in December. During each sampling campaign, two samples were collected from each WWTP, with one sample being collected on a weekday and the other on a weekend. Samples were acidified to pH 2 using hydrochloric acid after collection and kept cold during transport to the laboratory.
Samples Pretreatment
High purity standard solutions of methamphetamine, ketamine, and cotinine, as well as corresponding isotopically labeled analogs (methamphetamine-d5, ketamine-d4, and cotinine-d3), were purchased from Cerilliant (Round Rock, Texas, U.S.), which were dissolved in methanol at a concentration of 1 mg mL-1 or 0.1 mg mL-1. Working mixtures were prepared by diluting each standard with methanol at a concentration of 1 μg mL-1. HPLC grade formic acid, methanol, and acetonitrile were purchased from Thermo Fisher Scientific. Milli-Q water was purified by a Milli-Q system (Bedford, MA, U.S.). Oasis PRiME MCX solid phase extraction cartridges (60 mg, 3 cc) were supplied by Waters (Milford, MA, U.S.).
Before instrumental analysis, samples were pretreated as follows: a wastewater sample was first filtered through a glass fiber filter (47 mm, Whatman, UK), and then 50 mL of the filtered sample spiked with 100 μL of the deuterated internal standard mixture (25 ng mL-1) was loaded onto an Oasis PRiME MCX cartridge. The cartridge was washed with methanol and then eluted with 4 mL of 5% ammonia in methanol. Finally, the extract was evaporated and reconstituted in 250 μL of Milli-Q water containing 0.1% formic acid for analysis.
LC-MS/MS Analysis
The extracts containing methamphetamine and ketamine were analyzed using liquid chromatography-tandem mass spectrometry (LC-MS/MS, AB SCIEX 5500, U.S.). An ACQUITY UPLC BEH C18 column (1.7 μm, 2.1×100 mm, Waters, U.S.) was used to separate methamphetamine and ketamine. The mobile phases were 0.1% formic acid in Milli-Q water (phase A) and acetonitrile (phase B). For methamphetamine and ketamine analysis, the flow rate of the mobile phase was set at 0.4 mL min-1, and the elution gradient program was as follows: Phase B increased from 5% to 25% from 0 to 6.0 min, then increased to 100% over 0.2 min and held at 100% until 8.0 min, and finally decreased to 5% in 0.2 min and held at 5% until the end of the run. The total run time was 11.0 min. Cotinine was analyzed separately using direct injection LC-MS/MS method at a flow rate of 0.3 mL min-1. The elution gradient program was as follows: Phase B maintained at 5% for the first 0.3 min and increased to 40% from 0.3 min to 2.0 min, then rose to 95% over 0.1 min and remained at 95% until 3.0 min, then decreased to 5% in 0.1 min and stabilized at 5% until the end of the run at 5.0 min.
Three analytes were measured in positive ion and multiple reaction monitoring (MRM) modes. The mass spectra parameters were as follows: ion source gas 1 and 2, 55 psi; curtain gas, 35 psi; source temperature, 450ºC; ion spray voltage, 5000 V. Other mass spectra parameters (e.g., declustering potential, collision energy, precursor ion, and product ion) and retention time of each analyte are listed in Table 1. Calibration standards of target compound mixtures were prepared in Milli-Q water with 0.1% formic acid within a concentration range of 0.2-100 ng mL-1, and the linearity was determined by calculating the correlation coefficients of the standard curves, which were higher than 0.99. The method’s performance, such as accuracy, precision, limit of quantification, and limit of detection, was found in a previous publication [5].
Estimation of Methamphetamine and Ketamine Consumption
Daily consumption of methamphetamine or ketamine (mg 1000 inh-1 day-1) was estimated as follows:
Where C is the concentration of methamphetamine or ketamine in wastewater (ng L-1), F is the wastewater flow rate (m3 day-1), CF refers to the correction factor, and Pcal is the number of inhabitants serviced by a WWTP.
A suitable drug target residue should first be selected before estimating illicit drug consumption. Baselt [26] reported that 4-7% of methamphetamine was metabolized to amphetamine, but about 43% was excreted unchanged as the parent compound. Ketamine was metabolized to ketamine and norketamine. In previous studies, ketamine was widely used to estimate its consumption due to the low concentration of norketamine [19, 27, 28]. Thus, the parent drug of methamphetamine and ketamine was selected to calculate its consumption in this study.
Zuccato et al. [29] first used a correction factor of 2.33, which was obtained from the excretion rate of 43% originally reported by Baselt [26], to estimate methamphetamine consumption. Considering the uncertainties associated with correction factors based on a single study, Gracia-Lor et al. [30] suggested 2.44 as a suitable correction factor for methamphetamine by refining all available pharmacokinetics data. In the present study, the correction factor 2.44 was also used to estimate methamphetamine consumption. Human urinary excretion of ketamine exhibited considerable variability, e.g., ranging from 2.3% to 30% based on intravenous injection studies [27, 31]. Note that snorting, rather than intravenous injection, was the main route of administration of ketamine. Unfortunately, the excretion rate of ketamine via snorting has not been reported in the literature. A new method was developed to deduce the correction factor of ketamine by comparing the ratios between the estimated consumption of different drugs with their corresponding ratios in official seizure data [32]. Following this approach, a new excretion rate of 20% was proposed to estimate ketamine consumption through wastewater analysis. In this study, a correction factor of 5.0 based on the excretion rate of 20% was also used to estimate ketamine consumption.
Considering the dynamic population size serviced by a certain WWTP caused by population growth, commuting, and holiday periods, population size was calculated based on the population biomarker as follows:
Where CCOT and F are the measured concentration of cotinine (ng L-1) and flow rate (m3 day-1) of wastewater, respectively. CFCOT is the correction factor used to estimate nicotine consumption, which was 2.85 according to the molecular weight ratio of nicotine to cotinine (0.92) and an average excretion rate of 32.3% summarized from eight different peer-reviewed literature [33]. Unic refers to the daily consumption of nicotine per inhabitant.
Combining Eqs. (1)-(2), consumption of interested illicit drugs (mg 1000 inh-1 day-1) was calculated as follows:
Table 1.
Mass spectra parameters and retention time of three analytes.
Using the following parameters: correction factors of 2.44, 5.0, and 2.85 for methamphetamine, ketamine, and cotinine, respectively, and Unic of 1.5 mg inh-1 day-1, consumption of methamphetamine and ketamine could be estimated based on Eq. (3).
Results and Discussion
Overview of Methamphetamine and Ketamine Consumption
Fig. 1 shows the consumption of methamphetamine and ketamine at eight WWTPs during the four sampling campaigns in 2019. In City 1, daily consumption of methamphetamine ranged from 13.3 to 353.2 mg 1000 inh-1 day-1, with the highest consumption occurring in June at WWTP-1 and the lowest one in December at WWTP-4. In City 2, the highest methamphetamine consumption was found in June at WWTP-6 with a value of 132.2 mg 1000 inh-1 day-1, while the lowest consumption of 19.8 mg 1000 inh-1 day-1 was observed in December at WWTP-5. The population-weighted consumption, including all four WWTPs within a city, was used to estimate mean illicit drug consumption. The mean population-weighted consumption of methamphetamine in City 1 over the four periods was 188.6 mg 1000 inh-1 day-1, which was almost three times that of City 2 (57.0 mg 1000 inh-1 day-1). Compared with other cities in China, the consumption of methamphetamine in City 1 in 2019 was about 5 times higher than that in South China [24] and Guangxi [34], but comparable to the mean consumption of 24 cities in China during the 2018-2019 period [19]. In comparison to other countries around the world, methamphetamine consumption in this study was over an order of magnitude lower than in Mexico and the U.S. [35, 36], evidently lower than in Australia [7] and New Zealand [37], but relatively higher than in Korea [38] and Spain [39].
The highest and lowest ketamine consumption in City 1 appeared at WWTP-1 in June (29.6 mg 1000 inh-1 day-1) and WWTP-2 in December (0.6 mg 1000 inh-1 day-1), respectively. In City 2, ketamine consumption varied from 0.2 to 97.1 mg 1000 inh-1 day-1, with the maximum value at WWTP-8 in June and the minimum one at WWTP-6 in December. During the four sampling periods in 2019, the mean population-weighted consumption of ketamine in City 1 was 9.1 mg 1000 inh-1 day-1, about 20% higher than the mean consumption in City 2 (7.6 mg 1000 inh-1 day-1). Compared with national consumption data, ketamine use in this study was at a low level, e.g., about four times lower than the average consumption in 25 cities [19] and almost 70 times lower than that in Guangxi [34]. In comparison to other countries, ketamine use in this study was about 40 times lower than in Malaysia [40] and within the range of consumption in Colombia [41] and Italy [42].
Weekend Effects
Comparing illicit drug consumption on weekdays and weekends could give a first insight into the “weekend effect”. Table 2 and Table 3 show the weekday and weekend consumption of methamphetamine and ketamine in the two cities. A two-tailed t-test was used to compare weekday and weekend consumption data, and statistical significance was determined with a p value <0.05. No significant differences in methamphetamine consumption between weekdays and weekends were observed in the two cities, with a p value of 0.707 in City 1 and 0.065 in City 2, implying the regular use of methamphetamine rather than recreational use. Methamphetamine use patterns in the two cities were consistent with other cities in China and Australia [24, 43, 44]. Similarly, the differences in ketamine consumption between weekdays and weekends were not significant at both City 1 (p value of 0.281) and City 2 (p value of 0.183), which were consistent with the results from China [24], but differed from the consumption patterns in Mexico and the United Kingdom, where pronounced “weekend effect” were observed [35, 45].
Fig. 1.
Consumption of methamphetamine and ketamine at eight WWTPs during the four sampling campaigns in 2019.
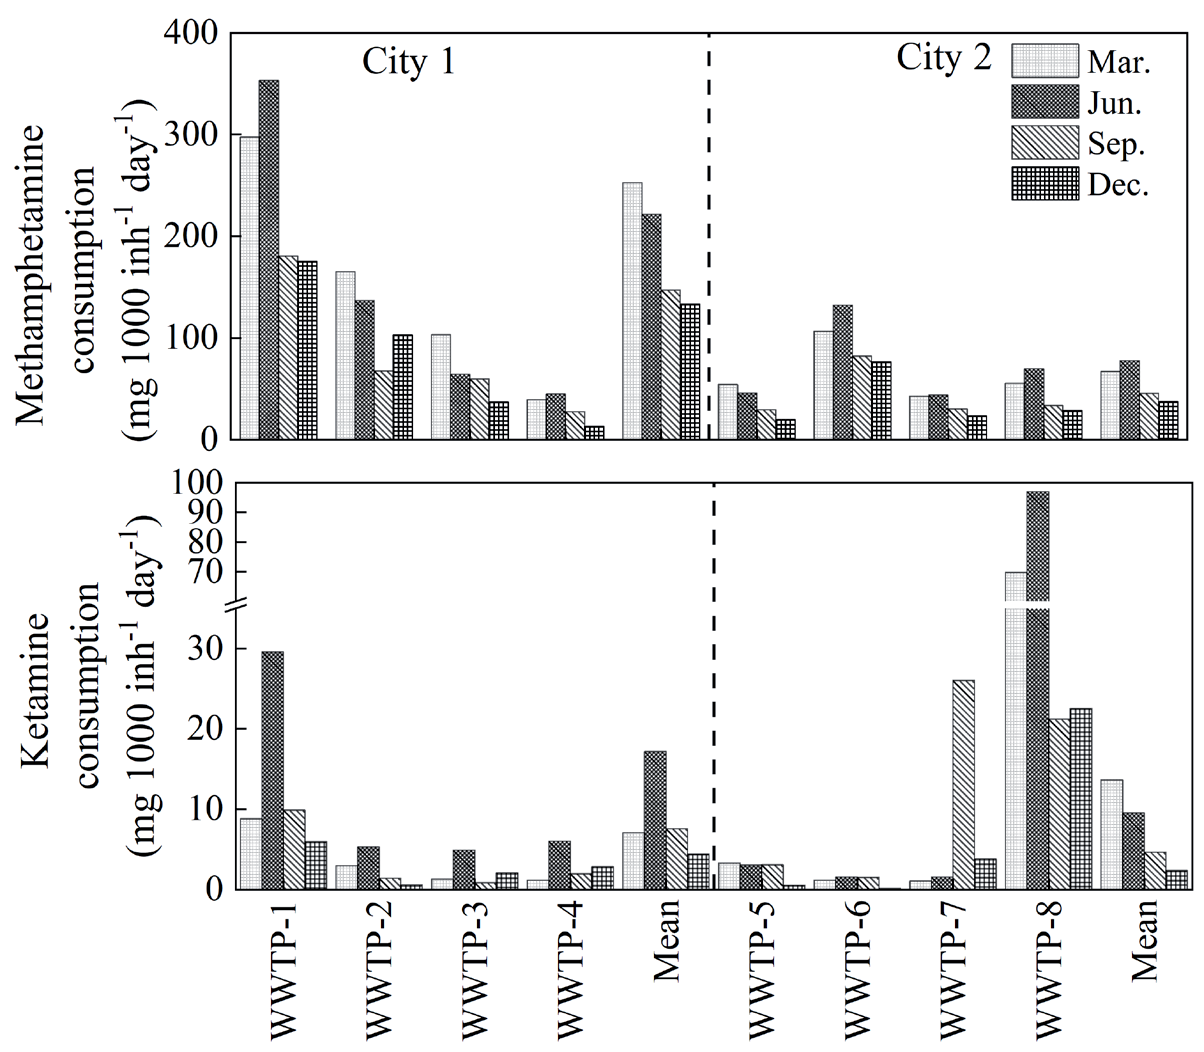
Table 2.
Consumption of methamphetamine (mg 1000 inh-1 day-1) on weekdays and weekends in 2019 in two cities.
Table 3.
Consumption of ketamine (mg 1000 inh-1 day-1) on weekdays and weekends in 2019 in two cities.
Site Differences
Patterns of illicit drug use are likely to be influenced by their socio-economic conditions [42, 46]. WWTP- 1 serves a large population (about 0.85 million inhabitants), WWTP-4 serves a small population (about 86 thousand inhabitants), and the remaining six WWTPs serve medium populations. The economic conditions in City 1 were better than those in City 2. As shown in Fig. 1, the consumption of methamphetamine and ketamine in City 1 was almost higher than in City 2 during four sampling periods, which was probably related to the better economic conditions as well as the ease of access to illicit drugs due to its convenient transport in City 1.
Within City 1, the highest consumption of methamphetamine and ketamine was found at WWTP-1, which was more than twice that of the other three WWTPs. Therefore, the region where WWTP-1 was located was considered a potential hotspot for methamphetamine abuse, which should be of greater concern to policymakers. The high consumption of illicit drugs at WWTP-1 was probably associated with its well-developed economy and the provision of services to a large population. On the contrary, the lowest consumption of methamphetamine was observed at WWTP-4, which served a small population. With the exception of WWTP-1, where ketamine consumption was higher than 5 mg 1000 inh-1 day-1, ketamine consumption at the other WWTPs in City 1 was quite low, implying that ketamine abuse was not widespread in this region.
Within City 2, the maximum consumption of methamphetamine and ketamine occurred at WWTP-6 and WWTP-8, respectively. It seems that the economic conditions were not the main factor controlling the illicit drug consumption in City 2 since WWTP-5 is situated in a more economically developed area. However, the highest consumption of methamphetamine and ketamine was not observed at WWTP-5. Note that the consumption of ketamine at WWTP-8 was extremely high, which was about 1-2 orders of magnitude higher than those at the other WWTPs, emphasizing a hotspot of ketamine abuse in this region.
Short-Term Trends
The sampling campaigns in this study were conducted in four different months, thus short-term trends of methamphetamine and ketamine consumption could be examined. In City 1, the population-weighted consumption of methamphetamine and ketamine in December decreased by about 47% and 38%, respectively, compared with the consumption data in March. Similarly, the population-weighted consumption of methamphetamine and ketamine in December was about 44% and 83% lower than those in March in City 2. Specifically, the largest decline in methamphetamine consumption appeared at WWTP-1, with a decrease of 122 mg 1000 inh-1 day-1, while the highest percentage decrease was observed at WWTP-4, with a percentage decline of 66%. The consumption of ketamine was low in most WWTPs in 2019, with the exception of WWTP- 8. Therefore, the decrease in ketamine consumption in these two cities was not obvious, which was typically less than 3.0 mg 1000 inh-1 day-1. However, a dramatic decline in ketamine consumption was still observed at WWTP-8, with a decrease of 47 mg 1000 inh-1 day-1.
Overall, decreasing trends of methamphetamine and ketamine consumption from March to December were observed in both cities, with lower consumption typically occurring in September and December. This phenomenon was different from those reported in the literature. For example, methamphetamine consumption increased toward the end of the year and showed relatively high values in December in Istanbul [47]. Similarly, a high methamphetamine load was observed in December in Australia, which was thought to be associated with increased social events during the holiday season [48]. The impact of festive events (e.g., New Year and Christmas) on stimulant drug consumption was evident in a large European city, resulting in higher consumption in December [49]. In general, in many countries, changes in illicit drug consumption were closely related to special activities, because more recreational activities consumed more illicit drugs. In China, many important festivals occur in September, October, and December, such as the National Day, the Mid-Autumn Festival, and New Year’s Day, so illicit drug consumption is expected to be higher during those festivities. Nevertheless, in September and December of 2019, illicit drug consumption decreased in the two study cities, which should be largely attributable to the effective anti-drug measures taken by the local anti-drug authorities, such as cracking down illicit drug production and trafficking, strengthening the management of precursor chemicals used in illicit drug production, preventing illicit drug importation, and educating communities about the harmful effects of illicit drugs.
Note that there are some uncertainties associated with estimating illicit drug consumption based on a wastewater epidemiology approach [50]. Firstly, the back-calculation of illicit drug use is related to the stability of drug target residues and the urinary excretion rate of these illicit drugs. Castiglioni et al. [50] found that amphetamine-like stimulants (i.e., methamphetamine) are generally stable in wastewater. Li et al. [51] showed that ketamine was quite stable. Thus, the estimated consumption of methamphetamine and ketamine was less influenced by their stability in wastewater. In this study, the average excretion rate of methamphetamine from different published data was selected, which could reduce uncertainty compared to using pharmacokinetics data from only one study. Secondly, variations in the number of people served by the WWTP are also responsible for variations in illicit drug consumption, which can generate up to 55% uncertainty [50]. In this study, cotinine was used as a biomarker of population size, but other parameters such as the excretion rate of nicotine and daily nicotine consumption per inhabitant are also required to calculate the population size, which may cause bias in the estimation of illicit drug consumption. In the future, it is recommended that a combination of different methods be used to estimate population size to reduce its uncertainty.
Conclusions
The wastewater-based epidemiology approach provides real-time and objective estimation of illicit drug consumption. In this study, wastewater samples were collected from eight WWTPs in two cities in Southwest China during four months in 2019. Population-weighted consumption of methamphetamine was 188.6 and 57.0 mg 1000 inh-1 day-1 in City 1 and City 2, respectively, while the corresponding consumption of ketamine was 9.1 and 7.6 mg 1000 inh-1 day-1, demonstrating that methamphetamine abuse is more prevalent than ketamine in the two study cities.
Site differences in methamphetamine consumption were obvious among the eight WWTPs, with the highest consumption of methamphetamine and ketamine occurring at WWTP-1 and WWTP-8, implying that these two regions were considered to be potential hotspots for methamphetamine and ketamine abuse. From March to December, methamphetamine consumption in the two cities decreased significantly, by as much as 122 mg 1000 inh-1 day-1. Similarly, ketamine consumption at WWTP- 8 decreased from 69.7 mg 1000 inh-1 day-1 in March to 22.5 mg 1000 inh-1 day-1 in December, a decline of about 68%. The appreciable declines in methamphetamine and ketamine consumption in 2019 at both City 1 and City 2 were primarily attributed to effective anti-drug measures. Short-term trends in illicit drug consumption based on wastewater analysis could be practically used to assess the effectiveness of prevention policies in each community or city in the future.

