

Introduction
The Chaohu Lake Basin holds significant importance as one of the five major freshwater lakes in China. It serves as a vital water source, ecological reserve, and part of the Yangtze River Basin [1]. Recognizing its ecological significance, the Chaohu Lake Basin was included in the “three rivers and three lakes” management plan during the Ninth Five-Year Plan period. In 2014, it was designated as one of the first national ecological civilization demonstration zones, demonstrating successful efforts in its ecological protection and restoration.
However, the rapid industrialization, urbanization, and agricultural modernization in the Chaohu Lake Basin have put immense pressure on its ecological environment [2]. While some studies have focused on specific aspects such as water quality pollution [3] and land use changes [4], comprehensive and long-term research on the large-scale dynamic monitoring of ecological environmental quality remains scarce. This dearth of information hinders the formulation of effective recommendations for ecological environmental management in the basin.
To address this gap, it is crucial to monitor and evaluate the ecological and environmental quality of the Chaohu Lake Basin. Traditional ecological evaluations are time-consuming, expensive, and lack efficiency. Satellite remote sensing technology offers a powerful tool for large-scale monitoring and real-time observations [5]. Researchers have proposed various remote sensing indices and conducted studies on urban areas [6], land [7], and vegetation [8]. Professor Xu Hanqiu’s remote sensing ecology index (RSEI), which integrates multiple factors based solely on remote sensing information, enables objective and rapid evaluation of regional ecological environmental quality [9]. Several scholars have successfully applied this index to monitor the ecological environment in different areas. Song Huimin et al. chose the RSEI index to quantitatively evaluate the ecological environment quality of various districts and counties in Weinan city and found that the ecological environment quality was greatly affected by urban planning and construction, but in general, the ecological environmental quality improved [10]; Wen Xiaole et al. analyzed and evaluated the ecological conditions of Zhuozhou city and Gu’an County during 1997-2017, and their study showed that the change in surface cover type had a significant impact on the regional ecological environment [11]; Zhang Pei et al. analyzed the ecological and environmental characteristics of the main stream of the Tarim River before and after comprehensive management with remote sensing (RS), geographic information system (GIS), and the ecological condition index method based on remote sensing data from Landsat and China-Pakistan Resources Satellite [12].
Despite these advancements, the increasing availability and volume of remote sensing data highlight the limitations of traditional ecological and environmental evaluations, including low efficiency, long durations, and high costs. The Google Earth Engine (GEE), a cloud computing platform, has emerged as a practical solution to address these challenges [13]. With its extensive image data and powerful computing capabilities, GEE supports large-scale and long time series estimations, interactive data verification, and fast data visualization. Therefore, it offers a valuable tool for analyzing spatial and temporal dynamics and influencing factors related to ecological environmental quality in the Chaohu Lake Basin.
This study utilized the GEE platform to obtain the RSEI index for the Chaohu Lake Basin over an extended time series. The spatial correlation analysis method and geographic probe model were then employed to investigate the driving mechanisms behind ecological and environmental changes in the basin. The findings of this study will provide a scientific foundation for the construction of the ecological environment in the Chaohu Lake Basin. Moreover, they will contribute to the protection of the region’s ecological environment and the sustainable development of its natural resources.
Material and Methods
Study Area
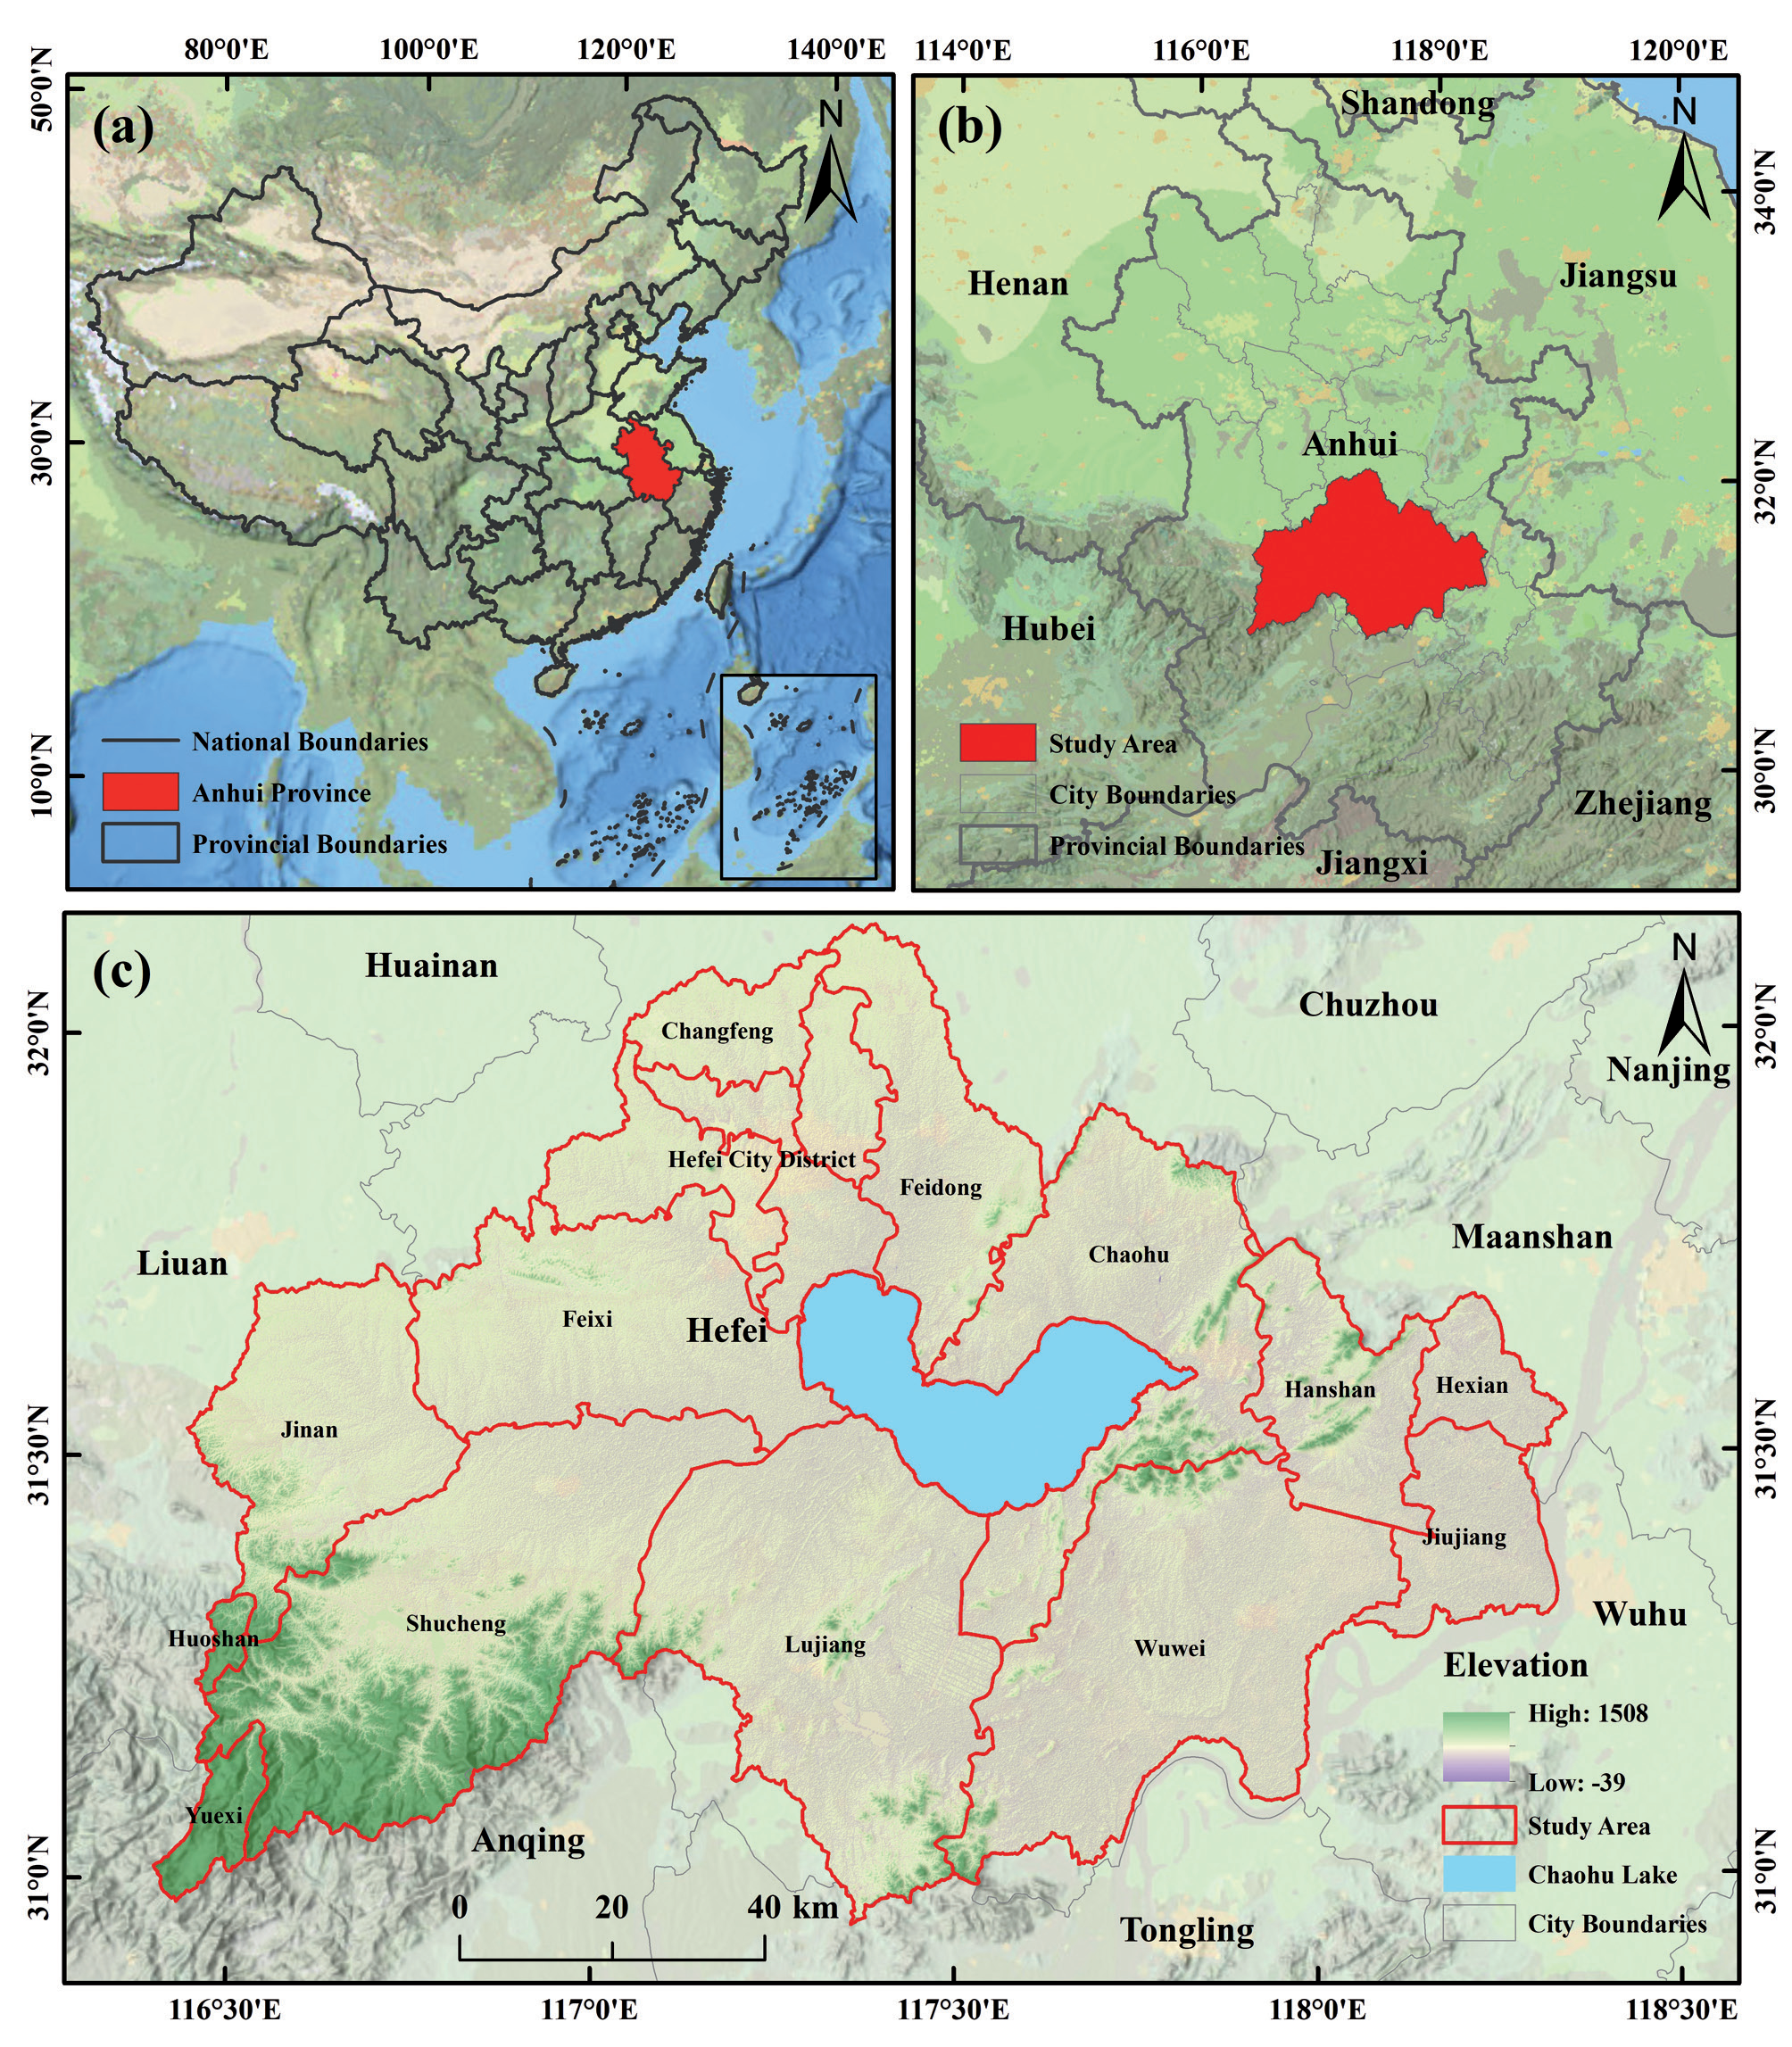
The Chaohu Lake Basin, in central Anhui Province, China, is a part of the left bank water system of the lower Yangtze River and one of the five major freshwater lakes in the country (Fig. 1). With a total area of 13,486 km2 and coordinates of 116°24’-117°56’E, 30°58’-32°06’N, the basin is characterized by plains and hills, a topography that is high in the southwest and low in the northeast, and a sloping area. Its climate is subtropical humid monsoon, with an average annual temperature of 15-16ºC and annual precipitation of approximately 1,215 mm.
Datasets
The data sources in this paper included remote sensing data and auxiliary data (Table 1). In this study, the “LANDSAT/LT05/C02/T1_L2” and “LANDSAT/ LC08/C02/T1_L2” datasets from the GEE platform were obtained and were radiometrically calibrated, atmospherically corrected, and geometrically corrected [14]. The images were selected in the time range of June-September, with a spatial resolution of 30 m and a temporal resolution of 16 d. The auxiliary data included administrative boundaries, elevation, mean annual temperature, mean annual precipitation, land use type, population density, and economic density. The vector data of administrative district boundaries were obtained from the National Geomatics Center of China (NGCC) (http://www.ngcc.cn). Elevation data were obtained from the Geospatial Data Cloud (http://www.gscloud.cn). Average annual temperature, average annual precipitation, land use type, and economic density data were obtained from the Data Center for Resources and Environmental Sciences, CAS (https://www.resdc.cn).
Data Preprocessing
Calculation of Component Metrics Based on the GEE Platform
This study utilized the Google Earth Engine (GEE) platform to screen and mask data with less than 30% cloud coverage in summer images taken from June to September. A minimum cloud synthetic image was generated for each year by using the QA quality band. To eliminate interference from water bodies, an improved normalized water body index (MNDWI) was employed to mask them and extract water body thresholds [15]. Furthermore, a remotely sensed ecological index (RSEI) model was developed [16] based on four components: vegetation index, moisture component, bare soil index, and surface temperature component; these components represent the greenness, moisture, dryness, and heat indices, respectively. The expressions for each component are as follows:
where NDVI is the greenness index, Wet is the humidity index, NDSI is the dryness index, and LST is the heat index.
Construction of the Comprehensive Remote Sensing Ecological Index
To prevent an imbalance in the result weights, the four indicators used in the remote sensing ecological index model were normalized to unify their magnitude results between [0, 1]. The calculation formula is as follows:
Table 1.
Data types used in this study.
where IN is the normalized result of the indicator, I is the actual value of the indicator, and Imax and Imin are the maximum and minimum values of the indicator, respectively.
Ecoenvironmental Quality Classification and Change Analysis
The Chaohu Lake Basin was graded using the RSEI at 0.2 intervals, ranging from poor (0-0.2) to excellent (0.8-1.0). The ecological environmental quality of the basin was quantified by calculating the percentage of area in each grade range for each year. The results revealed a distribution of environmental quality grades.
Analysis of the Spatial and Temporal Evolution of Ecological Environmental Quality
The Chaohu Lake Basin ecological environmental quality was monitored using the difference method at 5-year intervals. The results were classified into five categories: significantly worse, worse, unchanged, better, and significantly better. The RSEI classification was used to better analyze spatial and temporal changes.
Spatial Autocorrelation Analysis
Spatial correlation analysis enabled the description of the spatially homogeneous distribution of ecological environmental quality in the study area [18]. It also was used to assess the distribution patterns and aggregation patterns through global and local spatial autocorrelation [19].
The global spatial autocorrelation reflected the spatial aggregation of the study area by calculating the global Moran’s I index (Global Moran’s I). A global Moran’s I index greater than 0 indicates that the spatial distribution of ecological environmental quality is positively correlated, and the larger its value is, the stronger the correlation and the more spatially aggregated it is. A Moran’s I index less than 0 indicates that the spatial distribution of ecological environmental quality is negatively correlated, and the larger its value is, the weaker the correlation and the more spatially discrete it is. The Moran’s I index was equal to 0, which indicated that the spatial distribution of ecological environmental quality presented randomness. The calculation formula is as follows:
where I is the global Moran’s I index statistic. n is the number of spatial cells; wij denotes the weight matrix of each spatial cell i and spatial cell j; xi and xj denote the RSEI values at i and j; x̅ and is the mean RSEI value.
Local Moran’s I was used to calculate the correlation between changes in ecological quality of the grid cells in the study area. The LISA clustering maps were divided into five categories: “high-high”, “high-low”, “low-high”, “low-low” and “not significant”. The “high-high” clustering reflected good ecological quality, while the “high-low” and “low-high” clusters had average quality. “Low-low” clustering indicated poor ecological quality. The calculation equation is as follows:
where Ii is the local Moran’s I index statistic; the remaining variables have the same meaning as the global autocorrelation variables.
Geodetector
Geodetectors are a group of statistical methods that detect spatial differentiation and reveal its driving forces. They have been widely used in remote sensing field research [21-22] by calculating and comparing single-factor q values and q values after two-factor superposition, thus analyzing the interaction between variables [20]. The results of the ecological environmental quality analysis of the Chaohu Lake Basin were used as dependent variables, and a total of seven factors, elevation, slope, mean annual temperature, mean annual precipitation, land use type, economic density, and population density, were selected as independent variables by using ArcMap 10.2 to generate a 1 km 1 km fishing network with 12,883 sampling points. The natural interruption method was used to investigate the influence of each factor on the ecological environment quality.
To explore the explanatory power of impact factors on the spatial heterogeneity of ecological environmental quality in the Chaohu Lake Basin, the following factor detection equation was used:
where L is the number of classifications of the variable; N and Nh are the samples of the global and each classification h, respectively; δ2 and δh2 are the variances of the global and classification h, respectively; q is the degree of explanation of the detection factor on the ecological environmental quality, and the value ranges from 0 to 1. The closer the value of q is to 1, the stronger the explanation of the factor on the ecological environment quality, i.e., the greater the influence, and vice versa.
Five types existed for detecting whether the explanatory power of the interaction of the two factors on the ecological quality of the Chaohu Lake Basin was enhanced or weakened (Table 2).
The significant differences in the effects of detection factors on the spatial distribution of ecological environmental quality in the Chaohu Lake Basin were expressed by the F-statistic:
where Nx1 and Nx2 denote the sample size of two factors x1 and x2, respectively; SSWx1 and SSWx2 denote the sum of intrastratum variance of strata formed by x1 and x2, respectively; and L1 and L2 denote the number of strata of variables x1 and x2, respectively, where the null hypothesis H0: SSWx1 = SSWx2. If H0 is rejected at the significance level of α, then it indicates that the effects of drivers x1 and x2 on the spatial distribution of RSEIs are significantly different.
Results and Discussion
Analysis of Spatial and Temporal Changes in Ecological Quality
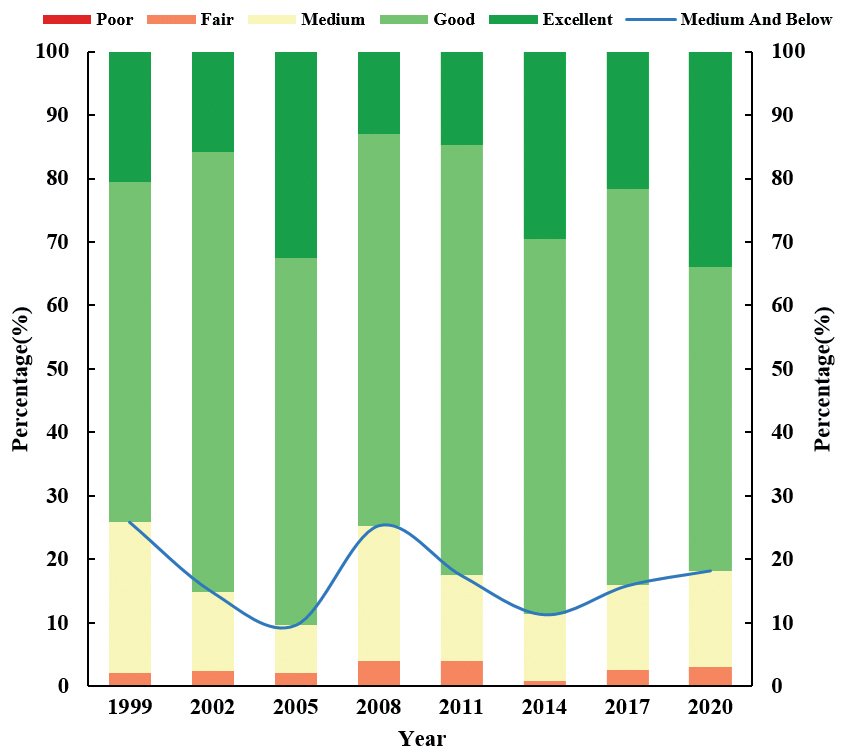
The mean values of the RSEI in the Chaohu Lake Basin from 1999 to 2020 were 0.68, 0.70, 0.74, 0.66, 0.69, 0.73, 0.71 and 0.72, respectively (Fig. 2). The mean value of RSEI increased from 0.68 in 1999 to 0.72 in 2020 during 1999-2020, indicating that the ecological environmental quality improved. The ecological environmental quality classification of Chaohu Lake Basin was mainly good during the two decades, with the area classified as good ranging from 47.74% to 69.29% of the total area, followed by the area classified as excellent ranging from 12.97% to 34.01% of the total area, the area classified as medium ranging from 7.62% to 23.74% of the total area, and the total areas classified as fair and poor being relatively small ranging from 0.87% and 3.95% of the total area.
From 1999 to 2008, the total area of Chaohu Lake Basin with good and excellent ecological quality grades increased (Fig. 3), with the highest percentage reaching 90%; the total area of poor and poor grades was less than 3%. In 2008, the proportion of the area with good ecological quality grade in Chaohu Lake Basin was over 60%, the area with excellent grade decreased from 32.48% to 12.97% in 2005, and the area with poor grade and poor grade increased from 0.04% and 2.00% to 0.10% and 3.85% in 2005, respectively. During the period of 2008-2014, the area of Chaohu Lake Basin with good and excellent ecological environment quality grades increased continuously; the total area accounted for more than 70%, and the total area with poor grades accounted for less than 1% in 2014. In 2017, the area of excellent and good grades decreased, and the area of poor grades increased. At this time, the ecological environmental quality of the Chaohu Lake Basin showed a slight decline. In 2020, a rebound in the ecological environment of the Chaohu Lake Basin occurred. Collectively, there was a significant decline in the RSEI in 2008 and a slight decline in 2017. However, the RSEI showed an overall upward trend from 1999 to 2020, indicating that the ecological environment of the Chaohu Lake Basin improved.
Table 2.
Interactions between two explanatory variables.
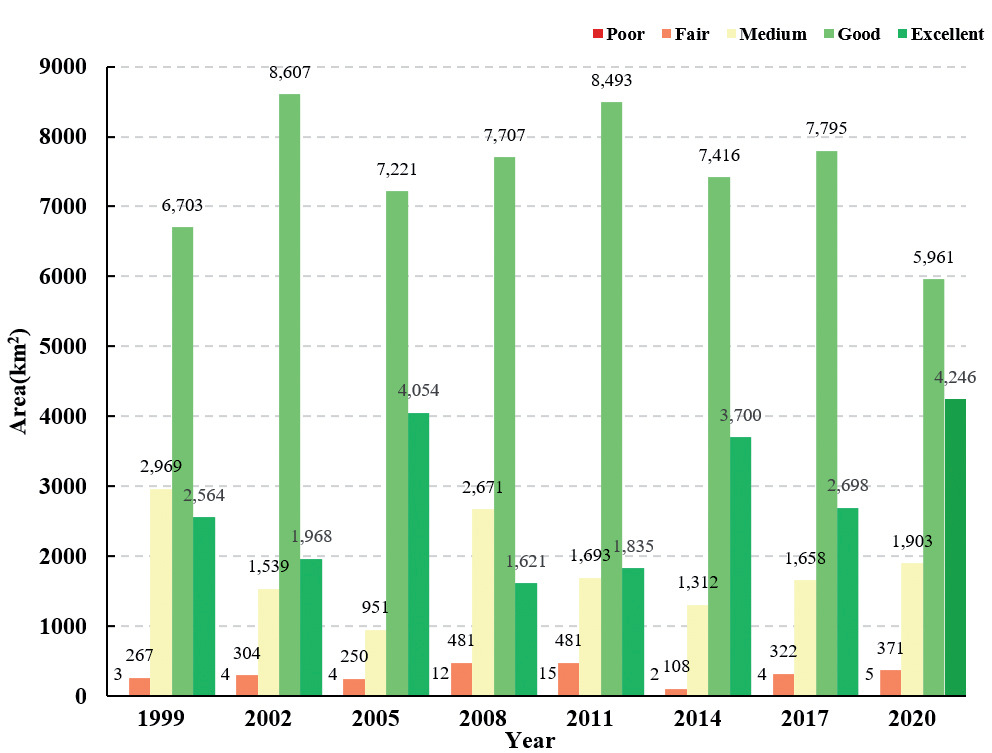
Fig. 3.
Percentage of area based on ecological environmental quality classification in Chaohu Lake Basin from 1999 to 2020.
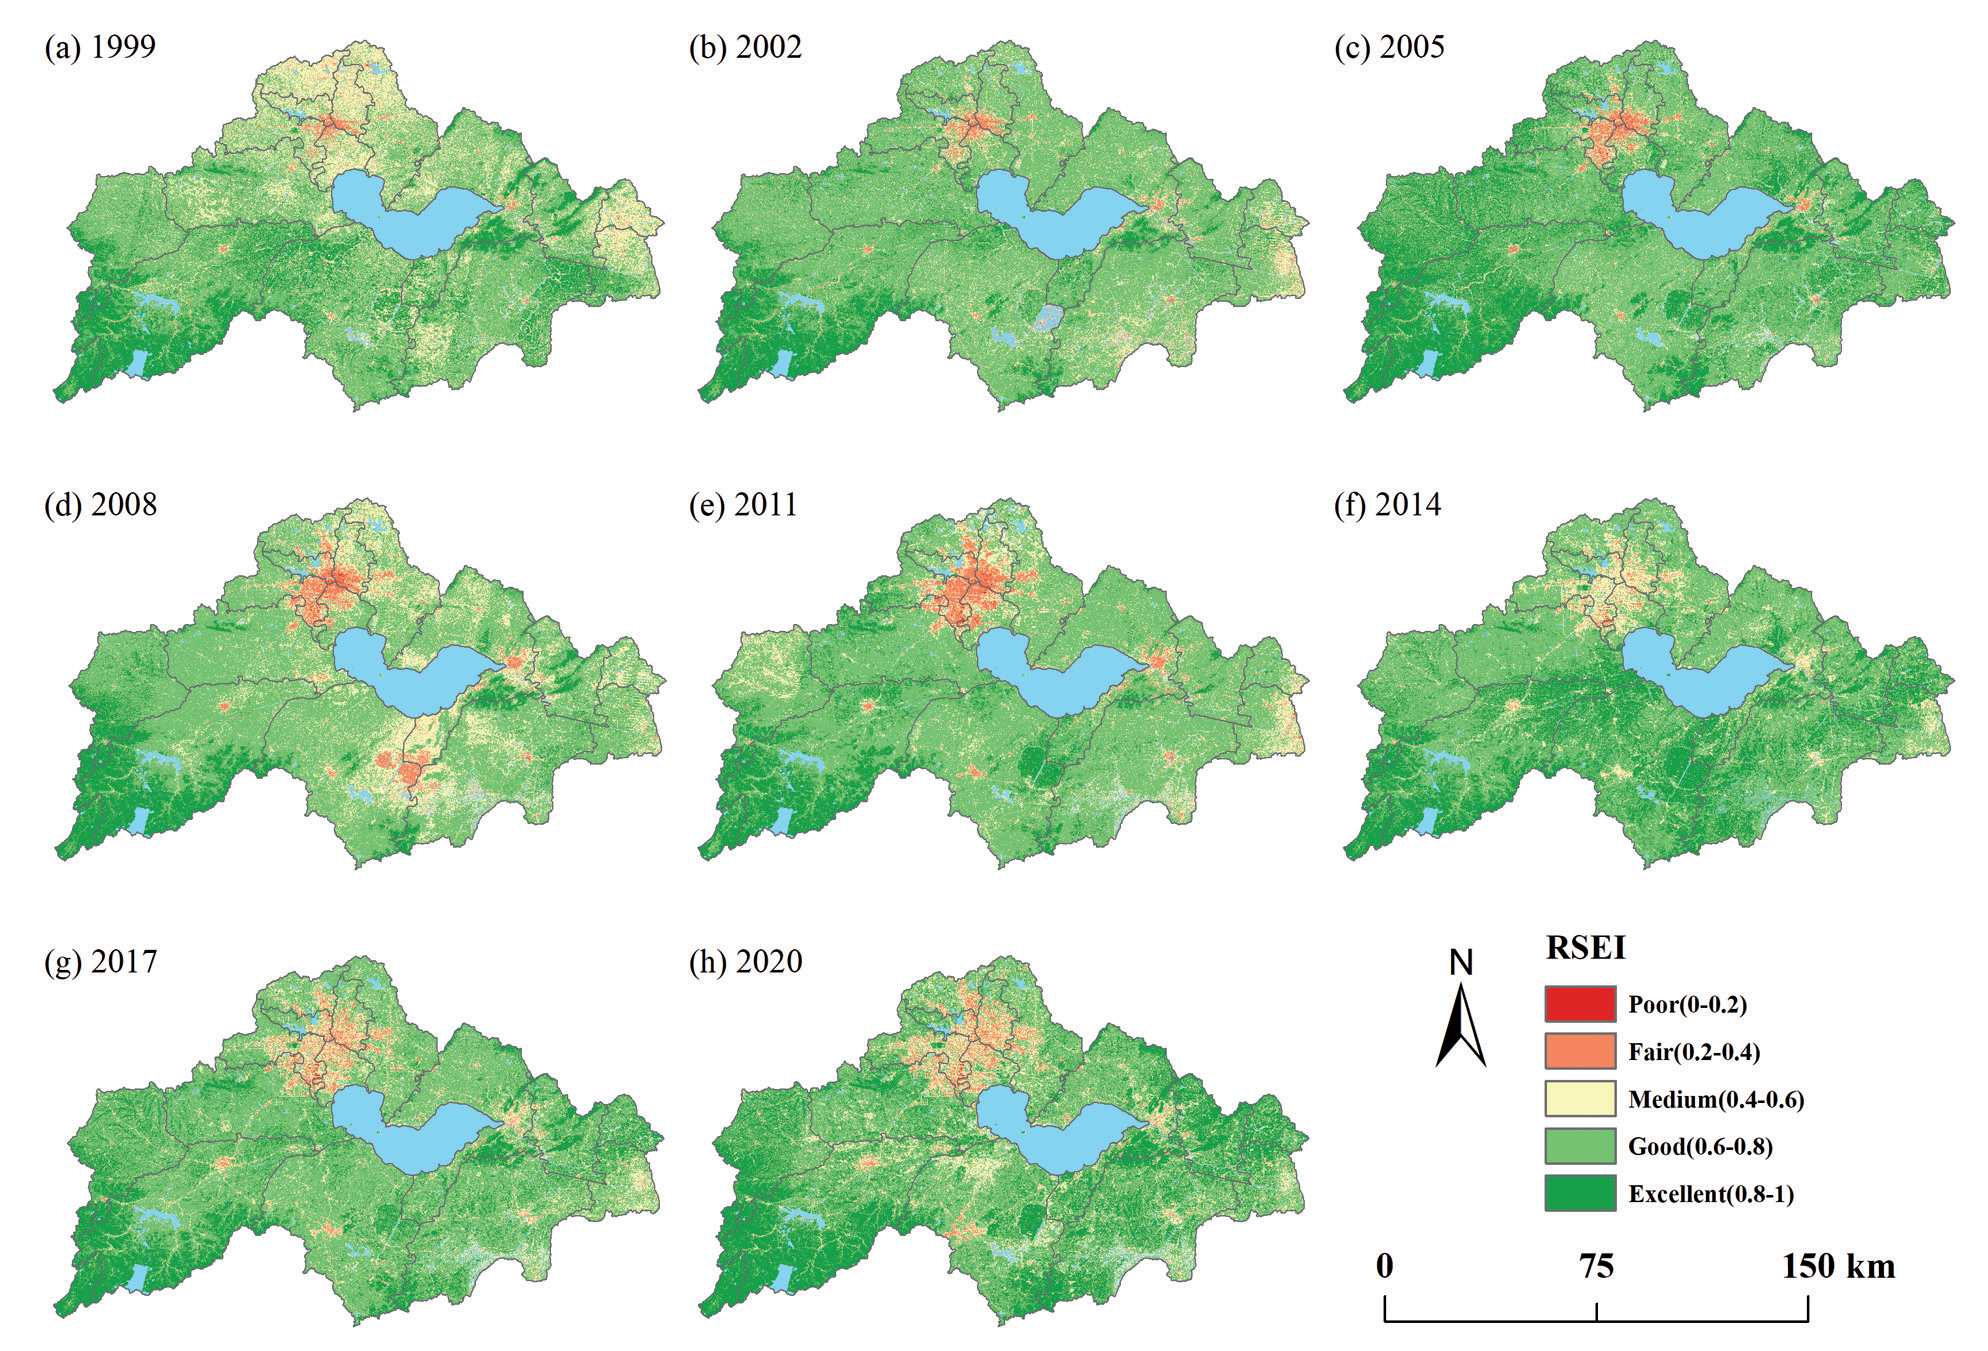
The ecological environmental quality of the Chaohu Lake Basin changed only slightly from 1999 to 2020, and the overall grade was mainly excellent and good (Fig. 4). The areas with poor ecological environmental quality were mainly concentrated in the north, and a few areas were in the south. These areas were mainly flat and concentrated in urban development areas. Areas with better ecological environmental quality were concentrated in the east and southwest. These areas were far from the urban center and are less disturbed. From 2005-2008, the urban center was expanding, and the ecological environment at the junction of Lujiang and Wuwei counties deteriorated, leading to a decline in ecological quality in 2008. In 2011, the ecological environment in this part of the region improved, and the RSEI average value rose. The ecological rise in the southern region in 2014 and the deterioration in the region in 2017 led to a slight decrease in the mean value of the RSEI in 2017.
Detection of Changes in Ecological Environmental Quality
The ecological and environmental quality of the Chaohu Lake Basin was mainly unchanged from 1999 to 2020 (Table 3), with an area of 6262.99 km2, accounting for approximately 50.71% of the area. Significantly worse and worse quality areas accounted for a relatively small proportion of the total area at 0.16% and 15.01%, respectively, indicating that the ecological environment quality of the Chaohu Lake Basin continued to improve from 1999 to 2020. The significantly better and better areas accounted for a relatively large proportion of the total area at 0.09% and 34.03%, respectively. An area of 4252.12 km2 deteriorated between 2005 and 2008, accounting for 34.23% of the total area. The area of better and significantly better areas accounted for less than 3% of the total area. During 2014-2017, the deteriorated area was 2603.05 km2, accounting for 20.92% of the total area, resulting in a slight decrease in ecological quality in 2017.
Spatially, the ecological environment of the Chaohu Lake Basin was mainly slightly better from 1999 to 2020 (Fig. 5), and significant deterioration and deterioration were mainly concentrated in the northern, southeastern, and southwestern regions. The ecological environment of the Chaohu Lake Basin mainly significantly changed and improved between 1999-2002 and 2002-2005. The ecological environment at the junction of Lujiang and Wuwei counties in the southern region deteriorated significantly from 2005 to 2008; from 2008 to 2011, the ecological environment in this part of the region became significantly better again. In 2014-2017, a slight deterioration in the ecological environment in the Chaohu Lake Basin occurred. The ecological environment of the Chaohu Lake Basin deteriorated mainly its northern part in the city of Hefei, where rapid increases in urbanization, economic development and population caused the ecological environmental quality to deteriorate.
Spatial Autocorrelation Analysis of Ecological Environmental Quality
The global Moran’s I index of the Chaohu Lake Basin from 1999 to 2020 was 0.27, 0.41, 0.30, 0.43, 0.56, 0.35, 0.31 and 0.21, respectively. The Z values were all greater than 2.58, and the p values were all less than 0.01, indicating that the ecological environmental quality of the Chaohu Lake Basin showed a global autocorrelation at the 99% confidence level. The global Moran’s I index increased from 1999 to 2002, indicating that the spatial correlation of ecological quality in the Chaohu Lake Basin increased. The spatial correlation of ecological quality in the Chaohu Lake Basin increased and then weakened from 2005 to 2020.
Table 3.
Changes in ecological classification differences in the Chaohu Lake Basin from 1999 to 2020.
Fig. 5.
Detection of spatial and temporal variations in the RSEI in the Chaohu Lake Basin from 1999-2020.
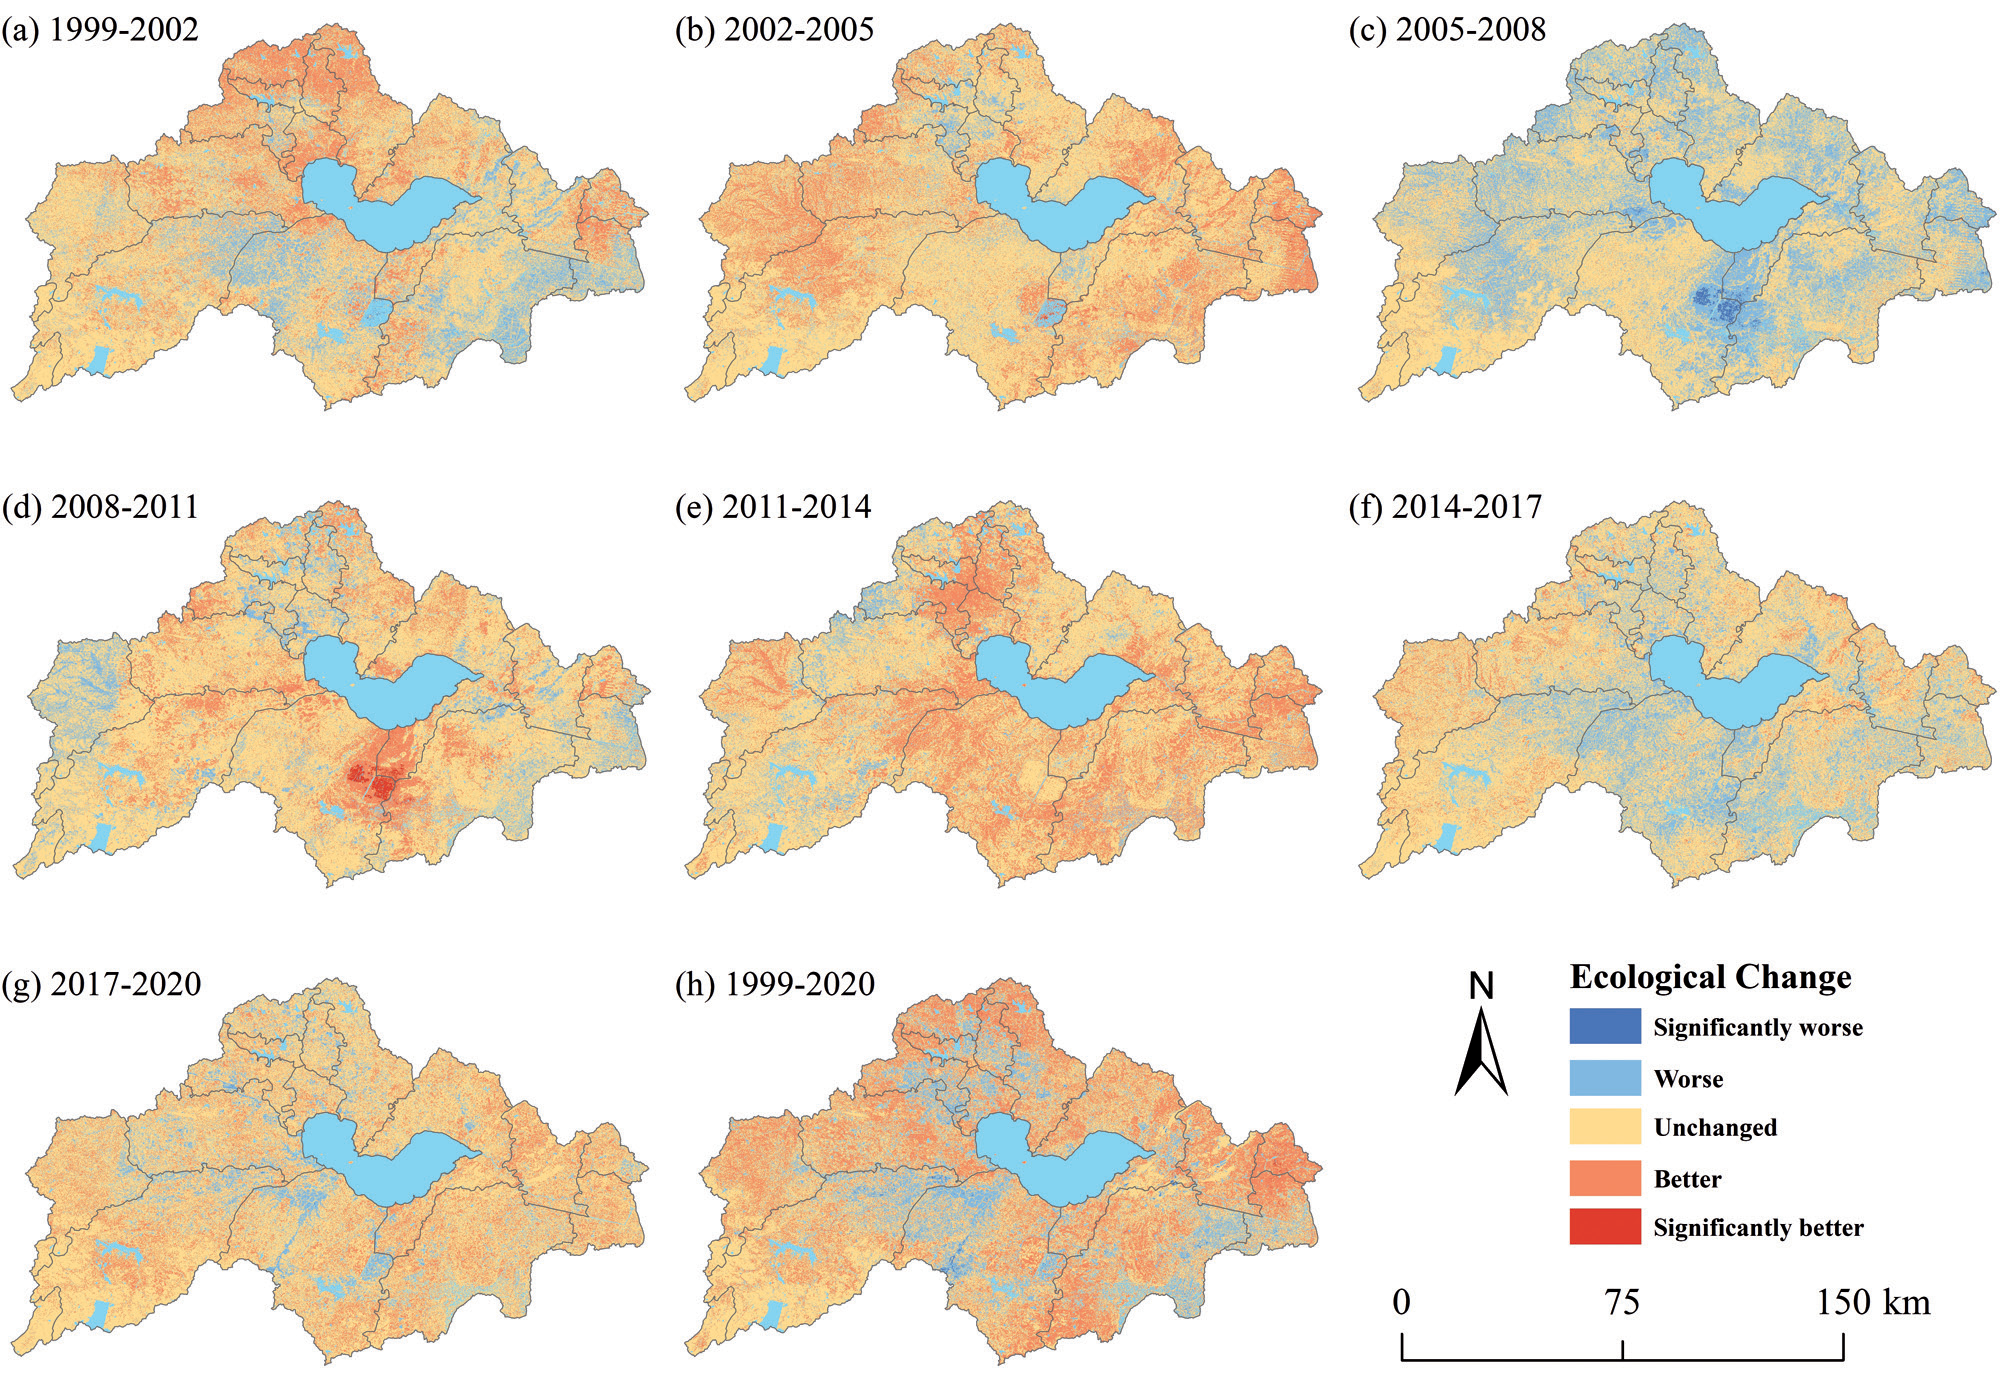
Table 4.
Global Moran’s I index of ecological and environmental quality in the Chaohu Lake Basin from 1999 to 2020.
| Year | Moran’s I | Z | P |
|---|---|---|---|
| 1999 | 0.27 | 546.28 | 0.00 |
| 2002 | 0.41 | 663.73 | 0.00 |
| 2005 | 0.30 | 511.65 | 0.00 |
| 2008 | 0.43 | 625.57 | 0.00 |
| 2011 | 0.56 | 632.54 | 0.00 |
| 2014 | 0.35 | 415.95 | 0.00 |
| 2017 | 0.31 | 455.52 | 0.00 |
| 2020 | 0.21 | 335.79 | 0.00 |
The ecological quality of the Chaohu Lake Basin during 1999-2020 was mainly unchanged, with an area of approximately 6262.99 km2, accounting for approximately 50.71% of the total area. The total area with improved ecological quality was 4212.66 km2, accounting for approximately 34.11%; the total area with deteriorated ecological quality was 1874.29 km2, accounting for approximately 15.18%. There was an obvious spatial aggregation of both ecological quality improvement areas and ecological quality degradation areas. The ecological quality deterioration areas were mainly distributed in the northwestern part of Lujiang County, the municipal district of Hefei city and the northeastern part of Wuwei County; the ecological quality improvement areas were mainly distributed in the southwestern part of Wuwei County, the northwestern part of Feidong County and Hexian.
The LISA clustering diagram shows that the “high-high” clustering and “low-low” clustering characteristics were most obvious during 1999-2020. In the northwestern part of Lujiang County, Hefei city and the northeastern part of Wuwei County, the clustering distribution was “low-low”, while in the southwestern part of Wuwei County, the northwestern part of Feidong County and Hexian, the clustering distribution was “high-high”. The two types of agglomeration distribution areas corresponded to the distribution areas of ecological and environmental quality changes, and combined with the land use changes in 1999 and 2020, the main reason for the formation of the “low-low” agglomeration area was the significant degradation of the ecological and environmental quality of the Chaohu Lake Basin due to urbanization and development; in addition, the main reason for the formation of the “high-high” agglomeration area was the improvement in the green area of forests and grasslands, and the ecological environmental quality of the Chaohu Lake watershed significantly improved because of the distance from urban centers and decreased interference from human activities.
Analysis of Factors Affecting the Quality of the Ecological Environment
Factor Detection Analysis
All q values were greater than 0.01, and the p values were 0, indicating that the detection factors had a strong explanatory effect on the spatial heterogeneity of the ecological environmental quality in the Chaohu Lake Basin (Table 5). The degree of influence of each factor on ecological environmental quality was ranked as X5>X1>X4>X3>X2>X6>X7, in the order of land use type, elevation, mean annual precipitation, mean annual temperature, slope, economic density and population density. Among them, the q value of the land use type factor reached 0.401, indicating that in comparison to the other factors, land use type had a greater influence on the ecological and environmental quality of this study area, and the population density factor had the weakest influence on the spatial heterogeneity of the RSEI, with a q value of 0.084.
Interaction Detection Analysis
The interaction of any two influencing factors had a greater influence on the ecological quality of the Chaohu Lake Basin than a single influencing factor (Fig. 7), indicating that the ecological quality of the Chaohu Lake Basin was related to the interaction of factors such as economic density and population density.
Discussion
It was found that the ecological environmental quality of the Chaohu Lake Basin fluctuated continuously from 1999 to 2020, with the average value of the RSEI ranging from 0.66 to 0.74; the ecological environmental quality of the Chaohu Lake Basin increased in 2020 compared with that in 1999, which indicates that the ecological environmental management of the Chaohu Lake Basin achieved certain results during this period. The overall ecological environmental quality of the Chaohu Lake Basin was good, and the areas with better ecological environmental quality were distributed in the east and southwest; the ecological environmental quality of the municipal area in Hefei was poor, mainly due to the expansion of urbanization, social and economic growth, construction and bare soil in recent years, which have caused more serious damage to the ecological environment of the municipal area of Hefei. In 2011, Chaohu city was incorporated into Hefei city, and as a result, Hefei became the only provincial capital city in China with one of the five major freshwater lakes. In the past ten years, the ecological environmental management of Chaohu Lake Basin has become an important task for Anhui Province, and the province has introduced policies such as “Regulations on Water Pollution Prevention and Control in Chaohu Lake Basin” and “Implementation Plan for Comprehensive Management of Chaohu Lake” to promote urban development while paying more attention to ecological environmental protection; thus, the ecological environment of Chaohu Lake Basin has improved each year.
Fig. 6.
Regions with hotspots of ecological quality changes in 1999~2020: a) RSEI changes in 1999~2020, 1~3 and 4~6 are the regions of rising and falling RSEI, respectively; b) different spatial correlations reflected by local Moran’s I; (c1-c6), (d1-d6), (e1-e6), (f1-f6) are the corresponding 6 regions in a) zoomed-in subplots to present the RSEI changes, spatial correlations, land use types in 1999 and in 2020.
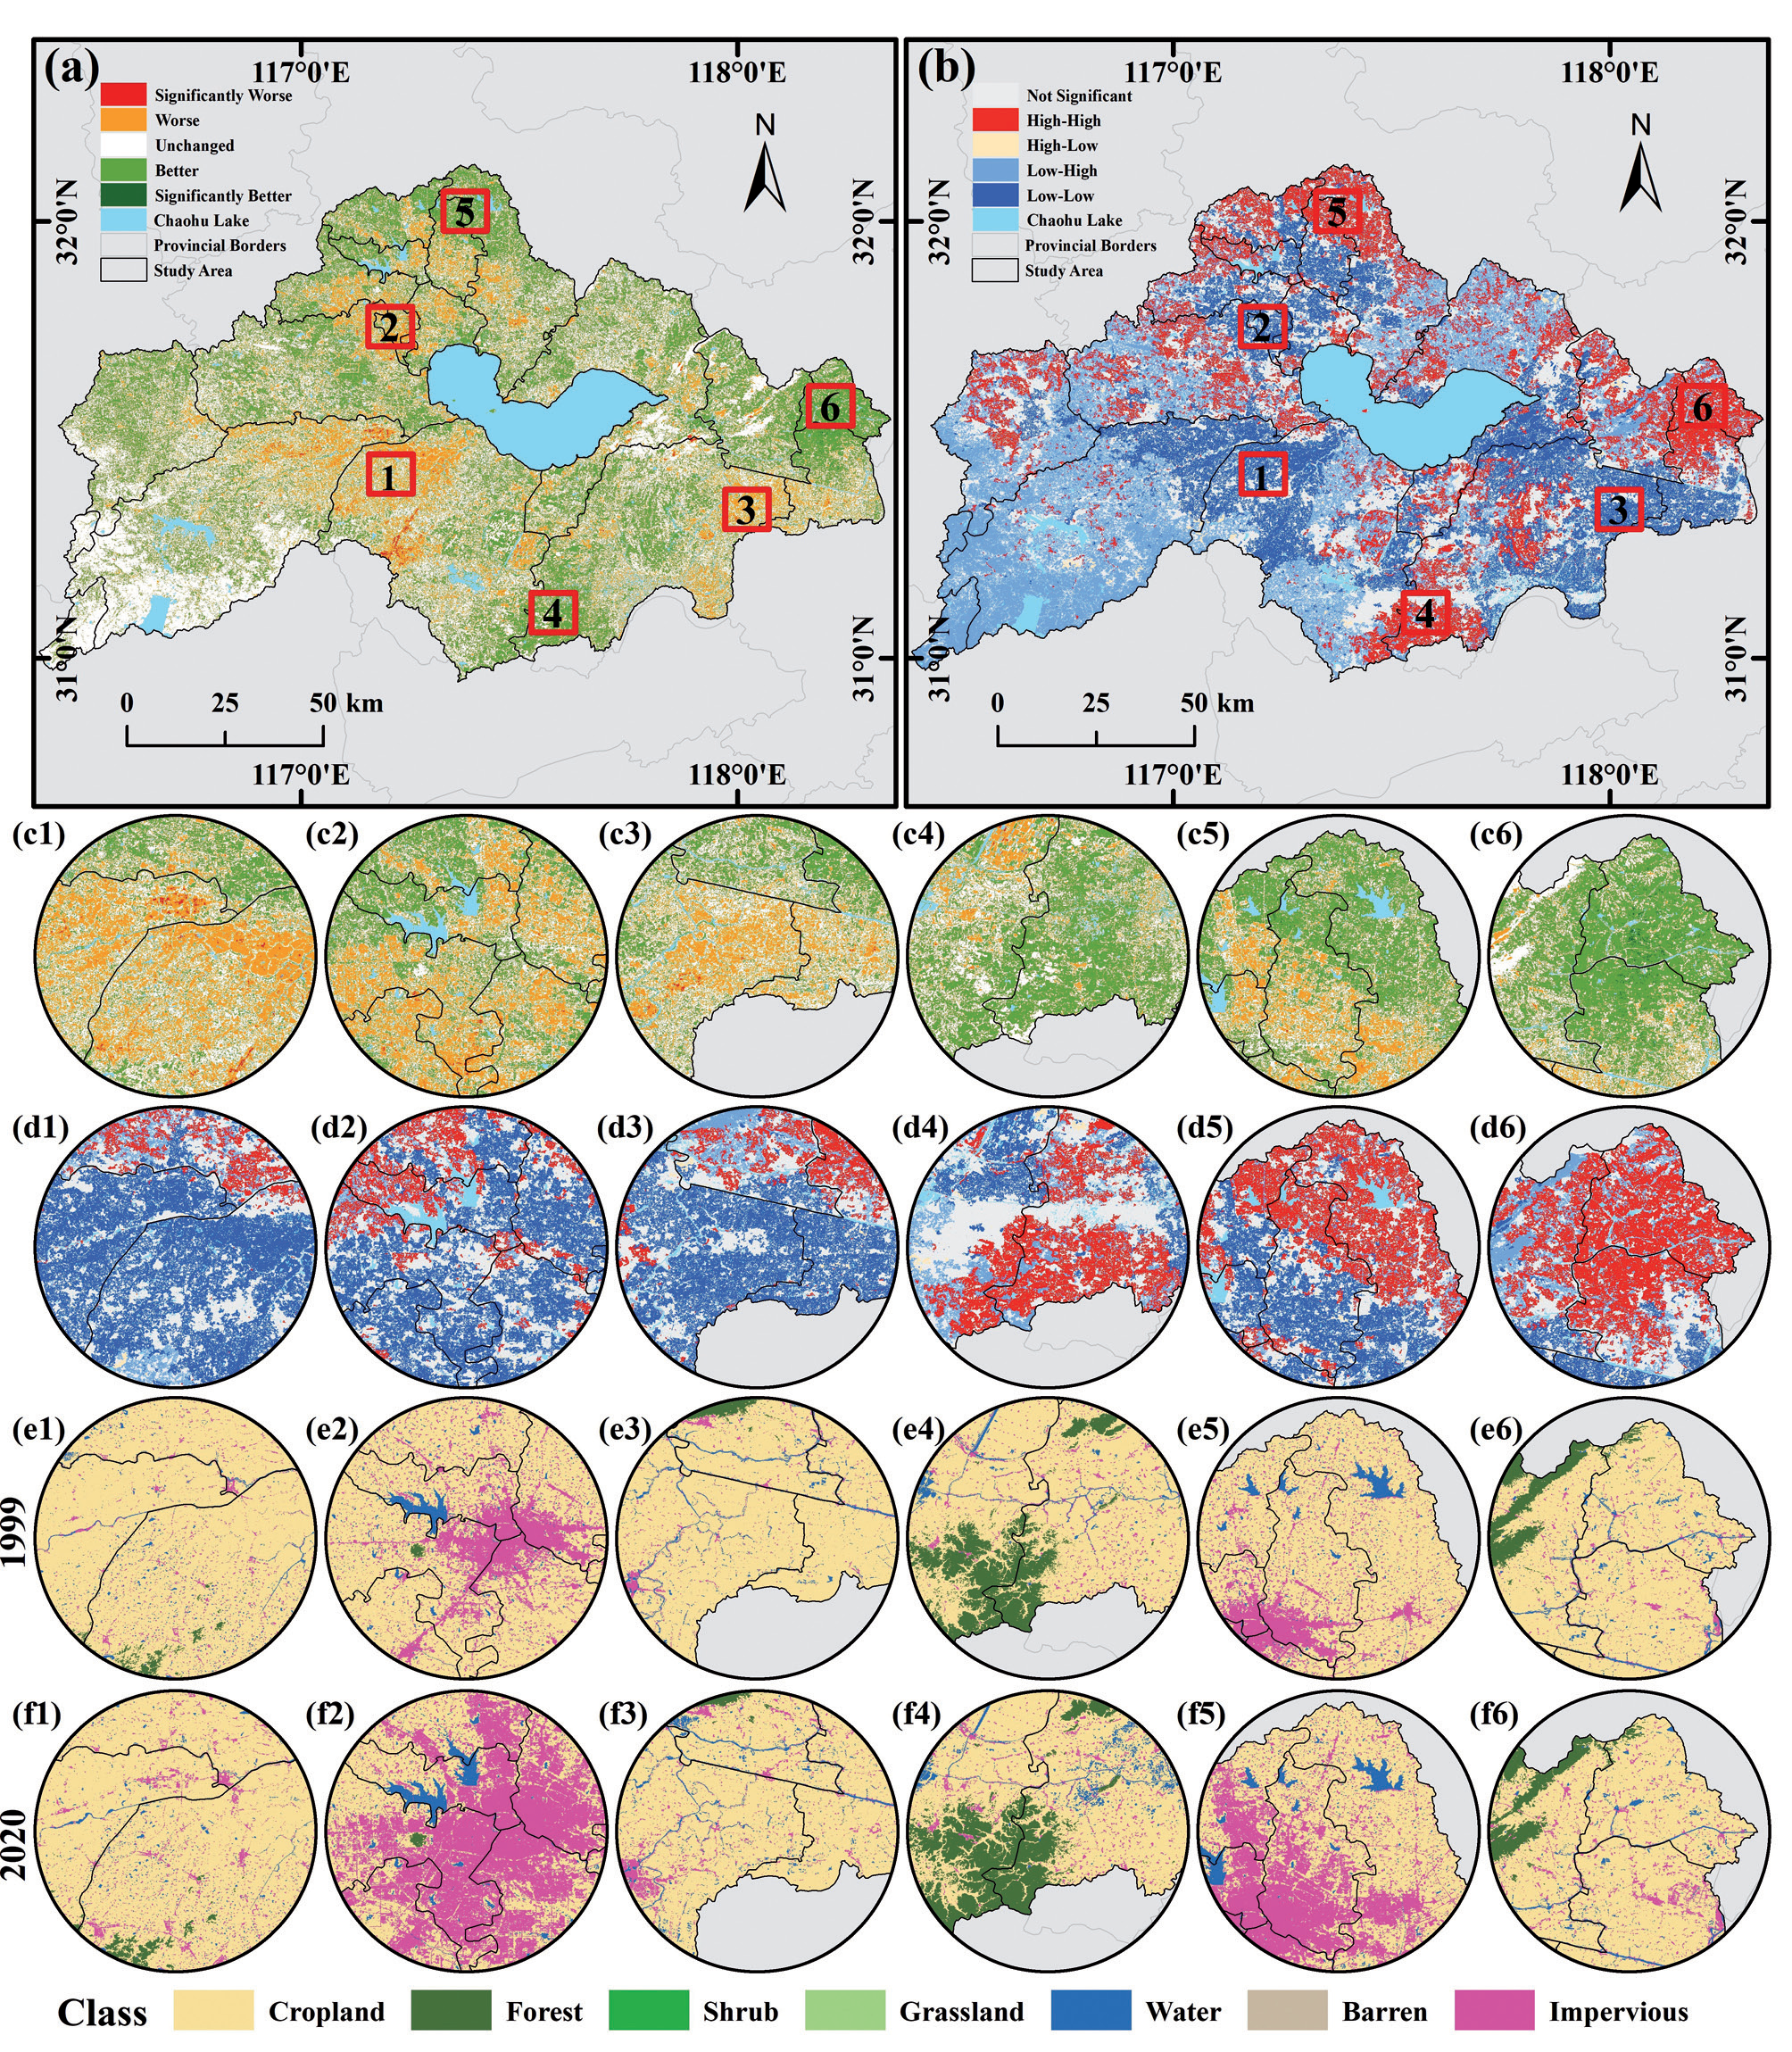
The ecological environmental quality of Chaohu Lake Basin had a significant positive spatial correlation, with the “high-high” concentration area mainly concentrated in Wuwei County and He Xian, where human activities have less influence and therefore the ecological environmental quality was better; the “low-low” concentration area was mainly concentrated in Hefei city, where the ecological environmental quality was poor from urban development and human activities.
Table 5.
Factor detection results.
| X1 | X2 | X3 | X4 | X5 | X6 | X7 | |
|---|---|---|---|---|---|---|---|
| q statistic | 0.277 | 0.163 | 0.207 | 0.249 | 0.401 | 0.154 | 0.084 |
| p value | 0 | 0 | 0 | 0 | 0 | 0 | 0 |
Fig. 7.
Interaction detection and ecological detection results. In the figure, X1: elevation; X2: slope; X3: average annual temperature; X4: average annual precipitation; X5: land use type; X6: economic density; X7: population density. Y: significant, N: not significant.
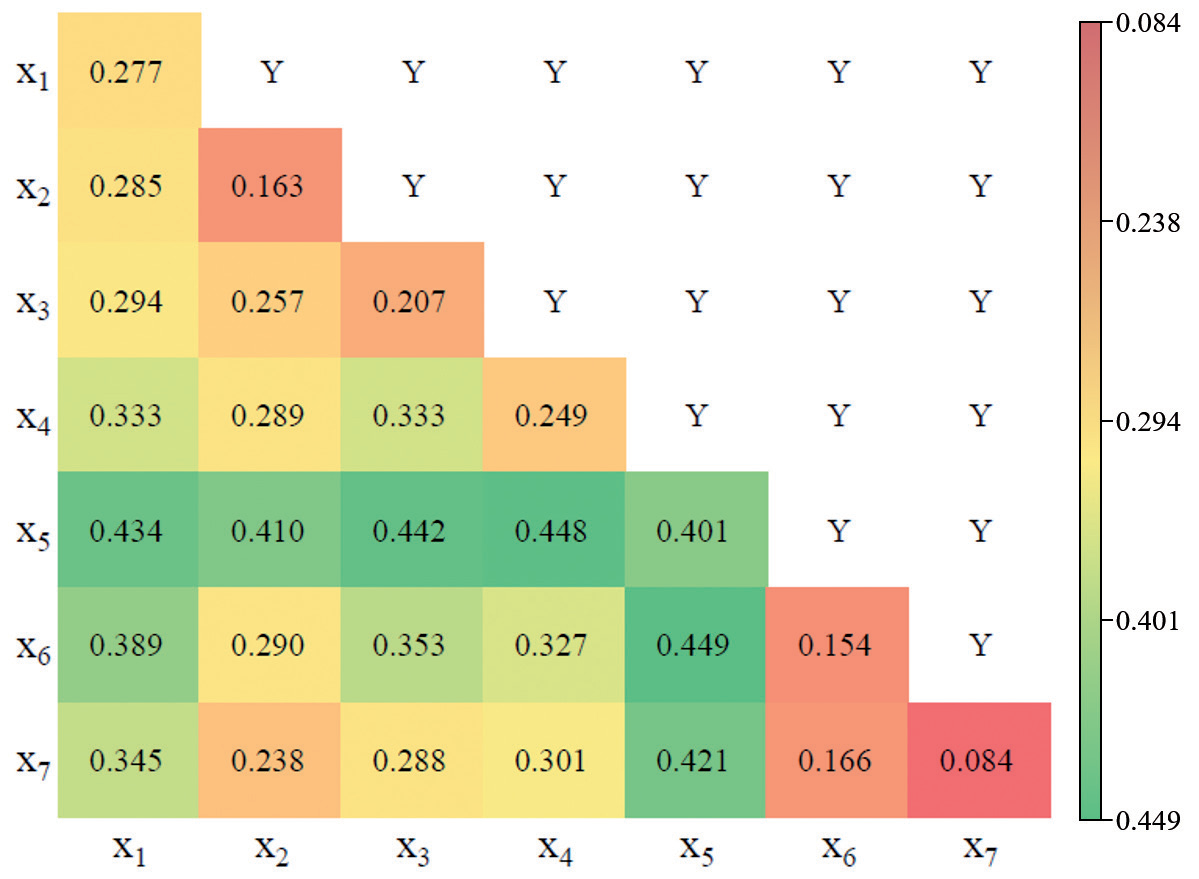
The ecological environmental quality of Chaohu Lake Basin is influenced by many factors, and the interaction of any two influencing factors had more influence on the ecological environmental quality of Chaohu Lake Basin than a single influencing factor. It was observed that land use types had the most significant influence on the ecological environmental quality. Land use type was identified as a key driver of the ecological conditions in the Chaohu Lake Basin, emphasizing the need for careful consideration of land use planning and management to ensure the protection and restoration of the ecological environment, particularly in the context of urbanization and economic development. The interaction detection analysis emphasized the importance of considering the interplay between different influencing factors. Specifically, the interaction between economic density and population density was found to have a significant influence on the ecological quality. This highlights the need for integrated approaches that account for the complex interactions between demographic, economic, and ecological factors. These findings are consistent with previous research highlighting the significance of land use, topographical features, and climatic factors in shaping ecological environmental quality. However, the present study provides a more comprehensive understanding of their combined influence and interactions in the Chaohu Lake Basin. For future research, it is recommended to consider additional factors, such as water quality and biodiversity, which could further enhance the understanding of the ecological environmental quality in the region. Additionally, conducting longitudinal studies to evaluate the effectiveness of environmental management practices and policies implemented in the area would be beneficial for future decision-making processes. By conducting a comprehensive analysis of the influencing factors, their interactions, and implications, this study contributes to the existing literature on the ecological environmental quality in the Chaohu Lake Basin and provides insights for sustainable ecological management in the region.
Because of the uncertainty and complexity of ecological environmental quality, this study also had some limitations that need to be improved: the remote sensing image data used in this paper were all Landsat series, and as single data type was used; a subsequent study can use multisource remote sensing image data and high-resolution remote sensing images for comprehensive evaluation of remote sensing ecological environmental quality. In addition, this paper used the traditional four indicators of greenness, humidity, dryness and heat to evaluate and analyze the ecological environmental quality of the Chaohu Lake Basin but did include new ecological environmental indicators according to the topography and climate of the Chaohu Lake Basin and other related factors. Subsequent studies can be further enhanced to improve the accuracy of the ecological environmental quality evaluation of the Chaohu Lake Basin.
Conclusions
In this paper, based on the GEE remote sensing cloud platform, cloud-free images were constructed using minimum cloud synthesis; four ecoenvironmental indicators of greenness, humidity, dryness and heat are calculated; and a remote sensing ecoindex was constructed using principal component analysis to analyze the spatial and temporal changes in ecoenvironmental quality in the Chaohu Lake Basin from 1999 to 2020. The main conclusions are as follows:
(1) Temporally, the mean value of the RSEI in the Chaohu Lake Basin fluctuated during the twenty-one years of analysis, with a sharp decline in 2008 and a slight decline in 2017 but an overall improving trend; spatially, the ecological environmental classification of the Chaohu Lake Basin was mainly excellent and good, and the ecological environment quality in the municipal district of Hefei, in the northwestern part of the Chaohu Lake Basin, was poor.
(2) The ecological environment quality of Chaohu Lake Basin showed a clustering trend in global autocorrelation, with significant positive spatial correlation; in terms of local autocorrelation, the “high-high” and “low-low” clustering characteristics were most obvious from 1999 to 2020.
(3) The results of the geodetector analysis indicated that the main influencing factors on the ecological quality of the Chaohu Lake Basin were economic density, land use and population density, and there were significant differences in the spatial distribution of anthropogenic factors on the ecological quality of the Chaohu Lake Basin under the interaction of two factors.

