

Introduction
Ecosystem service value (ESV) is closely related to human well-being and has a seemingly immeasurable value [1, 2]. The United Nations Millennium Ecosystem Assessment brought together more than 1300 scientists from all over the world [3]. Since then, the 15th Sustainable Development Goal (SDG) has continued to highlight the protection, maintenance, and promotion of sustainable use of terrestrial ecosystem services [4]. Over the past decades, industrialization and urbanization have affected land cover and altered ecosystem structure, triggering ecological problems such as land degradation, climate change, biodiversity loss, and ecological quality [5, 6], which have negatively impacted ecosystem services [7]. China's accelerated urbanization process, economic development, and human activities have had a profound impact on the natural environment, which has resulted in significant changes in land use landscape patterns and led to changes in ecosystem structure and function [8]. The magnitude of the service value that ecosystems can provide is influenced by various factors, among which changes in land use type have a greater impact on the ability of ecosystems to provide service value, as well as on the composition and structure of ecosystems [9]. The study of ESV changes, in turn, can help determine land use planning and rational management of natural resources [10], and can provide a reference for the rational use of environmental resources and ecological policy formulation. In recent 20 years, the spatial quantification of land use change and the ESV has become a research hotspot in ecology, land science and geography [11], which can determine regional sustainable development. Therefore, it is important to carry out the ESV assessment for optimizing the land use structure and formulating ecological protection and ecological compensation policies.
At present, the ESV assessment system is gradually maturing [12, 13]. The existing literature on ESV assessment methods includes the unit area value assessment method [12] and some series of remote sensing modeling methods [14]. Among them, the former is a static assessment method, which is insufficient to grasp the dynamic characteristics of regional ESV. The latter is a dynamic assessment method based on remote sensing technology, which can assess the pattern of regional ESV and its analysis of dynamic change patterns. Costanza et al. were the first to systematically assess the functional value of global ESs using the unit area value assessment method in 1997 [1]. Overall, the present unit area value assessment methods for regional ESV estimation can be divided into two categories: the functional price per unit area service value method [15] and the method based on the unit area value equivalent coefficient [16]. The latter method has been favored by many scholars because of its advantages such as rapid assessment and intuitive and easy to understand results [11, 12]. The existing studies on ESV mainly focus on ESV assessment [17] and spatial correlation analysis [18]. The studies on ESV influencing factors can be broadly divided into two categories. Firstly, the relevant indicators were selected, an indicator system was established, and correlation or regression analysis was applied to explore the main influencing factors of ESV [17]. Secondly, the spatial and temporal variation characteristics of ESV were analyzed based on the land use change [19]. For instance, Li et al. analyzed the land use and ecosystem service value changes in the Weibei dry plateau area of Shaanxi [20]; Wang et al. studied the impact of land use changes on ecosystem service values in the Guangxi section of the Pearl River-Xijiang Economic Belt based on the county scale [21]. On the whole, exploring changes in land use area, land use patterns and land use spatial patterns has become the main direction for scholars to analyze the formation mechanisms and driving mechanisms of different ESs and to optimize land use allocation [22, 23].
The natural environment and resources of the arid region in Northwest China are vastly disparate from those of the coastal region and unbalanced with other regions [24]. It is one of the three natural regions in China, with vegetation dominated by deserts and desert grasslands, and is also an important base for food and livestock production. Driven by national policies and other factors, including the western development and the project of returning farmland to forest and grass, the region has undergone significant land use changes (cropland expansion, grassland degradation and construction land expansion, etc.) [25]. A review of the literature revealed that early studies focused on the effects of small-scale land use changes on ESV, for example, in the Ebinur Lake Basin, Xinjiang [26], the oasis wetlands in arid areas [27], the Hotan area [28], and the Yili River Basin [29]. However, the long-term dynamic monitoring of ESV and its spatial and temporal response to land use types in the Northwest Arid Regions of China at the macro scale is still unclear. Therefore, this study analyzed the historical transition characteristics and spatial patterns of the ESV in the arid region of Northwest China from 1990 to 2020 based on the China Land Cover Dataset (CLCD), and revealed the effects of different types of land use change on the ESV in different periods. Compared with previous research results, this study revealed the long-term annual dynamic variation and spatial-temporal patterns of ESV in the arid region of Northwest China, and distinguished the analysis of the impact of cropland expansion, grassland degradation and built-up land expansion on the ESV, filling a gap in the related field in this region.
Materials and Methods
Study Area and Land Cover Datasets and Processing
The arid region of Northwest China mainly includes the Xinjiang Uygur Autonomous Region, the central and western parts of the Inner Mongolia Autonomous Region and most of the Ningxia Hui Autonomous Region and the Hexi Corridor of Gansu Province. Rainfall is scarce, except for the western part of the Tianshan Mountains and the eastern part of the Qilian Mountains, where annual precipitation is less than 250 mm. The climate is arid, with high annual evaporation of 800 to 2400 mm and 2560 to 3500 hours of sunshine. This region is one of the three natural regions in China, and the vegetation is mainly desert and desert grassland. Meanwhile, the water system in the region is extremely undeveloped, mostly endorheic, and the lakes are mostly brackish or salt lakes. It is mainly irrigated by high mountain ice and snow melt water, except for Yinchuan and the Loop Plain, and the basic mode of current agriculture is oasis irrigated agriculture, which is an important base for food and livestock [24, 32].
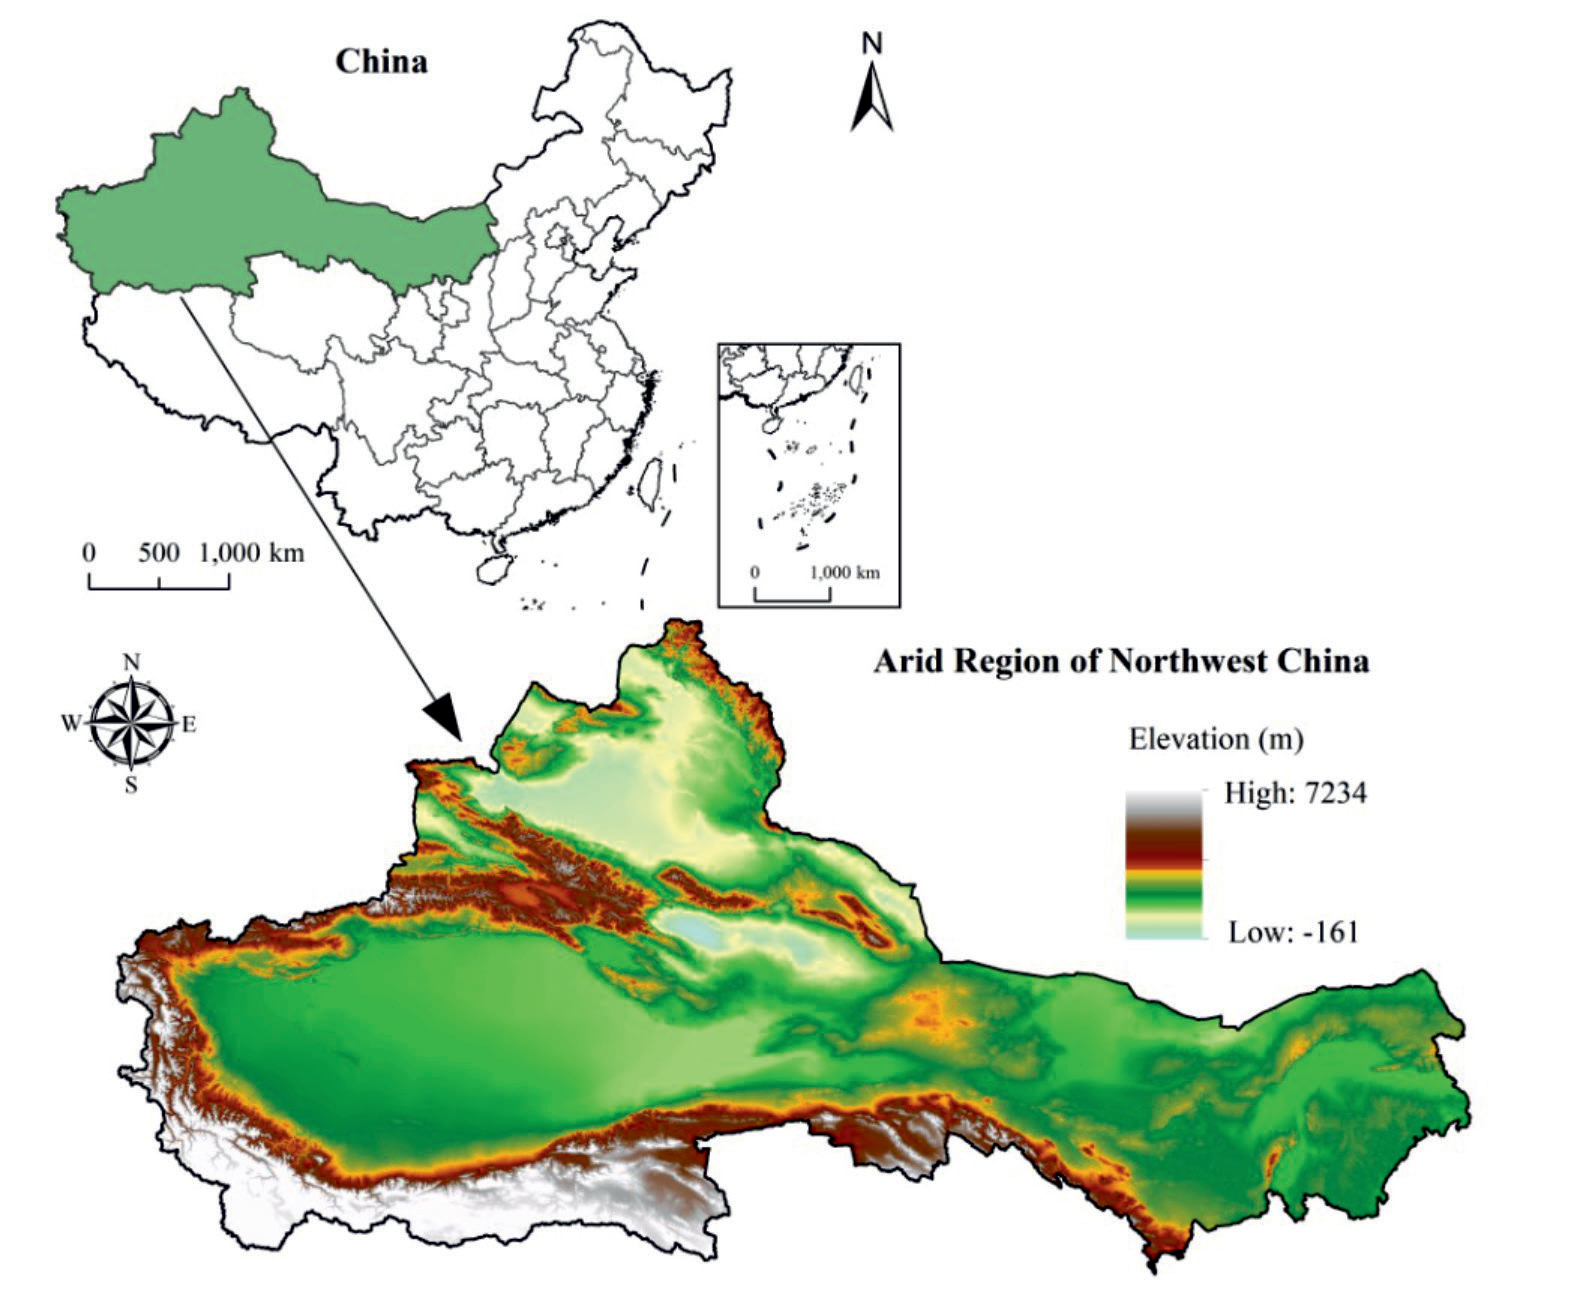
Land cover data for the study area from 1990 to 2020 were obtained from the first Landsat-derived annual CLCD (Chinese land cover datasets) produced on the GEE platform [33]. The CLCD reflects the rapid urbanization and a series of ecological projects in China, revealing the anthropogenic influence on the land cover under climate change conditions, and its use in regional ecosystem change studies has It has potential application value in regional ecosystem change studies. This dataset has a higher temporal resolution than other existing products (Globeland 30, Chinese land use remote sensing monitoring data, etc.) and can be collated to estimate long-term continuous ESV. Taking into account the demands of the ESV assessment, this study divided the 9 original land cover types into 7 categories, including cropland, forestland, grassland, water area, wetland, built-up area, and barren land. The boundary data of the arid region of Northwest China were obtained from the Resource and Environment Science and Data Center (https://www.resdc.cn). In addition, the unit area grain yield and average grain price data were collected from the Xinjiang Statistical Yearbook, Gansu Development Yearbook, Ningxia Statistical Yearbook, Inner Mongolia Statistical Yearbook, and the national compilation of agricultural cost-benefit information in 2021.
Calculation of ESV
Benefit Transform Method
Costanza et al. proposed a methodological system for assessing the ESV at a global scale [1]. However, since this system is not fully applicable to the local ESs in China, Xie et al. modified the ESs classification and ecosystem equivalence tables according to the expertise of more than 700 ecologists to be suitable for estimating the ESV of Chinese regions [16, 34]. The equivalent ESV of cropland food production was set to 1, and the relative importance to cropland (equivalence factor) was used to determine the equivalent ESV factor of other ESs. In addition, the equivalent economic value of the ESV was determined as 1/7 of the market value of the regional average annual food production [35, 36]. The formula was calculated as follows:
Where ESV is the total ecosystem value of ESs; Ai is the area of the ESs; VCi represents the value coefficient of cropland corresponding to the i-th service; and i is ecosystem service types. VCi is calculated as follows:
Table 1.
Value per unit area of ESs in China (US$/hm2/yr).
Table 2.
Changes of the sensitivity index of ESV in the study area from 1990 to 2020.
where ECi denotes the equivalent coefficients per unit area; and P and Q are the national average grain price and national average grain production, respectively. Hence, the VCi of each type and each function were calculated, as listed in Table 1.
Sensitivity Analysis
To identify the dependence of ESV on the ecosystem value coefficient, sensitivity analysis was performed using the concept of elasticity coefficient in economics [37, 38]. In this study, the corresponding sensitivity coefficient (CS) for each land cover type was adjusted by 50% [17] and calculated as follows:
Where CS is the sensitivity index; ESVi and ESVj represent the initial and adjusted values, respectively; and k represents the land cover type. If CS>1, the estimated ESV is considered elastic with respect to this coefficient, while if CS<1, the estimated ESV is considered inelastic and the results are reliable even if the value coefficients exhibit relatively low accuracy. As shown in Table 2, CS was less than 1 in all cases, indicating that the total estimated ESV in this study was inelastic with respect to the adjusted ecosystem value coefficient. Therefore, the value coefficients used in this study apply to the arid region of Northwest China with some credibility.
Hotspot Analysis of ESV
The hotspot analysis has been commonly used to identify locations of statistically significant high-value clusters (hotspots) and low-value clusters (coldspots) of ESV change areas by aggregating points of occurrence that are in close proximity to one another [39]. This study used the Getis-Ord Gi* statistic to detect the spatial dynamics of ESV in the arid region of Northwest China, and the formula was calculated as follows:
Where wij(d) is the spatial weight coefficient of the spatial evaluation unit; E(Gi*) and Var(Gi*) are the mathematical expectation and variance of the Gi* values, respectively. We implemented hotspot analysis in ArcGIS 10.2 (ArcToolbox/Spatial Statistics Tools/ Mapping Clusters/Hotspot Analysis). According to the calculated results, if the Z-score is positive and significant, it indicates that the value of the ESV change around location i is relatively high (above average), thus representing high-valued ESV change clusters. Conversely, if the Z-score is negative and significant, it documents that the ESV change around location i is relatively low and belongs to the low-valued ESV change clusters.
Contribution of Land Cover Types on ESV
The ecological contribution rate (CR) reflects the impact of ESV of different land cover types on the regional total ESV change in a certain period and can be used to reveal the main contributing factors affecting the regional ESV change [40, 41]. The calculation equation is as follows:
Where CR denotes the ecological contribution of land type i in time t; is the amount of ESV change of land type i in time t. If the CR value is higher, it means that the land cover type change has a significant impact on regional ESV. Conversely, the effect of land cover type change on regional ESV is relatively weak.
Land Cover Type Change Trajectory Analysis
The land cover change trajectory analysis method is a method that can be used to analyze the dynamic changes of an attribute within a time series. The changing trajectory involved in the time series process can be represented using a trajectory code that can represent the land use type corresponding to the corresponding raster in the land use classification map for each period [42]. This method has been widely used in the related research fields of cropland pattern change [43], ecological land loss [42], and cropland expansion [44]. In this study, this method was used to analyze the impact of different land cover change types on ESV from 1990 to 2020, especially the effects of cropland expansion, grassland degradation and construction land expansion on ESV. The calculation equation is:
Where LC represents the full-phase land use change trajectory code; Pi is the land use data corresponding to value i; and i represents the number of time nodes within the study time series (n>1).
Results
The ESV of Different Land Cover Types and Functions from 1990 to 2020
Annual Variation Characteristics of ESV
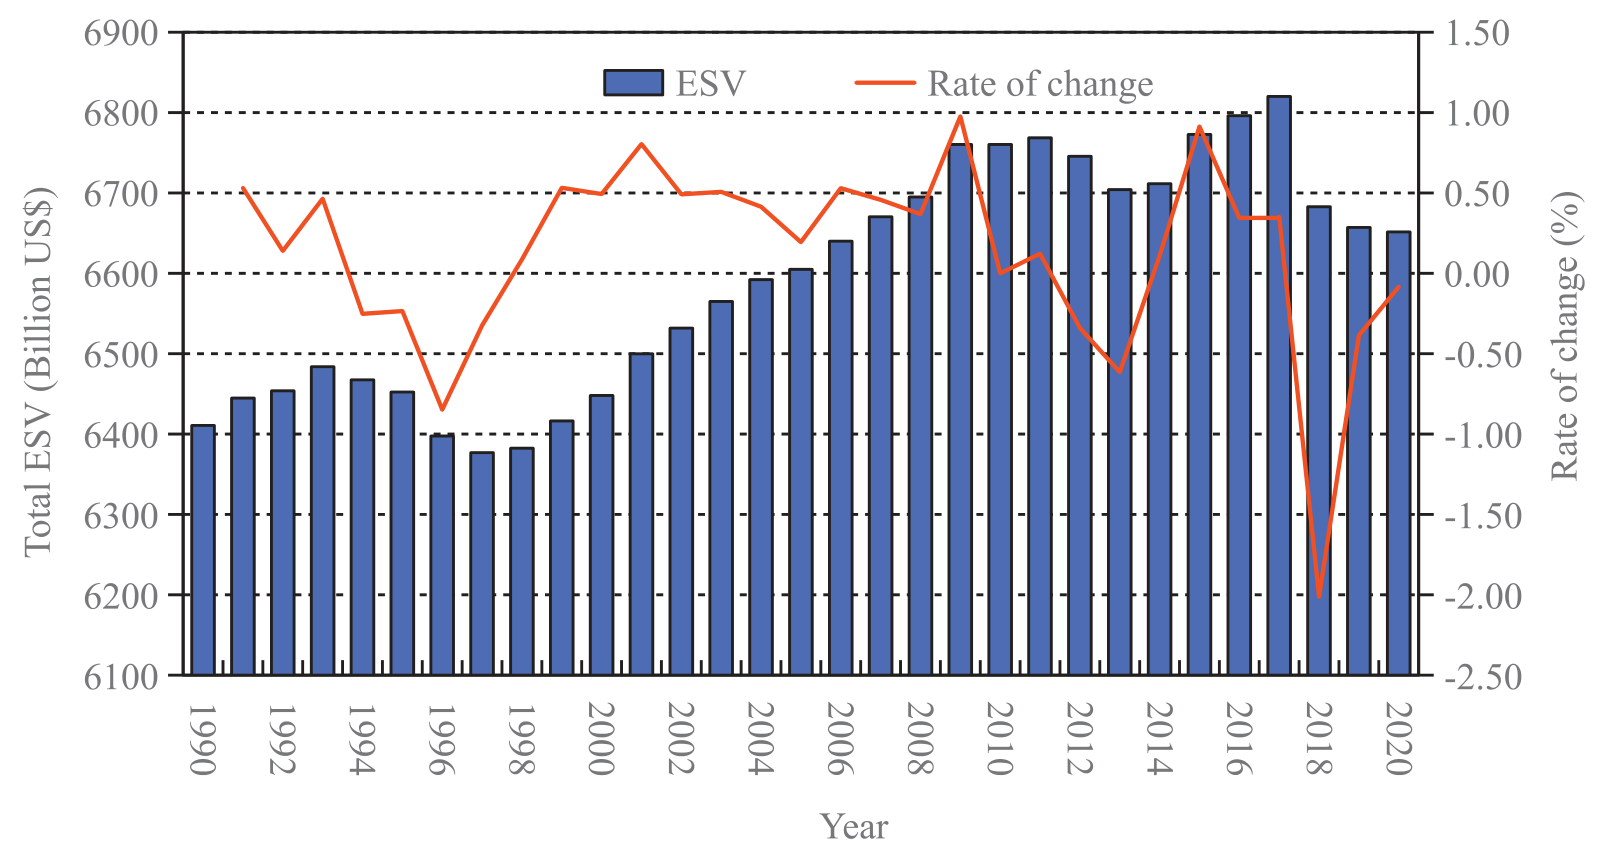
The total ESV and the rate of change in each year from 1990 to 2020 in the arid region of Northwest China are shown in Fig. 2. The results demonstrate a fluctuating upward trend, increasing from 6410.75 billion US$ in 1990 to 6651.57 billion US$ in 2020, an increase of 240.82 billion US$, with an increase of approximately 7.8 billion US$ per year. The increase, however, is not always continuous. Temporary decreases were observed in 1994-1997, 2012-2014, and 2018-2020, with ESV decreasing by 60.90 billion US$, 34.08 billion US$, and 31.33 billion US$, respectively.
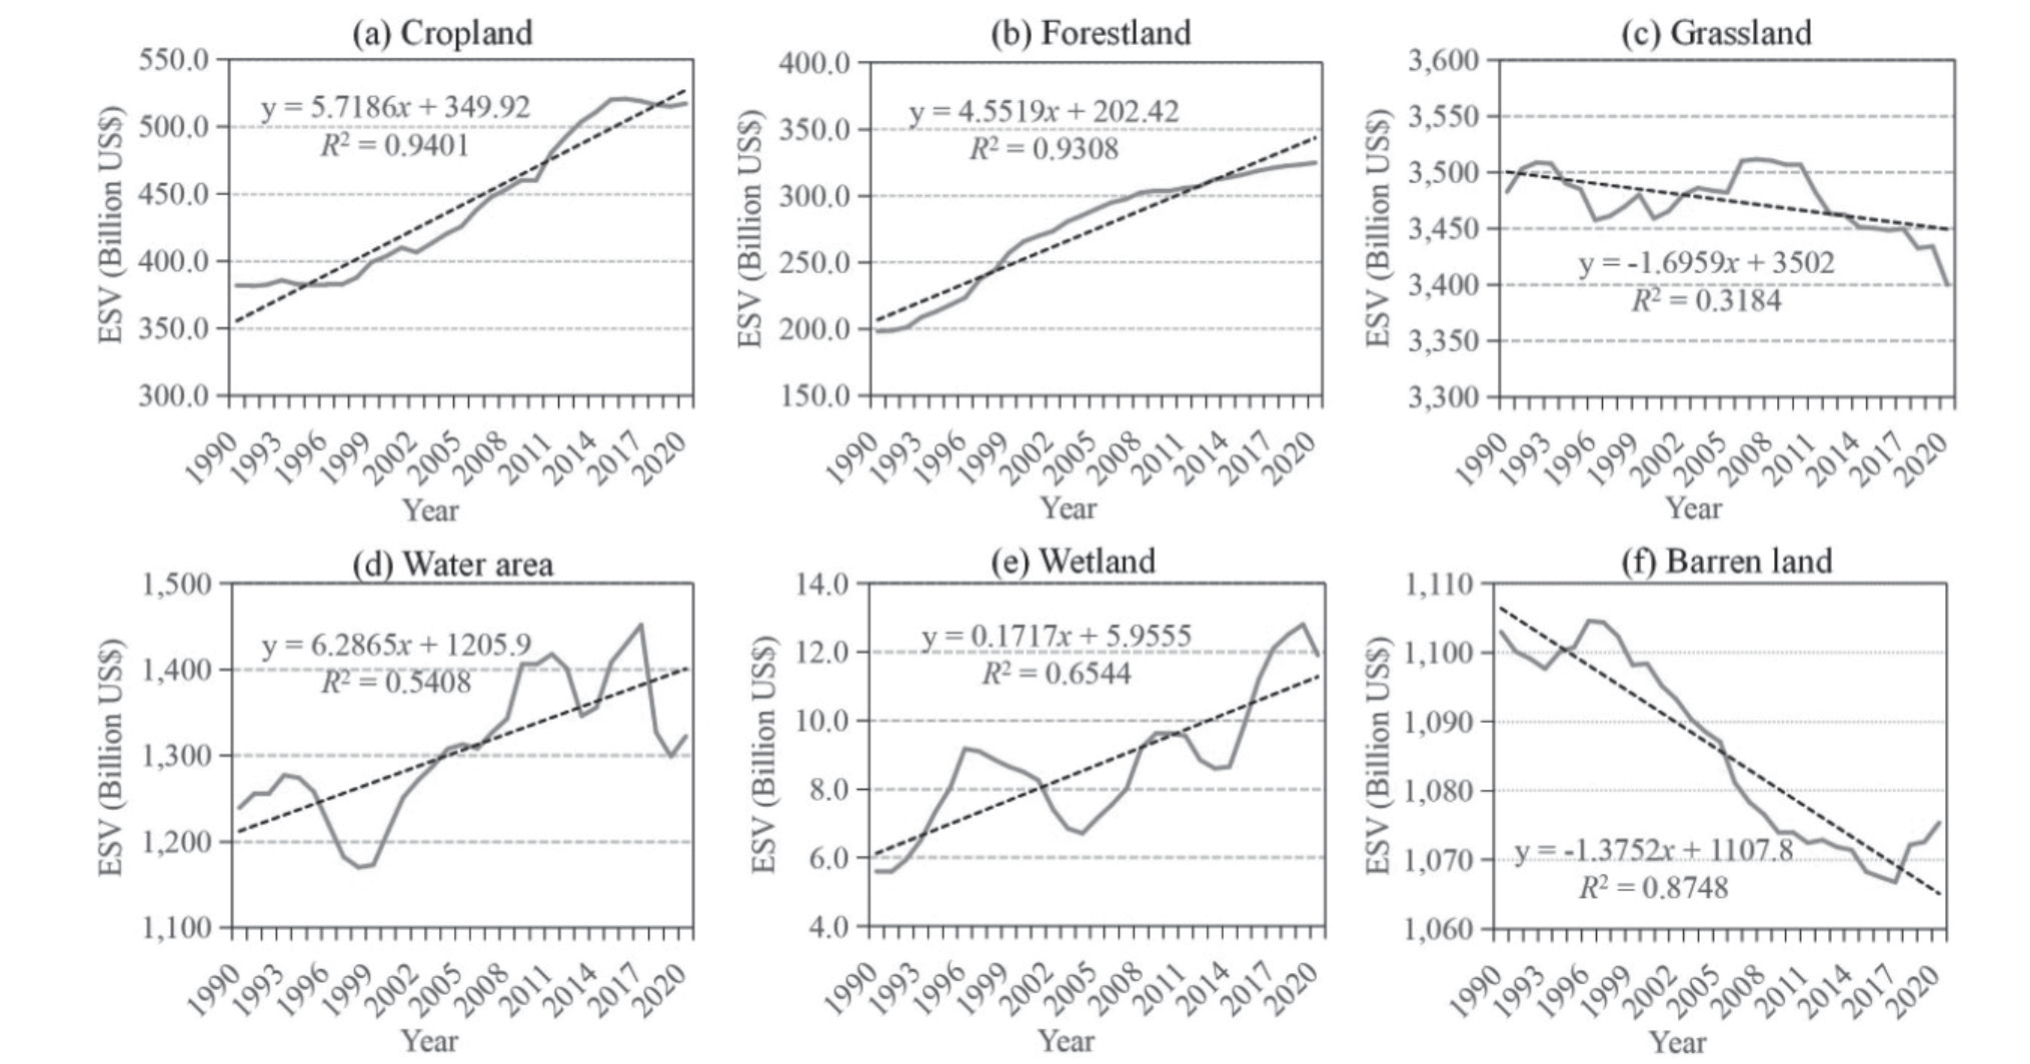
Fig. 3 demonstrates the ESV of land cover types and the results show that there are some differences in their change characteristics. Among them, grassland (3399.96-351.151 billion US$)>waters (117.02-145.179 billion US$) > bareland (106.677-110.457 billion US$) > cropland (381.43 - 52.067 billion US$) > forestland (198.21-32.483 billion US$) > wetland (559-1.281 billion US$ ). In addition, a linear fitting method was used to determine its trend from 1990 to 2020. Over the study period, the ESV provided by farmland and forestland increased steadily with an overall growth rate of 4.36 billion US$ and 4.08 billion US$ per year, respectively. Grassland and barren land ground provided an overall fluctuating decline in ESV, with overall rates of decline of 2.67 and 0.89 billion US$ per year, respectively. Water area and wetland have a fluctuating upward trend in ESV, but their growth rates (2.68 billion US$ and 0.20 billion US$ per year, respectively) are relatively low.
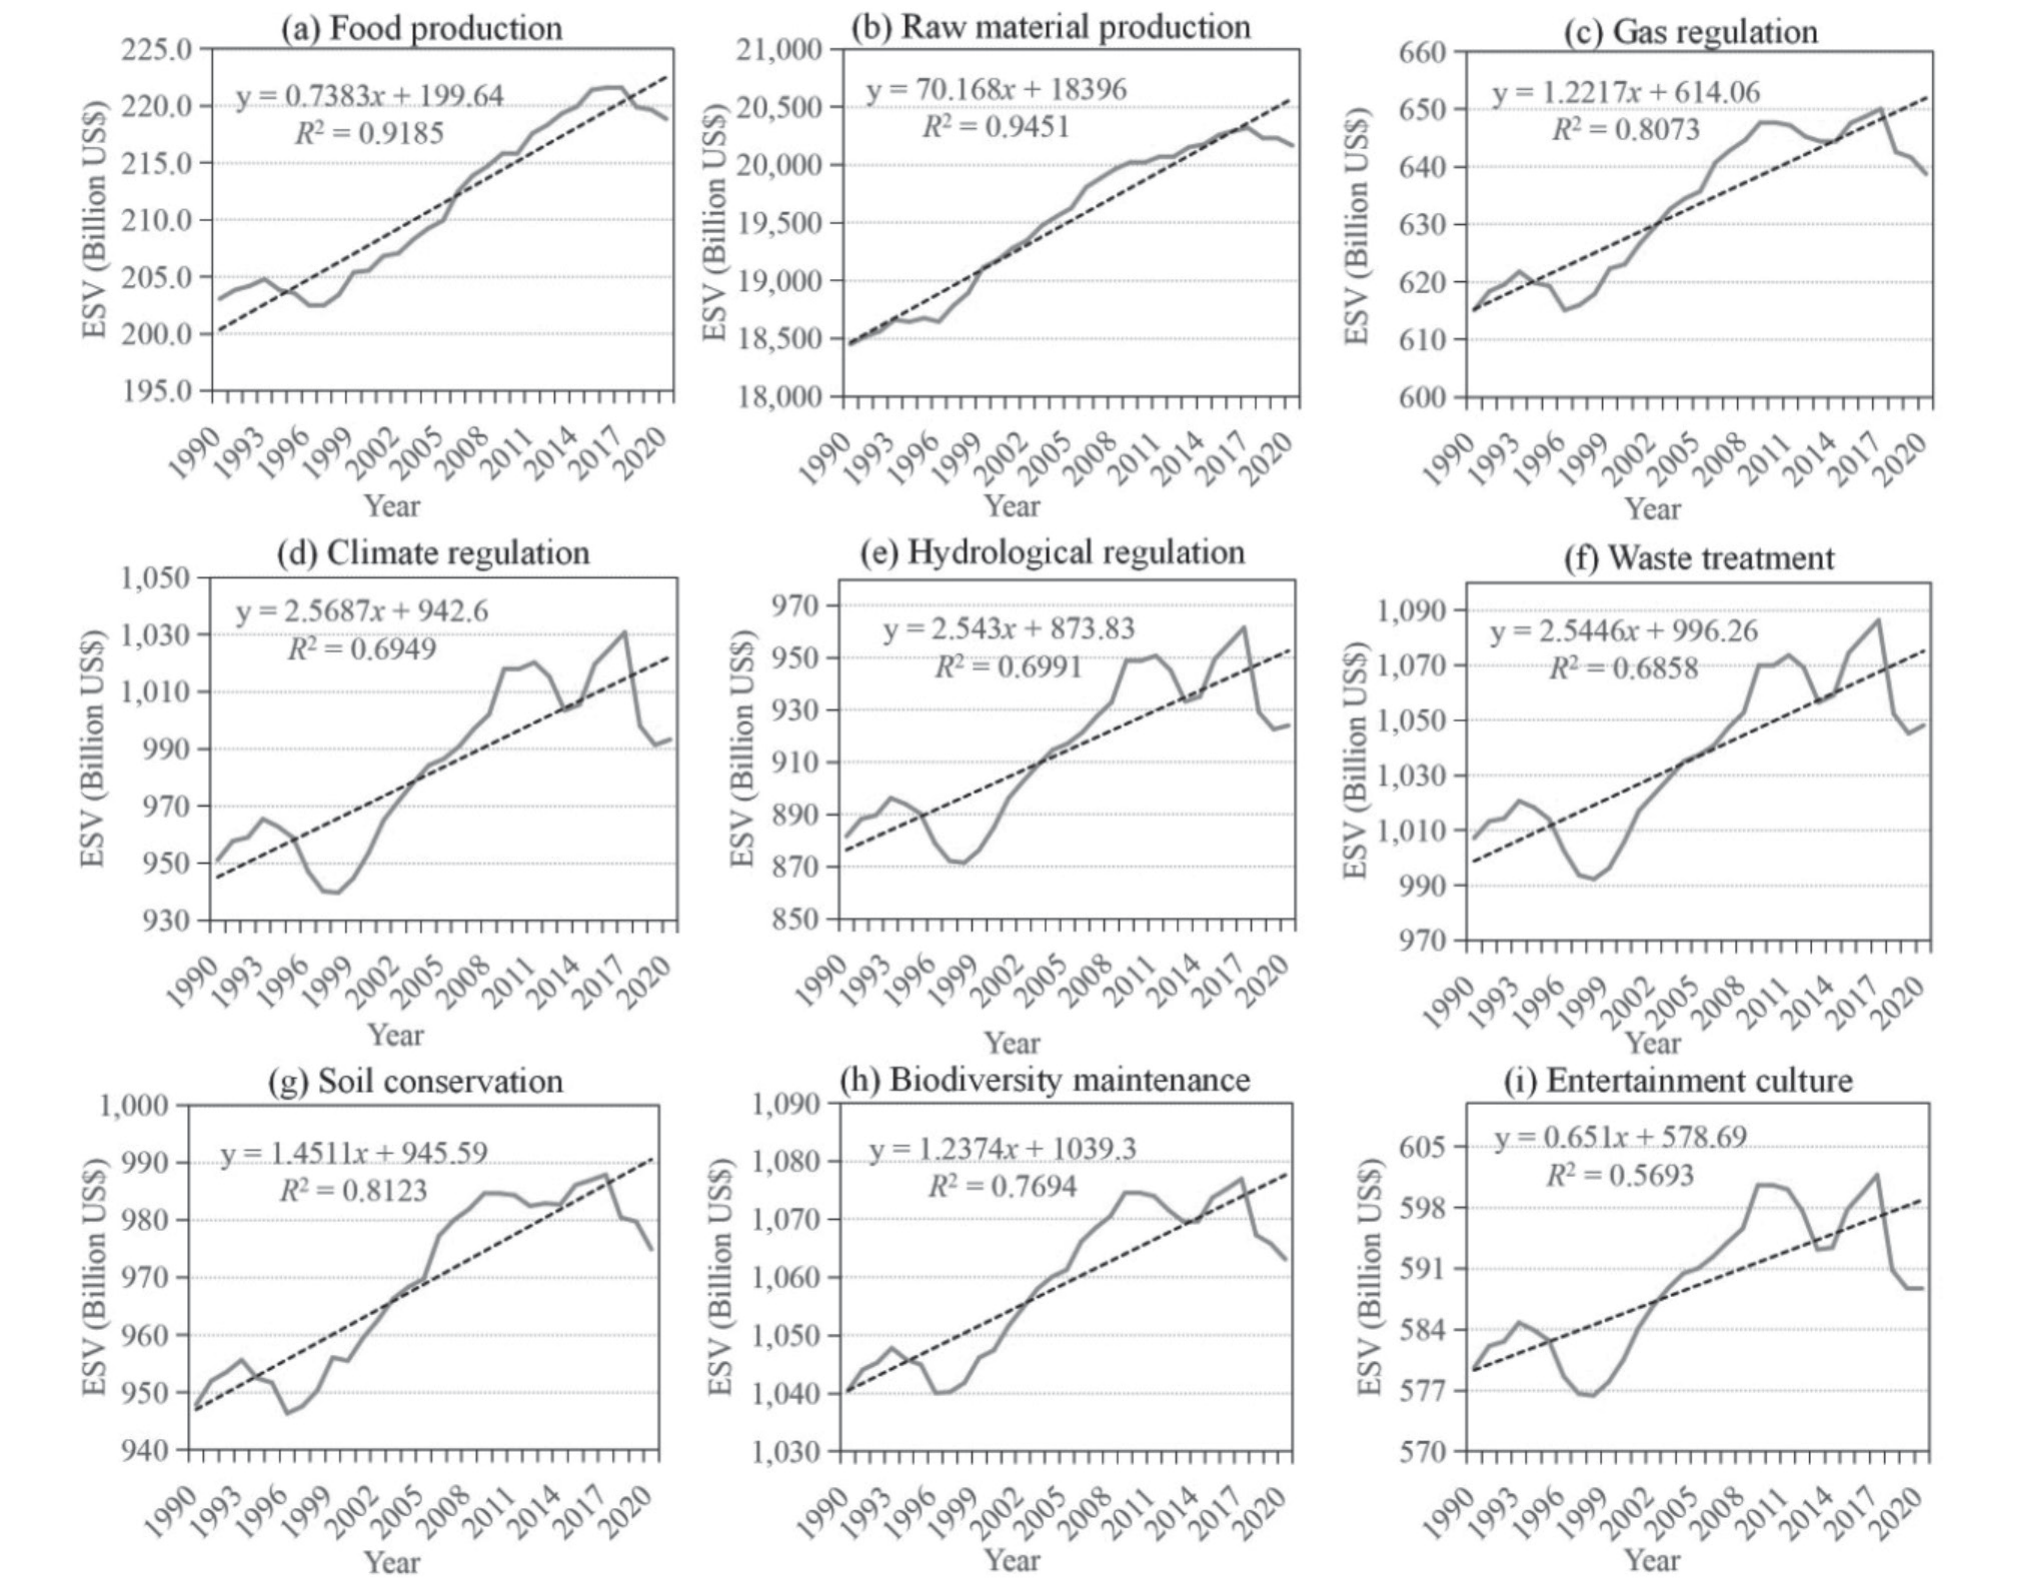
There were also small fluctuations in the monetary value of the different ESs, but the ranking did not change (Fig. 4). Among the different service categories of ecosystems, provision services have the highest monetary value, followed by regulation services, supporting services and cultural services. The monetary value of food production and raw material production increased at a significant rate from 1990 to 2020. The increase in the monetary value of gas regulation, climate regulation, hydrological regulation, waste treatment, soil conservation, biodiversity maintenance, and entertainment culture were not significant with fluctuating characteristics. Of these, biodiversity maintenance (104.07-107.695 billion US$) > waste treatment (99.229-108.634 billion US$) > climate regulation (93.967-103.078 billion US$) > soil conservation (94.636-98.791 billion US$) > hydrological regulation (87.146-96.155 billion US$) > food production ( 615.11-65.005 billion US$) > entertainment culture (576.43-60.177 billion US$).
Spatial Distribution Characteristics of the ESV
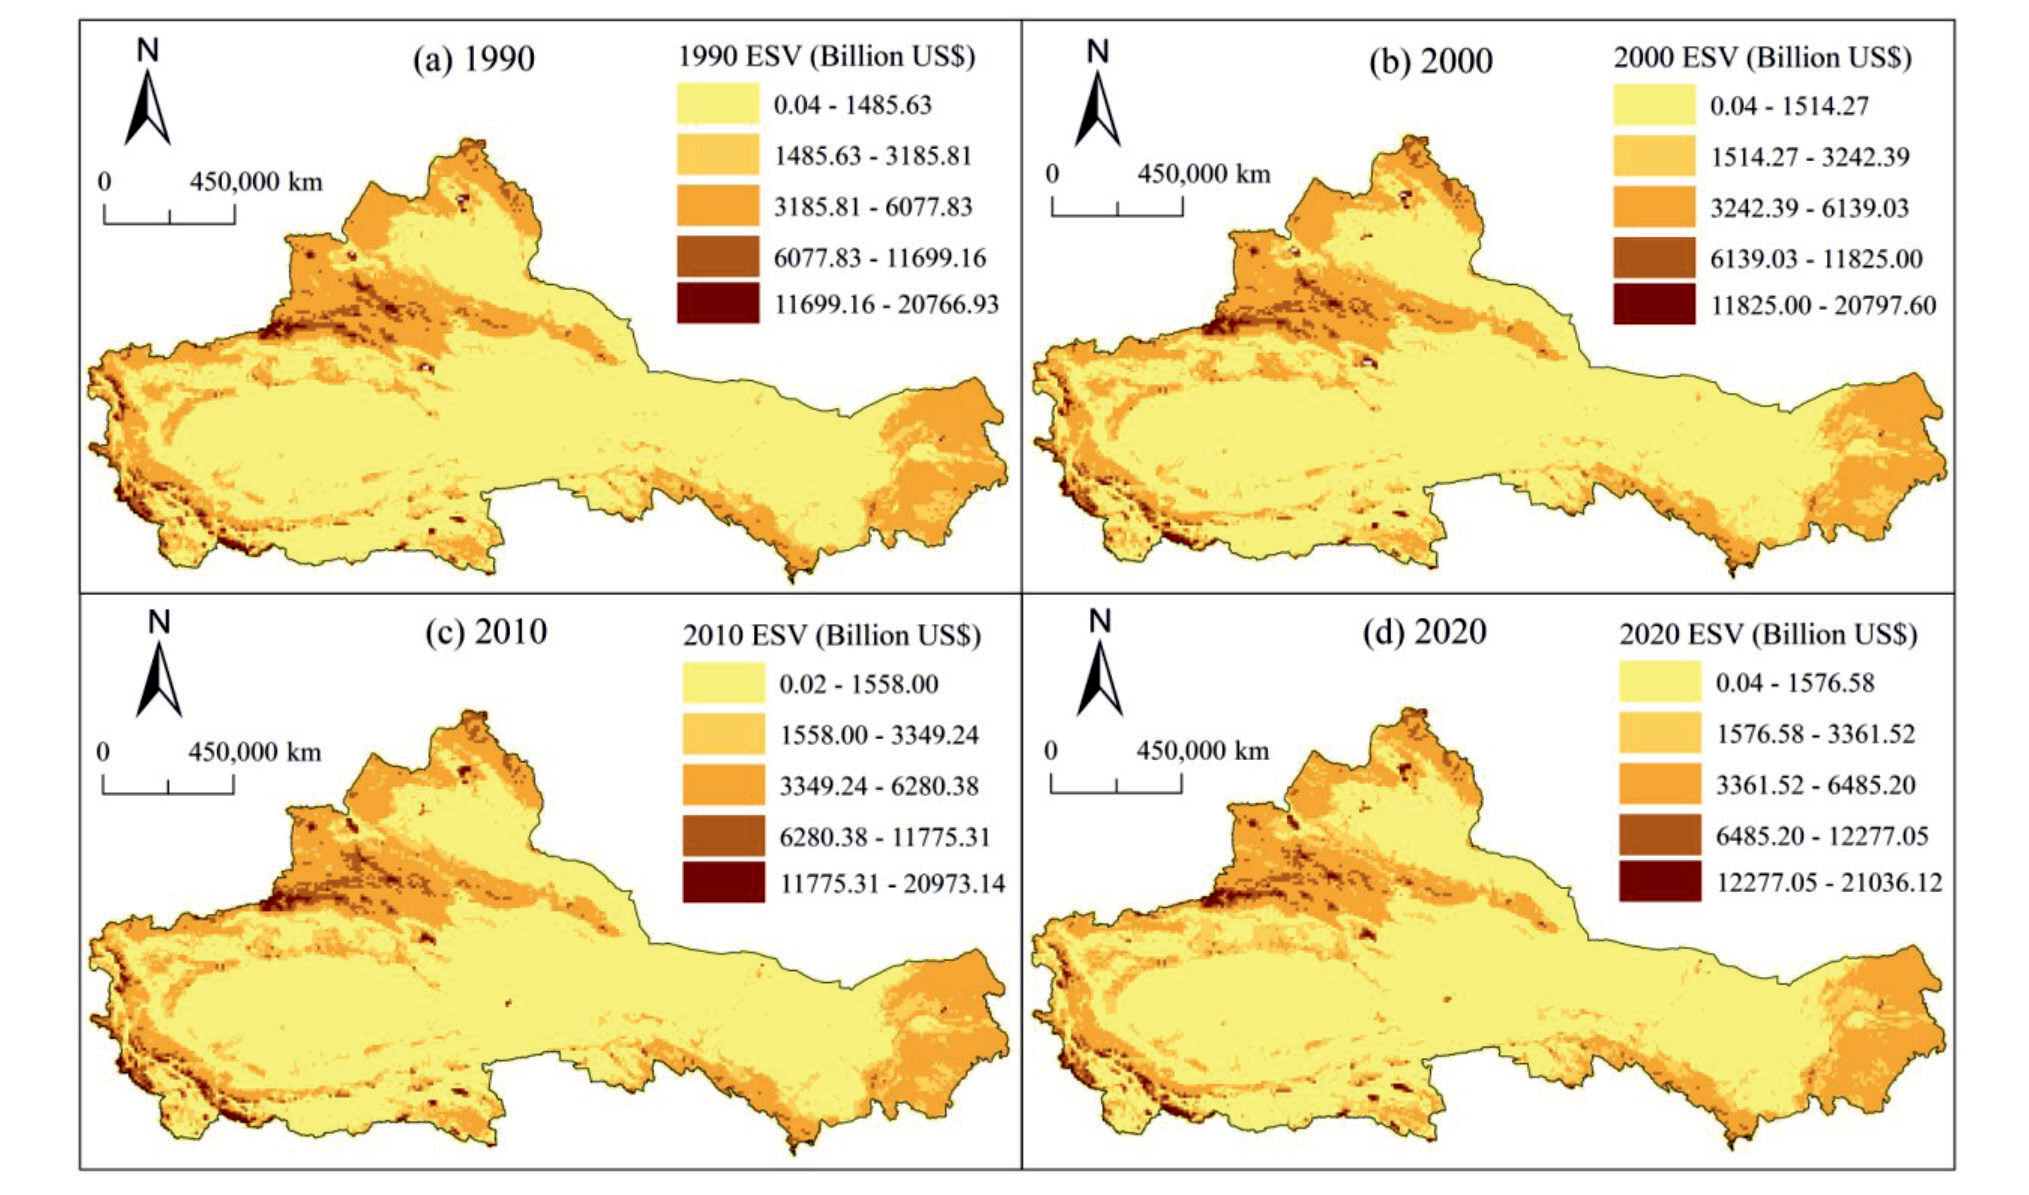
As shown in Fig. 5, the spatial pattern of the ESV in 1990, 2000, 2010 and 2020 was mapped using the natural breakpoint method based on ArcGIS 10.2, revealing the spatial heterogeneity of the ESV in the study area. The spatial distribution of the ESV in the study area from 1990 to 2020 was relatively stable. Spatially, the ESV was higher in the northwest, northeast and southwest regions of the study area, while it was lower in the central region, consistent with the spatial distribution of land cover. The regions with high ESV were concentrated in grassland, higher elevation mountainous woodland regions and oasis cropland. The main regions are the Tian Shan mountainous forest areas in Xinjiang, the oasis croplands formed by meltwater from the Tian Shan Mountains, the Qilian Mountains in Gansu, and some regions in Inner Mongolia. The ESV of these regions were significantly higher than other regions, above 318.581 billion US$, 314.239 billion US$, 334.924 billion US$ and 336.152 billion US$ in 1990, 2000, 2010 and 2020, respectively. The regions with the lowest ESV were more concentrated, mainly in the bare land and construction land distribution zones of China's arid regions.
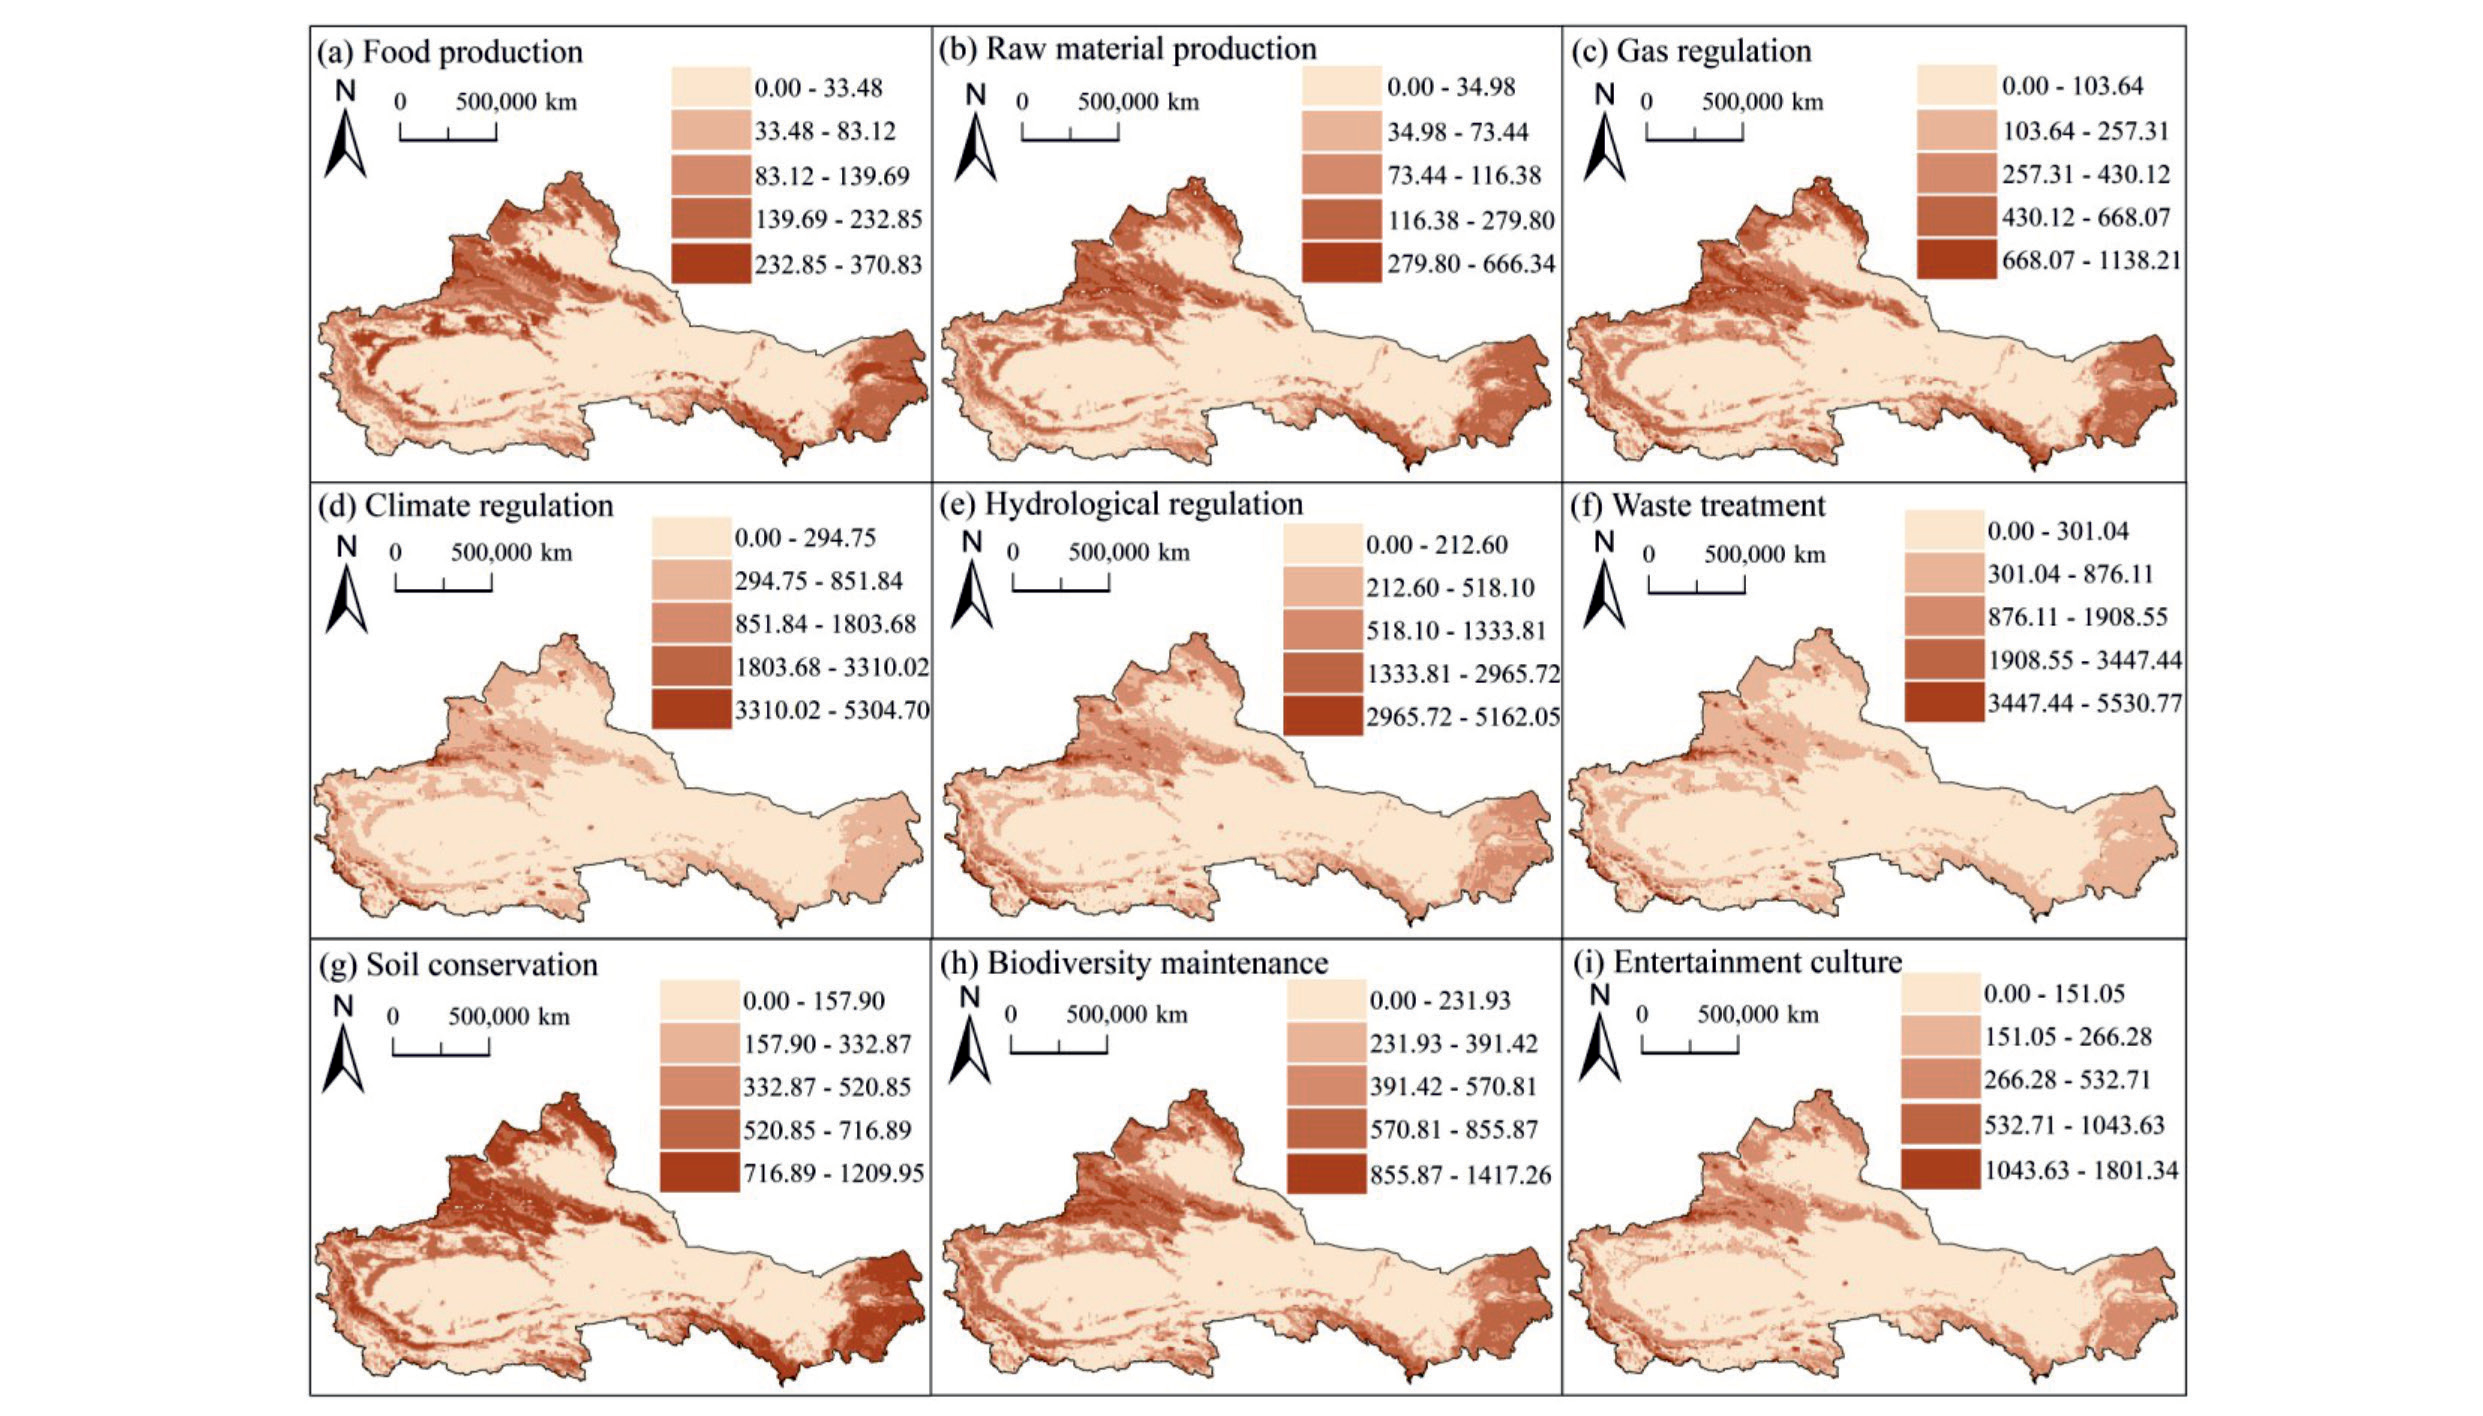
We further analyzed the spatial distribution characteristics of different ESs in 2020 (Fig. 6). The results showed that the spatial differences of different ESV were obvious and were strongly influenced by the land use/cover distribution patterns. Specifically, the spatial distribution characteristics of food production, raw material production and gas regulation values were similar, and their high-value areas were in the range of 23.285 billion US$-37.083 billion US$, 27.980 billion US$-66.634 billion US$ and 66.807 billion US$ 113.821 billion US$, respectively, and were mainly influenced by a combination of four land use types that including forestland, water area, cropland, and grassland. The high-value areas of climate regulation, hydrologic regulation, and waste treatment were very fragmented, and their value was relatively low. The high-value areas for soil conservation and biodiversity maintenance were higher than 71,689 million US$ and 85,587 million US$, respectively. The high-value areas that provide aesthetic landscapes were less and dominated by low to medium values.
Identifying Hot and Cold Spots of the ESV
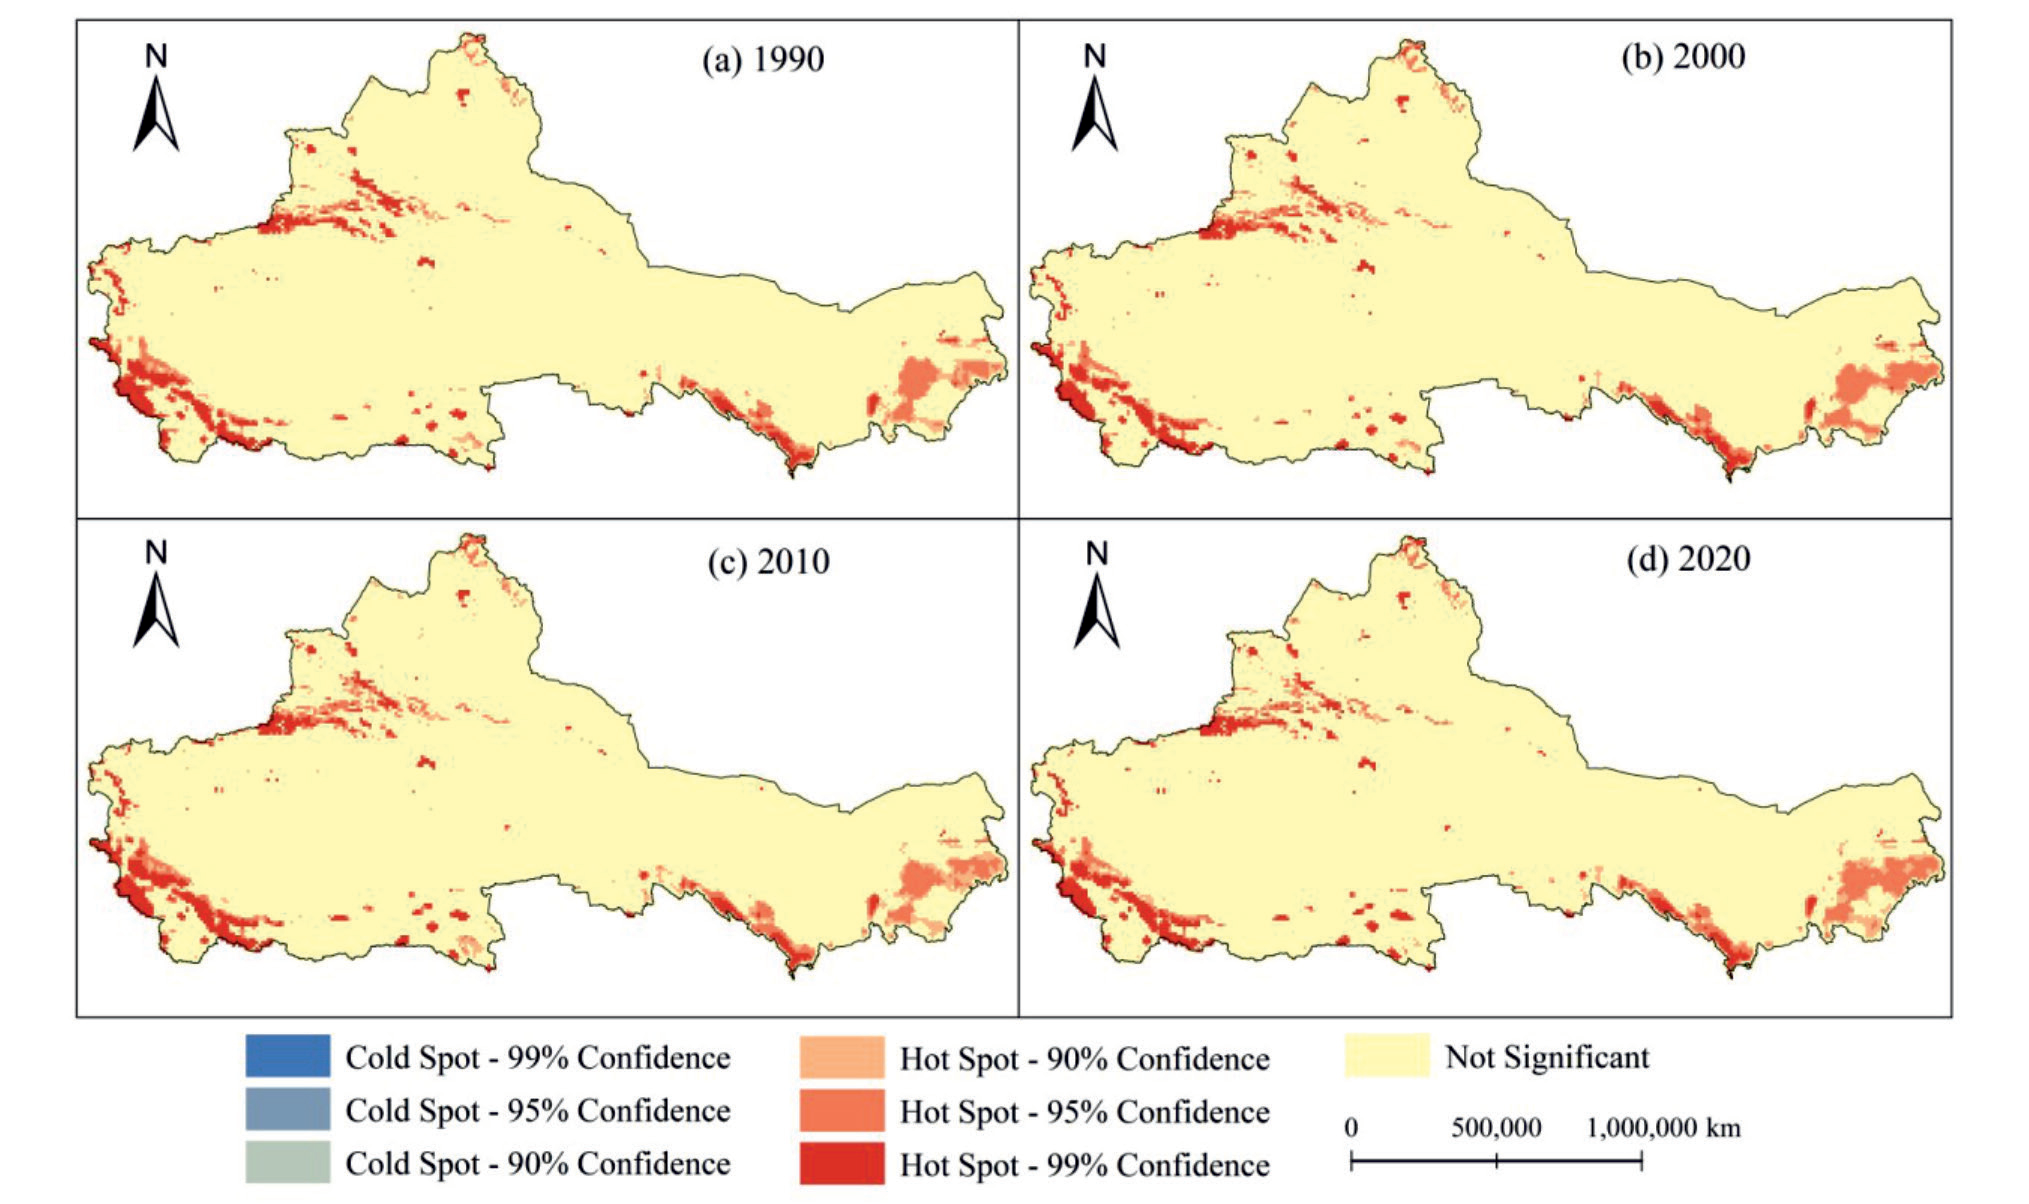
We identified cold and hot spots for ecosystem service values in 1990, 2000, 2010 and 2020 (Fig. 7). The hot and cold spots with confidence levels above 95% were mapped to present the statistically significant spatial clusters of hot and cold spots regarding ESV changes. The hot spot pattern was more prominent in the four years, mainly in the Altai and Tian Shan mountainous forest areas of Xinjiang, the oasis farmland formed by meltwater from the Tian Shan, the Qilian Mountains, and parts of Inner Mongolia, indicating that land use/cover changes in these areas have improved the supply capacity of ESV. However, the regional distribution of cold spots is less pronounced, indicating that there is no significant deterioration of ESV in the study area from 1990 to 2020.
Furthermore, the hot and cold spots with confidence levels higher than 90% for each ESV in 2020 were further mapped to present statistically significant spatial clusters of hot and cold spots regarding ESV (Fig. 8). The hot spots of different ESV in 2020 were clearly characterized and mainly appeared in and around the Altai and Tianshan mountains in the Xinjiang mountainous forest region and the Qilian Mountains region in Gansu, indicating that the ESV in these regions is improving. The cold spots were mainly distributed around key cities (e.g., Urumqi), which was consistent with the spatial distribution characteristics of different types of ESV in the study area in 2020 analyzed earlier.
Contribution of Land Cover types to ESV Change at Different Stages
The results of analyzing the contribution of different land cover types to ESV change showed that the ecological contribution of cropland and forestland was the largest from 1990 to 2020 with 29.30% and 27.42%, respectively, and the total contribution of both to the total ESV change was more than 50%, followed by grassland (17.95%) and water area (17.99%) (Table 3). In terms of stages, the contribution of water area was as high as 45.84% from 1990 to 2000, while the overall contribution of farmland, grassland and water area was similar at 14.84%, 16.28% and 17.95%, respectively. The ecological contribution of the water area was more prominent from 2000 to 2010, reaching 53.54%, showing a significant increase compared with that of 1990-2000, while the ecological contribution of forestland decreased to 10.53%. The contribution of different land use types to the ESV change in 2010-2020 differs significantly from that of 1990-2000 and 1999- 2009, with wetland and water area contributing only 0.84% and 0.51% to the ESV change, respectively, while the contribution of grassland increases to 39.18% and that of forestland decreases to 7.74%. The contribution of grassland increased to 39.18% and the contribution of forestland decreased to 7.74%, which is related to the significant increase of grassland area and some decrease of forestland area in this period. At the same time, there was a small increase in the contribution of cropland from 2010 to 2020, from 15.61% in 2000-2010 to 20.94% in 2010-2020.
From the analysis of the contribution of the ESV changes of each land cover type at different stages, water area and grassland showed the largest contribution to the ESV changes, and this result indicates that the ESV changes of water and grassland were the main influencing factors of the ESV changes in the study area in the past 31 years, and land cover changes profoundly affected the ecosystem service functions in the region.
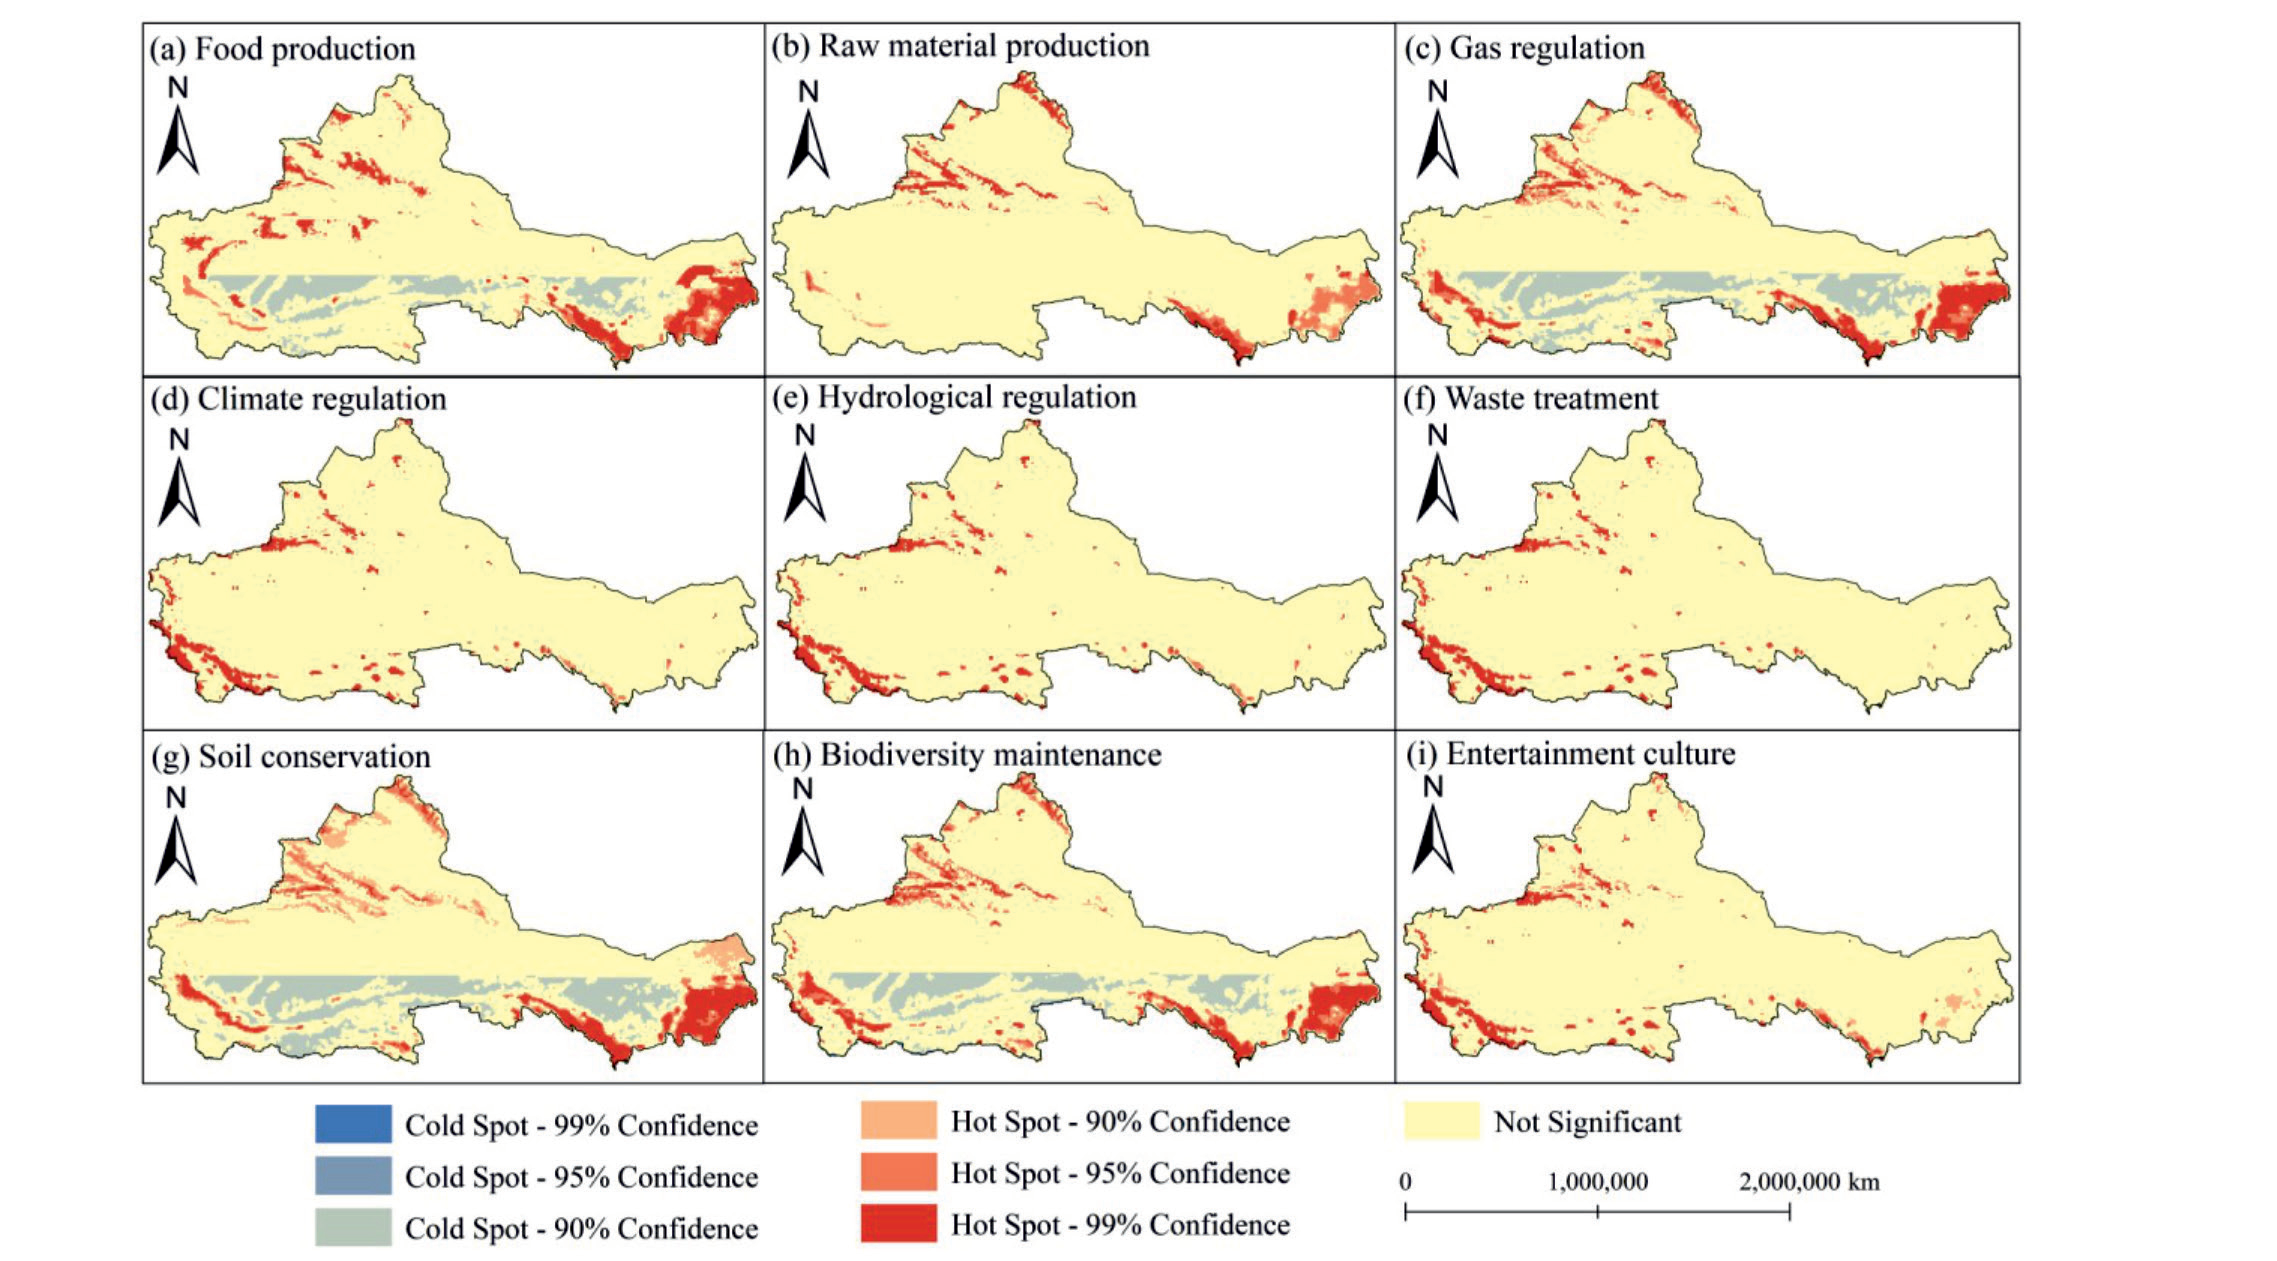
Table 3.
The contribution rate of ESV changes of different land use types from 1990 to 2020 (%).
The Impacts of Different Land Use Types on ESV from 1990 to 2020
Spatio-Temporal Change of Land Use
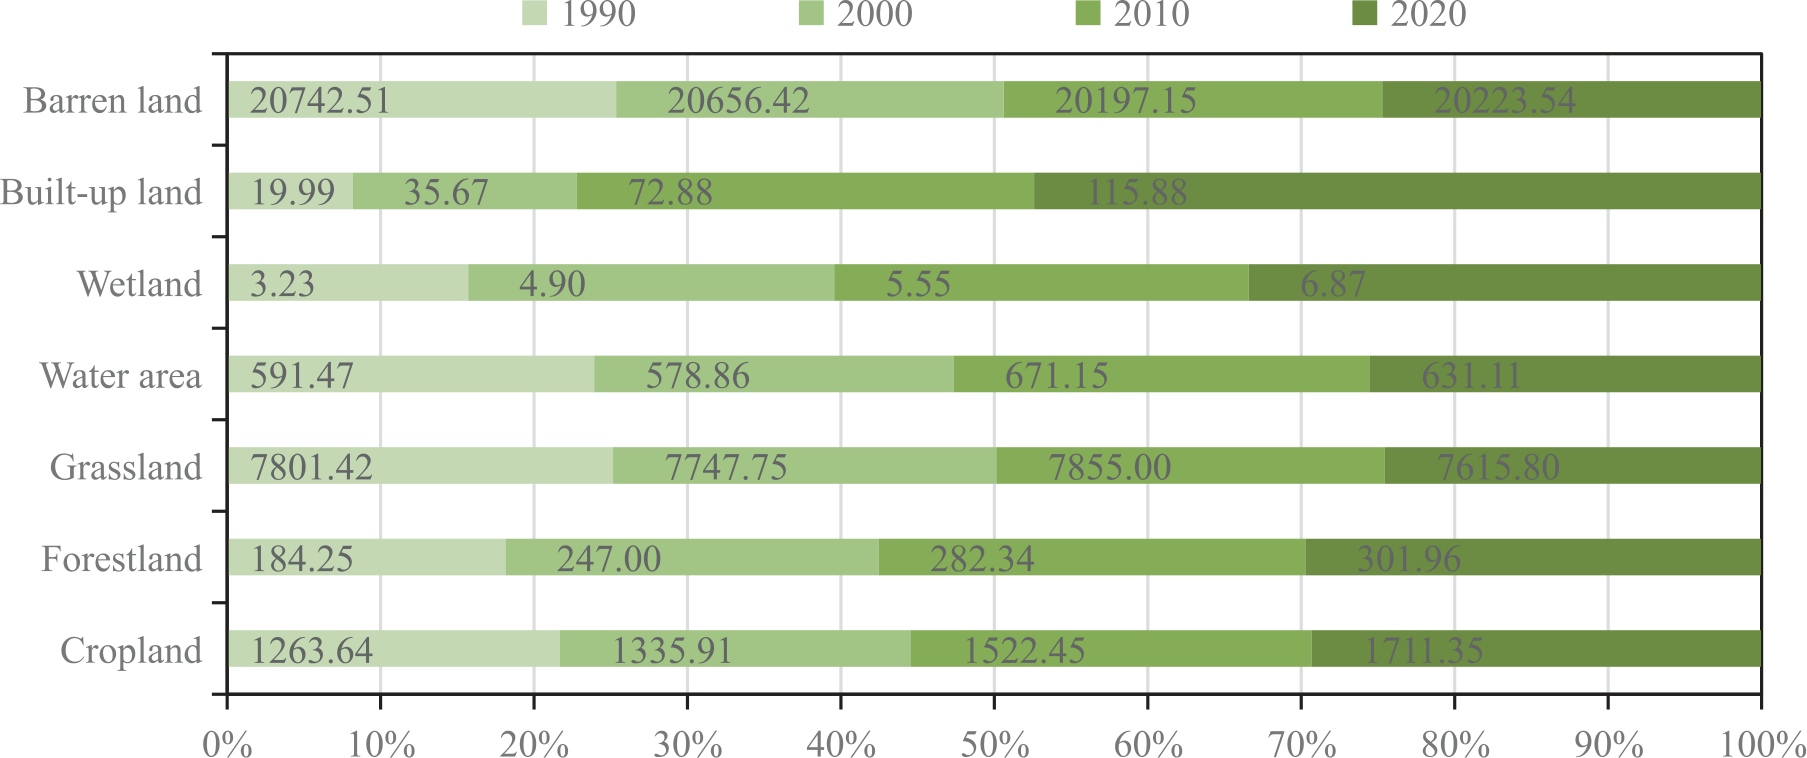
From the changes in the area and percentage of each land use type (Fig. 9), the land cover types in 1990 were dominated by barren land (67.77%) and grassland (25.49%), followed by cropland (4.13%), and the least area of wetland. In 2000, the area of barren land and grassland was 20,656.42×104 hm2 (67.49%) and 7,747.75×104 hm2 (25.31%), followed by 4.36% of the area of cropland. Compared with 1990, the area of barren land and grassland decreased by 0.28% and 0.18%, respectively, while the area of cropland, forestland, wetland and built-up land increased by 0.24%, 0.20%, 0.01% and 0.05%, respectively. Compared with 2000, the area of barren land decreased by 1.50% in 2010, the area of cropland, forestland, grassland, water area and built-up land increased, and the proportion of wetland area changed steadily. The area of grassland and water area decreased by 239.20×10⁴ hm2 (0.78%) and 40.04×10⁴ hm2 (0.18%), respectively, while the area of cropland and built-up land increased by 0.62% and 0.14%, respectively, and the area of forestland, wetland and barren land did not change significantly from 2010 to 2020. To sum up, the land cover types were mainly barren land, with a significant increase in the area of cropland and built-up land, and a decrease in the area of grassland, gradually forming a relatively balanced pattern of land cover types.
Fig. 10 shows the characteristics of land cover type transfer from 1990 to 2020. In 1990-2000, cropland area shifted out 131.70×10⁴ hm2, with the largest transfer of cropland to grassland, followed by built-up land. Grassland was transferred to cropland by 155.79×10⁴ hm2, and barren land was transferred to cropland, grassland and water area by 26.05×10⁴ hm2, 505.40×10⁴ hm2 and 34.99×10⁴ hm2, respectively. In 2000-2010, cropland, grassland and barren land were mainly converted out, with 102.45×10⁴ hm2, 536.18×10⁴ hm2 and 654.56×10⁴ hm2, respectively. Among them, cropland was converted to grassland by 89.72×10⁴ hm2, grassland was converted to cropland and barren land by 193.28×10⁴ hm2 and 288.18×10⁴ hm2, and the conversion of barren land to grassland was 524.25×10⁴ hm2. In 2010-2020, grassland was the main type of transfer out, cropland and built-up land were the main types of transfer in, and the transfer in and out of barren land was balanced. Specifically, grassland transferred to cropland was 221.10×10⁴ hm2, barren land transferred to cropland was 45.37×10⁴ hm2, and built-up land mainly originated from cropland, grassland and barren land.
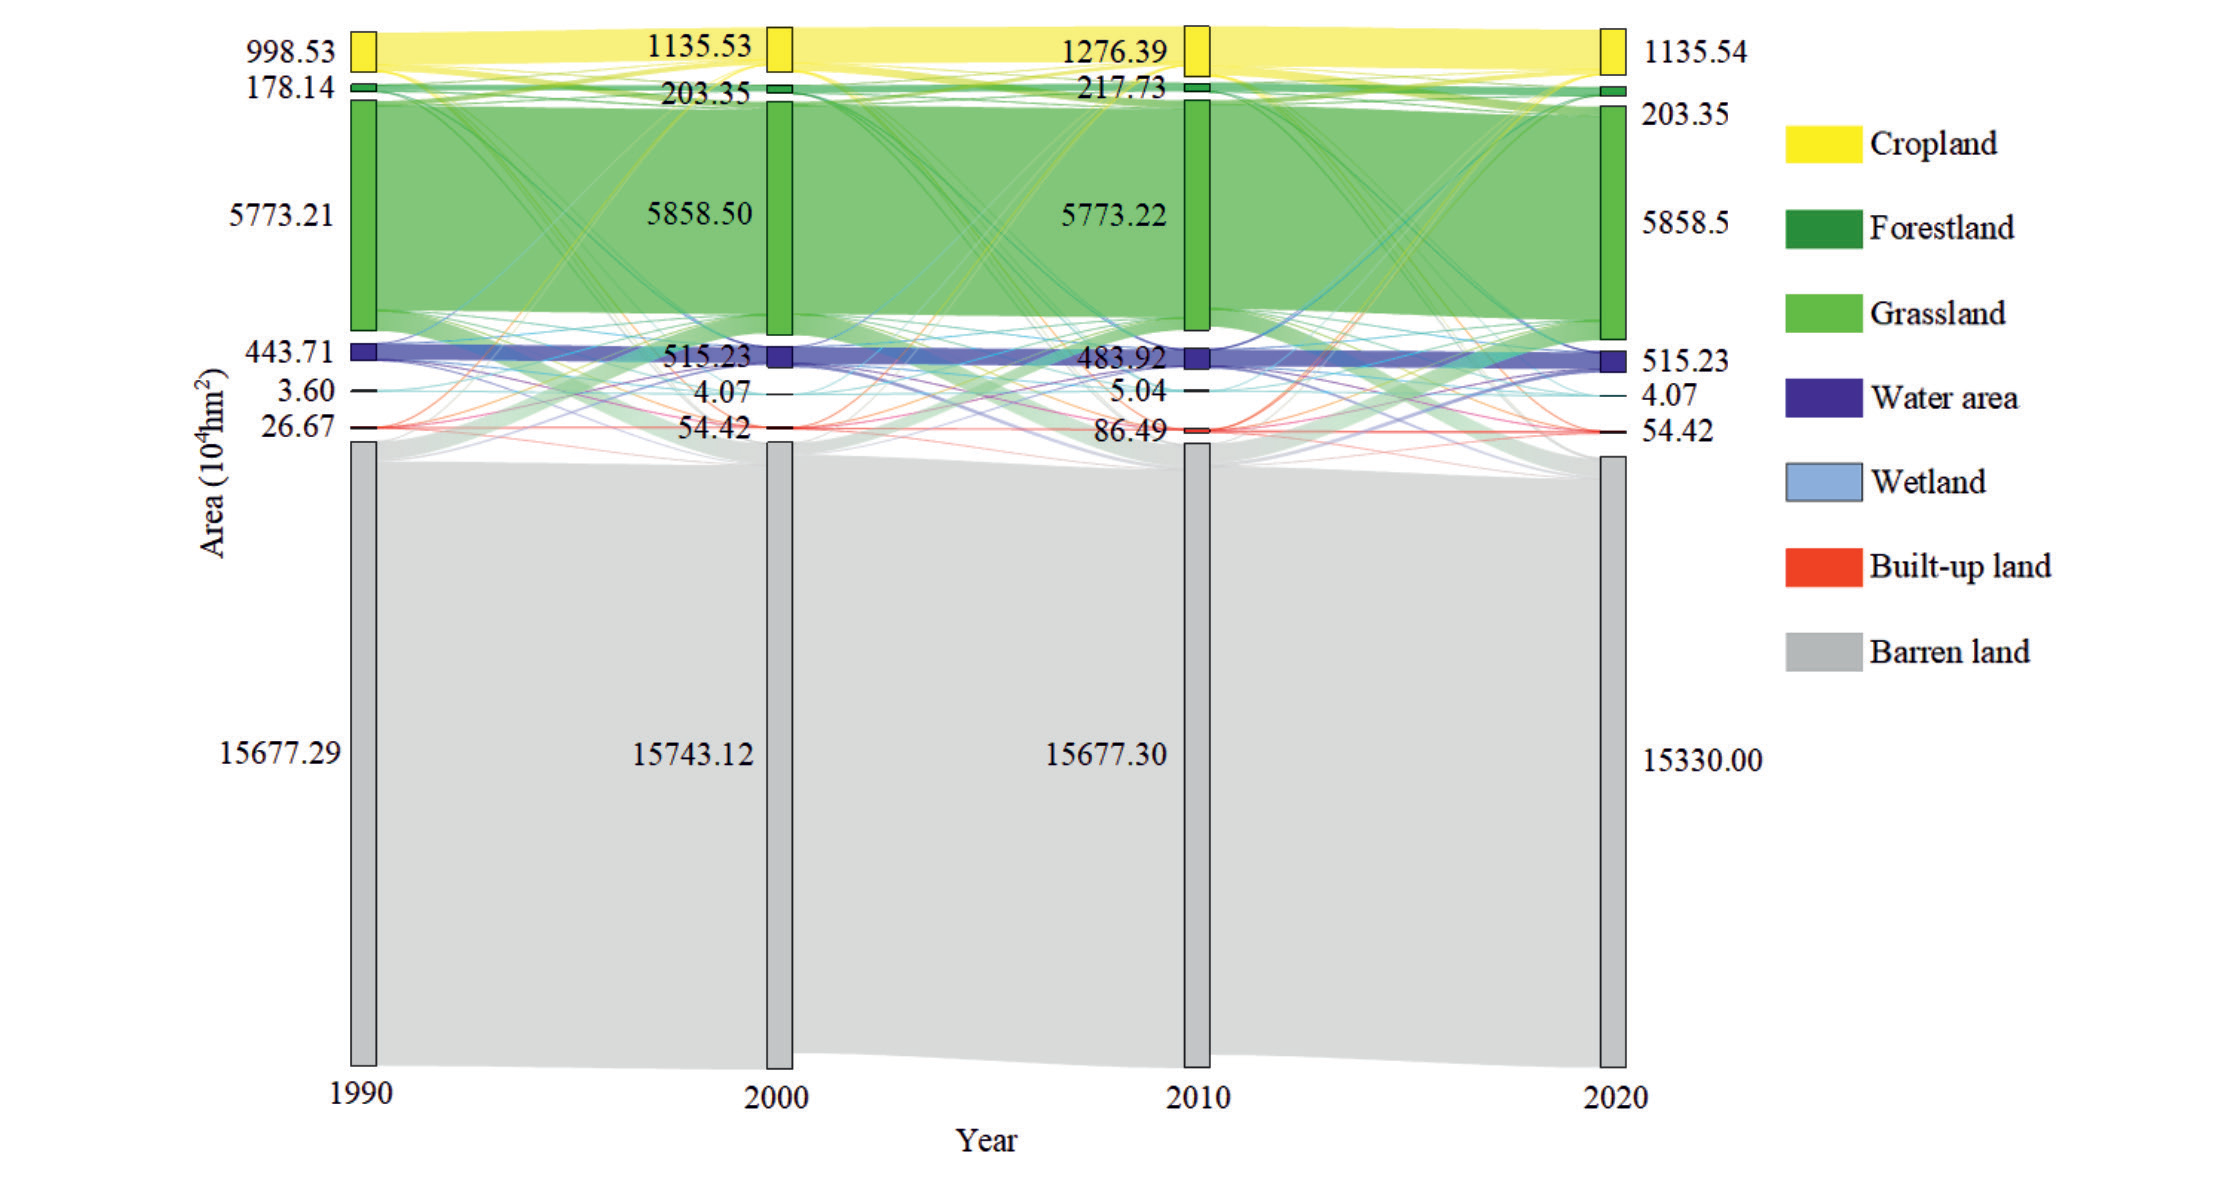
Overall, cropland expansion, grassland degradation and built-up land expansion dominated the arid regions of Northwest China throughout the study period. Therefore, this study further analyzed that these three main types of land use change had a large impact on the ESV change.
Fig. 11 shows the spatial distribution patterns of land use in 1990, 2000, 2010 and 2020. The results show that the overall spatial pattern of land use in the study area from 1990 to 2020 was relatively stable. Barren land showed a central distribution, and cropland was mainly distributed in the oasis formed by the meltwater of the Tianshan Mountains in Xinjiang and the oasis area of Hexi Corridor in Gansu, thanks to the flat terrain, warm and humid climate and good water conservancy conditions in the region, which facilitated the development of oasis agriculture and cropland expansion. Forestland was distributed in the mountainous of the Altai and Tian Shan in Xinjiang and the Qilian Mountains in Gansu.
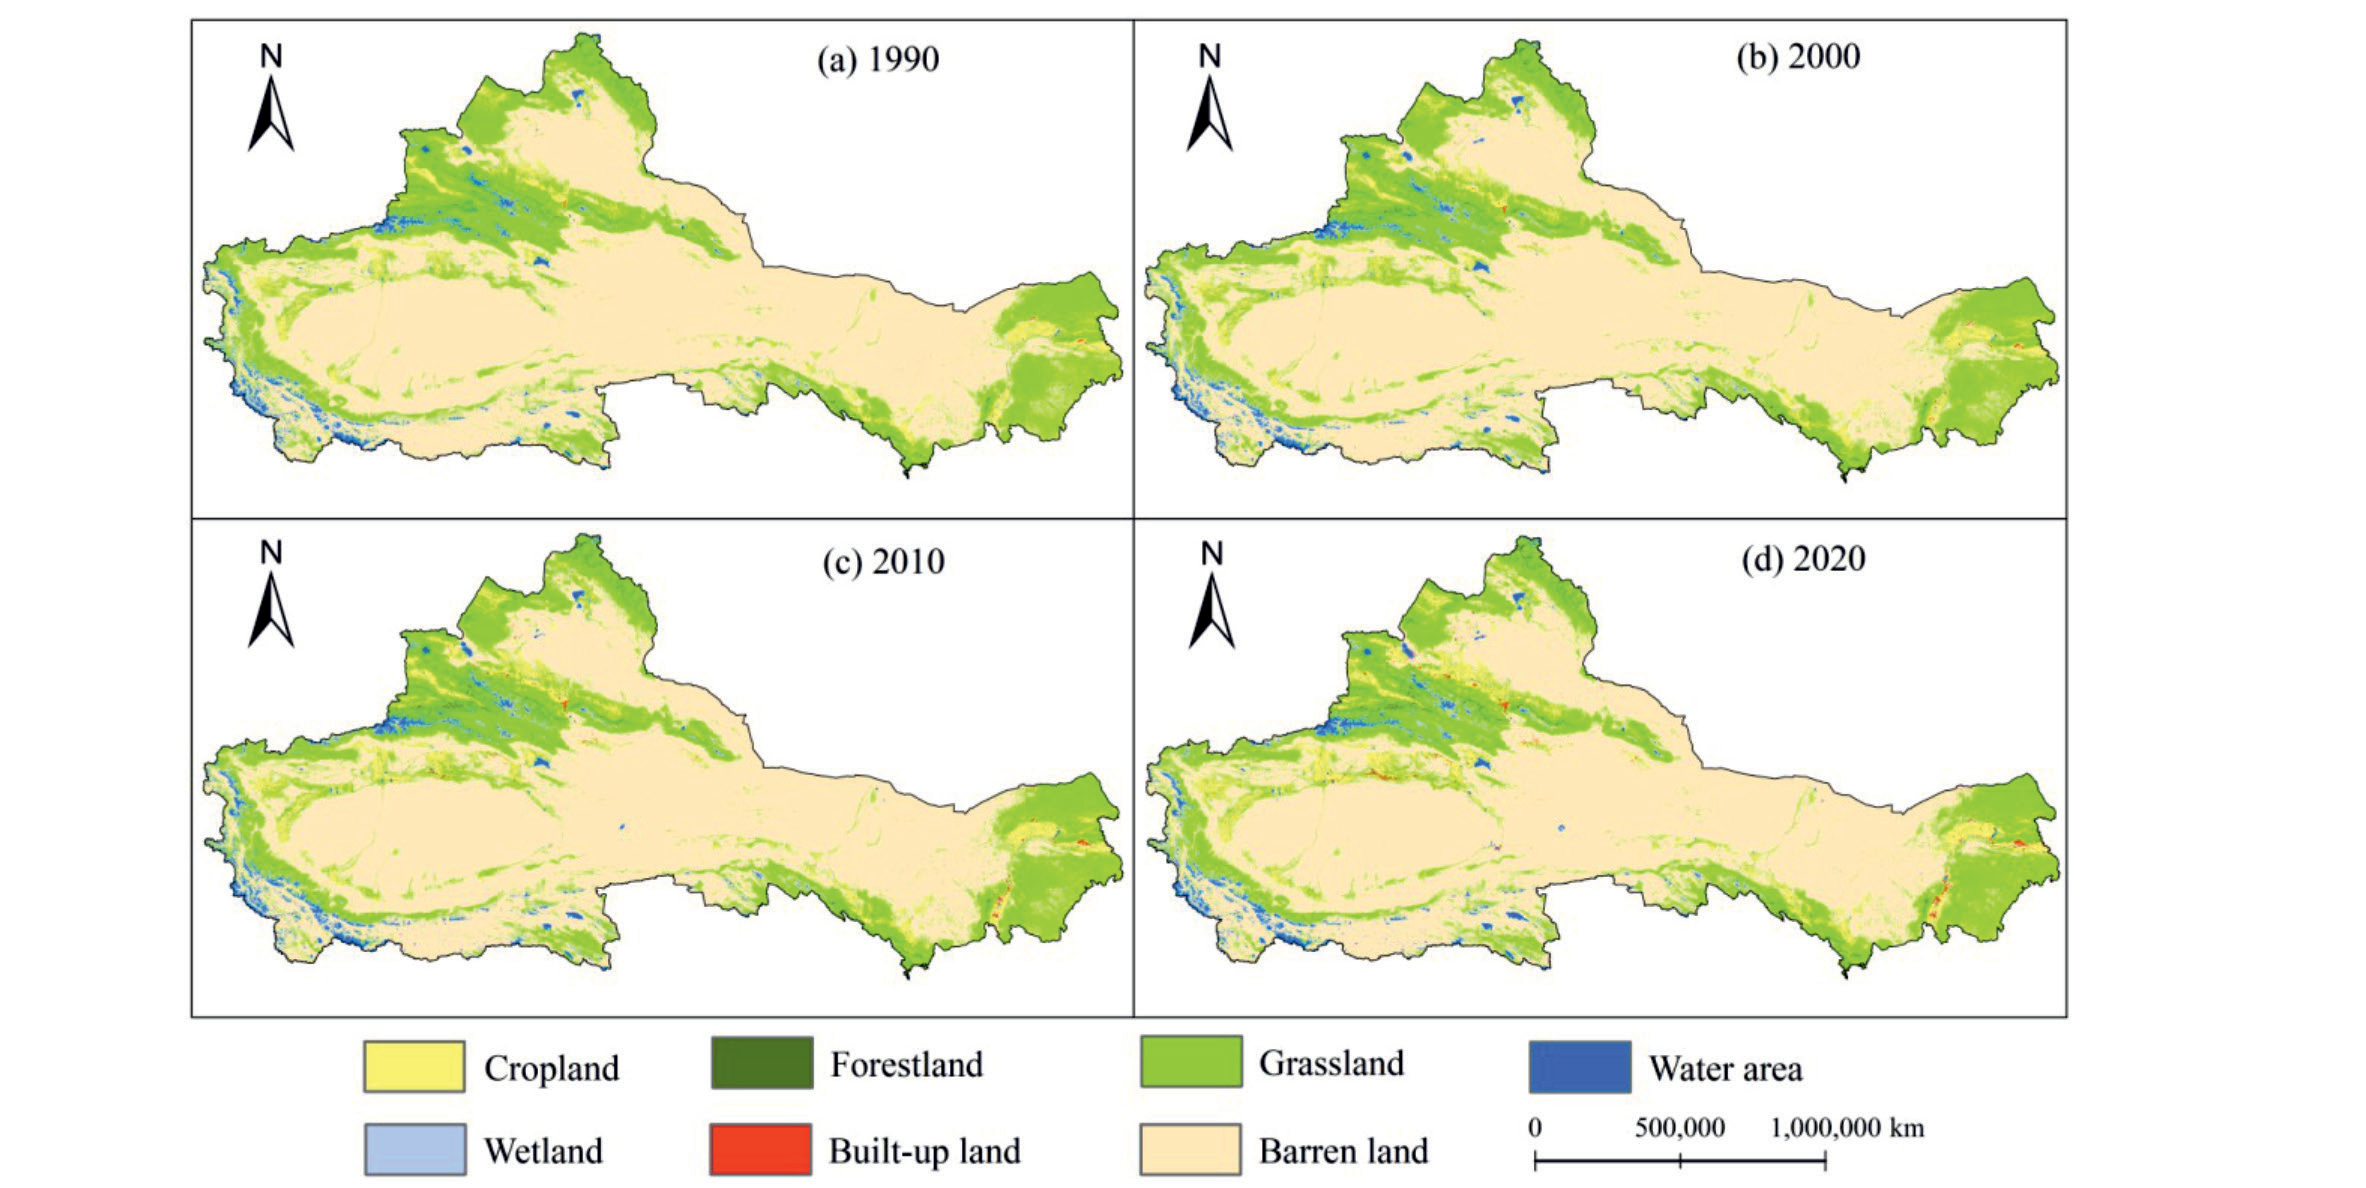
Table 4.
Conversion of different types of land to farmland in the study area from 1990 to 2020.
Impact of Farmland Expansion on ESV
Table 4 shows the results of different land types converted to farmland. The increasing area of cropland, influenced by the policy, may lead to a decrease in ESV. However, looking at the ESV of the overall arid region, the new farmland was mainly from grassland. The conversion area of grassland to cropland was 155.79×10⁴ hm2, 193.28×10⁴ hm2 and 221.10×10⁴ hm2 for 1990-2000, 2000-2010 and 2010-2020, respectively, resulting in a decrease in ESV of 0.225 million US$, 0.279 million US$ and 0.319 million US$, respectively. Rather than increasing the overall ESV, cropland reclamation, which mainly occupies forestland, grassland, water area and wetland, will reduce the overall ESV. However, the conversion of barren land to cropland has continued to increase, increasing the total ESV. In conclusion, cropland expansion often encroaches on ecological lands such as forestland, grassland, and wetland, affecting the overall regional ESV. Therefore, ecological protection of forestland and grassland with high ESV needs to be strengthened through planning for cropland protection and development, especially the urgent need to stabilize the ecological environment in the study area and to avoid the reclamation of excessive grassland and forestland into cropland.
Table 5.
Conversion of grassland to different types of land in the study area from 1990 to 2020.
Table 6.
Conversion of different types of land to built-up land in the study area from 1990 to 2020.
Impact of Grassland Degradation on ESV
Table 5 shows the conversion of grassland to different land types from 1990 to 2020. The area of grassland in the study area accounts for about 25% of the total area. The area of grassland decreased from 7801.42×104 hm2 in 1990 to 7615.80×104 hm2 in 2020, a decrease of 2.38%. The conversion of grassland to forestland, water area, and wetland increased ESV by 0.269 million US$, 0.167 million US$, and 0.027 million US$, respectively, from 1990 to 2000. The conversion of grassland to forestland, water area, and wetland increased ESV by 0.164 million US$, 0.160 million US$, and 0.019 million US$, respectively, from 2000 to 2010. The conversion of grassland to forestland, water area and wetland from 2010 to 2020 resulted in an increase of the ESV by 0.103 million US$, 0.106 million US$ and 0.025 million US$, respectively. The decreasing area of grassland has promoted the change of surrounding land use patterns, with the conversion of large areas of grassland to cropland, barren land and built-up land. Accordingly, it also resulted in a gain or loss of regional ESV. The most significant decrease of ESV in 1990-2000, 2000-2010 and 2010-2020 was the part of grassland converted to barren land, which was 1.787 million US$, 1.133 million US$ and 1.877 million US$, respectively. The area of grassland converted to built-up land was small, and this part of the ESV loss and gain was low. In conclusion, grassland degradation seriously affects the ESV in arid regions. Besides the influence of human activities, the low drought and fragile ecological conditions are the main reasons for grassland degradation and grassland ecological deterioration.
Impact of Built-up Land Expansion on ESV
The main reason for the increase in built-up land area was the occupation of cropland, grassland, water area and barren land (Table 6). The area of built-up land in the study area increased by 95.90×10⁴ hm2 from 1990 to 2020. In stages, the conversion of cropland, grassland, water area, and barren land to built-up land resulted in small ESV gains and losses from 1990 to 2000. The conversion of different types of land to built-up land from 2000 to 2010 resulted in a decrease in ESV of 0.100 million US$. The built-up land expansion was more pronounced from 2010 to 2020, and this part of ESV was 0.129 million US$. To summarize, the continued expansion of built-up land has a negative impact on the regional total ESV as the population grows.
Conclusion
This study estimated the ESV in the arid region of Northwest China from 1990 to 2020 based on the CLCD, which is more continuous and detailed than previous studies. Meanwhile, this study identifies the cold spots and hot spots of ESV changes, discusses the ecological contribution of each land cover type to ESV changes, and details the impact of cropland expansion, grassland degradation and built-up land expansion on the ESV. The main conclusions we obtained are as follows.
(1) The total ESV in the arid region of Northwest China showed a fluctuating upward trend from 1990 to 2020. Among the secondary categories of different ESs, the monetary values of food production and raw material production increase at significant rates. The monetary values of gas regulation, climate regulation, hydrological regulation, waste treatment, soil conservation, biodiversity maintenance, and entertainment culture did not increase significantly. In addition, the ecological contribution of cropland and forestland was the largest in 1990-2020, followed by grassland and water area.
(2) The spatial distribution pattern of ESV was relatively stable from 1990 to 2020. Spatially, the ESV was higher in the Northwest, Northeast and Southwest regions, while it was lower in the Central region, which was consistent with the spatial distribution pattern of land use. Meanwhile, the hotspot pattern was more prominent in four years, mainly in the Altai and Tianshan mountains in the mountainous forest area of Xinjiang, the oasis cropland formed by meltwater in the Tianshan Mountains, the Qilian Mountains in Gansu, and some areas in Inner Mongolia, which is consistent with the actual results.
(3) The land cover type in the arid region of Northwest China is dominated by barren land. Cropland and built-up land increased significantly from 1990 to 2020, and the area of grassland declined, gradually forming a relatively stable land and land cover pattern. Cropland and built-up land increased significantly from 1990 to 2020, and the area of grassland declined, gradually forming a relatively stable land and land cover pattern. Cropland expansion encroached on forestland, grassland, and wetland, leading to an overall regional ESV decline. The conversion of large areas of grassland into cropland, barren land and built-up land has led to the gain or loss of regional ESV. The increase in the area of built-up land is mainly due to the encroachment of cropland, grassland, water area and barren land, and its negative impact on the regional ESV.
Discussion
Interpreting the Driving Factors of Land Use/Cover Change from 1990 to 2020
The influencing factors for the formation of land use/cover change hotspots should be divided into two parts: natural geographic factors and socioeconomic factors [8, 45]. Natural geographic factors such as elevation and climate do not change in a short period and are more predominantly reflected in the distribution of spatial differences, and therefore are usually reflected at large scales [46, 47]. In contrast, socioeconomic factors have a more pronounced effect at small time scales, and it has been shown that human behavior is the dominant factor in land use and cover change [9, 48]. There are many different production and lifestyles in the arid regions, and under the combined influence of natural and human activities, the land use types in the region underwent more pronounced changes from 1990 to 2020. This study demonstrated that during the land use change in the arid regions of Northwest China, cropland, forestland, water area, wetland and built-up land have been increasing and grassland and barren land have been decreasing. Among them, the conversion of cropland types was dominated by urban construction occupying cropland and reclamation and returning farmland/abandonment in Southern Xinjiang. Due to the development of oasis agriculture in Xinjiang and the Hexi Corridor in Gansu, a large amount of surrounding cropland has been reclaimed, and the intensity and area of cropland reclamation were much greater than the intensity and scope of the project of returning farmland to forestland and grassland, and cropland showed expansion characteristics [49]. The increased area of forestland was sparsely distributed, mainly occurring in the Northern Xinjiang Junggar Basin in the return of cropland to forestland and grassland as well as a small portion of forestland and grassland interconversion. Long-term grassland reclamation to meet both food and grazing needs, overload use of grassland and some unreasonable management systems were also among the main causes of grassland degradation [50]. The water area expansion was mainly dominated by the conversion of barren land, grassland and cropland, mainly concentrated in the areas near the Kunlun Mountains and Qilian Mountains, the boundary between the first and second terraces of the complex topography of China, and the Tianshan Mountains in central Xinjiang. The construction land expansion was mainly based on encroachment on farmland and distributed in the spreading areas of small towns. To meet the multiple land demands in the urbanization and industrialization process, cities have been expanding outward, and it was the construction land expansion that was influenced by multiple factors of natural background coercive conditions and economic and social development process.
The influence of human factors on land use change has been much greater than the role of any natural factors. From a policy perspective, national cropland protection policies and the exploitation of reserve cropland resources have led to an increase in the area of cropland in local areas. Despite the implementation of ecological projects such as returning farmland to forestland and grassland, in the context of continued emphasis on national food security, the development of unused land reclamation and oasis agriculture has become the main way to expand cropland, along with the conservation strategy of cropland quantity, quality and ecology. Since 2000, the nation’s implementation of the “Returning Cultivated Land to Forestland (Grassland)”, “Three North Protection Forest Project”, small water basin management and other forestry ecological projects have made significant achievements, and ecological land (such as forestland, water area and wetland) has increased. In recent years, the scale and scope of the national ecological protection project and the ecological construction of the Northwest Oasis have shown a certain degree of reduction, mainly to supplement and consolidate, and the growth rate of forests has slowed down. With the deployment and implementation of the State Council policy of “Western Development”, population growth and rapid economic and social development have directly accelerated the construction land expansion. However, there have been serious challenges to ecological protection and ecological barrier maintenance in the arid regions of Northwest China, and further strengthening territorial spatial development control is an important part of ecological civilization construction in the new era [8, 51].
Incorporating the ESV into Land Use and Ecological Conservation Decisions
The impact of land use change on ESs is complex, as it affects the structure and function of these services [52]. The arid region of Northwest China has a unique and typical land use and cover gradient landscape. The spatial distribution of the ESV in the arid region of Northwest China showed a decreasing trend from north to south and from east and west to central. This is because the ESV was influenced by factors such as land use patterns, human activities and climate change [53]. The different directions of land conversion lead to large differences on ecosystem services in the region. This study dynamically monitored the annual variation characteristics of ESV using the CLCD, and detailed analysis of the impacts of cropland expansion, grassland degradation, and built-up land expansion on the ESV. It was found that the ESV in the arid region of Northwest China showed a fluctuating upward trend from 1990 to 2020, increasing from 641.075 billion US$ in 1990 to 665.157 billion US$ in 2020, a result that enriches previous studies that focused only on the impact of land use change on ESV of individual years in localized regions [28, 30]. How to effectively maintain the ecological environment of the arid regions in Northwest China, which are sensitive and weak in ecological restoration, has been the key issue. Therefore, to achieve the goals of local food security, economic development and ecological protection, the following aspects should be paid attention to in the future protection of territorial spatial. Firstly, we should focus on the way of optimizing the land use structure with the enhancement of ESV, and appropriately control the construction land expansion and the increase of degraded grassland; Secondly, reducing the land transfer from land with high ESV to land with low value, strengthening ecological protection in areas with high ESV, preserving and increasing a certain proportion of forestland and grassland, and stabilizing the regional ecological environment; Finally, promoting the optimization of land layout and improving ecological value through the implementation of ecological restoration of territorial spatial and comprehensive land improvement projects.
Validity, Limitations, and Future Directions
At present, there is a relatively small amount of literature that systematically studies the spatial and temporal response of ESV under multiple land use decisions in the arid regions of Northwest China. In this paper, the historical characteristics of ESV are estimated using the CLCD with a spatial resolution of 30m. Meanwhile, the effects of cropland expansion, grassland degradation, and built-up land expansion on ESV are explored, which fills the gap of existing studies in the study area. Due to the advantages of reliability and operability, the revised equivalence coefficient table by Xie et al. (2008) has been widely used for ESV estimation in China [36]. In this study, the ecosystem service equivalent coefficients were simply revised based on the economic value of farmland production, which has some limitations for accurate ESV assessment. Future work should revise the equivalence coefficient table in conjunction with spatio-temporal modifiers such as normalized vegetation index (NDVI) and net primary productivity (NPP) [37] to better match the classification system of the CLCD.

