

Introduction
Affected by global warming and human factors in recent years [1], lakes and reservoirs worldwide have frequently faced the problem of cyanobacterial blooms. Microcystis aeruginosa (M. aeruginosa) is one of the main algal species in cyanobacterial blooms. Physical, chemical, biochemical, and other methods can inhibit the excessive growth of harmful algae [2]. However, many methods are expensive, unsatisfactory, and may cause secondary pollution [3]; moreover, these methods are difficult to use widely in practice. Therefore, how to inhibit the growth of M. aeruginosa efficiently, economically, and environmentally has become a hot research topic.
The use of plant allelopathic substances has been regarded as an emerging technology inhibiting the growth of harmful algae. Plant allelopathic substances are considered environmentally friendly and efficient natural products, which are highly efficient and targeted, easily degraded under natural conditions, and will not cause ecological accumulation [4]. Plant allelochemicals include phenols, terpenes, flavonoids, quinones, tannins, alkaloids, and fatty acids [5]. According to Loudiki et al. [6], allelopathic substances produced by macrophytes can destroy the composite structure of algal cell membranes and affect photosynthesis, effectively inhibiting the growth of algae. Currently, in the field of plant allelopathic algae suppression, the allelopathic effects of aquatic plants are mainly used to inhibit the growth of cyanobacteria. He et al. [7] found that the phenolic acid chemicals secreted by Myriophyllum spicatum can inhibit the growth of M. aeruginosa. However, aquatic plants have certain limitations in inhibiting algae. For example, aquatic plants contain fewer types of allelopathic substances, and their activity is less vigorous than other types of plants. Some studies on the allelopathic effects of terrestrial plants on algae suppression have been conducted. Hua et al. [8] found that allelopathic substances extracted from rice straw had a tremendous inhibitory effect on the growth of M. aeruginosa; Juglone (5-hydroxy-1,4-naphthoquinone) extracted from Juglans trees studied by Hou et al. [9] also showed that it has a remarkable allelopathic inhibitory effect on algae. However, the current research on allelopathic algae inhibition of terrestrial plants only accounts for a small part of the research on allelopathic algae inhibition, which is far less in-depth than the research on aquatic plants. Research on algae inhibition by terrestrial plants still has enormous space and potential to be tapped.
As a common type of terrestrial plant, Asteraceae plants are widely distributed in nature. Substantial research has reported their allelopathic effects. According to statistics, at least 39 species and genera have allelopathic effects, but the inhibitory effects of Asteraceae plants of algae vary significantly among different species [10]. Li et al. [11] found that A. argyi stalk used as fertilizer would affect the growth of surrounding weeds. A. argyi is a typical higher Asteraceae plant. However, research on its allelochemical inhibition on algae has yet to be carried out. Therefore, if we can analyze the allelochemical components of A. argyi in-depth and explore its algae-inhibiting effect and mechanism, it may enrich the screening range of plants that inhibit the growth of cyanobacteria and provide new materials and methods for controlling cyanobacteria blooms.
This experiment innovatively used A. argyi as the experimental object to extract allelopathic substances and used A. argyi aqueous extract of different concentrations to conduct an allelopathic inhibition experiment on M. aeruginosa. The allelopathic active components in A. argyi aqueous extract were identified by gas chromatography-mass spectrometry (GC–MS). Superoxide dismutase (SOD), peroxidase (POD), catalase (CAT), malondialdehyde (MDA) content, and chlorophyll a (Chl-a) content in algae cells were measured. Furthermore, soluble protein content and changes in extracellular organic matter (EOM) of the algal solution were determined, analyzing its inhibitory mechanism on algae growth and providing a theoretical basis for the study of algae inhibition by A. argyi allelochemicals. Finally, toxicity experiments were conducted using zebrafish and Vallisneria natans as experiment subjects to explore the effect of A. argyi aqueous extract on water ecological security when used to inhibit cyanobacterial blooms.
Materials and Methods
Materials
The A. argyi used in the experiment was collected from Nanjing Laoshan National Forest Park in May 2022 (118°34′25.56″E, 32°5′9.97″N). M. aeruginosa (FACHB-524) was purchased from the Institute of Hydrobiology, Chinese Academy of Sciences, and cultured using autoclaved BG11 in a light incubator. The culture conditions were as follows: the temperature was 25°C, the light intensity was 2000-3000 Lux, the light-dark ratio was 12 h:12 h, and the algae were shaken regularly three times a day. After about 7 days, the algae in the logarithmic growth phase were transferred to a new medium for experiments.
Preparation of A. argyi Aqueous Extract
The picked A. argyi was washed three times with distilled water and dried at a constant temperature for 24 h at 80°C. A solid grinder was used to crush the dried A. argyi into powder, which was screened through a 20-mesh stainless steel sieve. Approximately 10 g of A. argyi powder was taken and soaked in a beaker filled with 200 mL of distilled water. A plastic wrap was used to seal the mouth of the beaker, which was placed in the incubator for 7 days. After the standstill, the powder was ultrasonically extracted at 25°C and 100 kHz for 12 h. Finally, a 0.45 μm filter membrane was used to suction-filter the extract to obtain an aqueous extract of A. argyi with a concentration of 50 g/L (calculated on the basis of plant dry weight). The extract was stored in a refrigerator (4°C) for later use.
Inhibition Experiment of A. argyi Aqueous Extracts on M. aeruginosa
The A. argyi aqueous extract and BG-11 culture medium were placed in a 500 mL Erlenmeyer flask; the total volume was 300 mL, with a pH of 7.0, and the aqueous extract concentrations were 0 g/L (blank control group), 1 g/L, and six experiment groups of 3, 6, 10, and 15 g/L, each with three parallel samples. M. aeruginosa in the logarithmic growth phase was inoculated into each experiment group so that each experiment group’s initial absorbance value (OD680) was 0.1. At this time, the density of algal cells was approximately 5.0×10⁶ cells/L. The experiments were all conducted in a constant-temperature lighting incubator with a temperature of 25°C, a light intensity of 2000–3000 Lux, and a light-dark ratio of 12 h:12 h. The Erlenmeyer flask was regularly shaken three times a day, and the position was randomly changed to reduce the light’s effect on algae growth. Indicators were measured every 24 hours.
Analytical Methods
Determination of Cell Density
The hemocytometer method [12] was used to observe and count under a Nikon E200 microscope, and the absorbance was measured at a wavelength of 680 nm with a UV spectrophotometer to establish the linearity between the density of M. aeruginosa and the OD680 absorbance value. The regression equation is y = 48.44x − 0.2 (x is the OD680 value, y is the algae density, the algae density unit: ×106 cells/L, R2= 0.999), thereby measuring the OD680 value of the algae solution through timing to reflect the density of algal cells.
Microalgal Cell Inhibition
A certain amount of experiment algae solution was taken every 24 hours, a UV-visible spectrophotometer at a wavelength of 680 nm was used to measure its absorbance value, and the M. aeruginosa cell density and the standard curve of the OD680 value were compared to calculate the algae cell density. In reference to the method of Wang et al. [13], the growth inhibition rate of plant allelochemicals on M. aeruginosa was calculated in accordance with the following formula:
where IR is the inhibition rate, N is the density of algal cells in the experiment group after adding plant allelochemical substances, and N0 is the density of algal cells in the blank control group.
GC–MS Analysis
The composition of allelopathic substances in the A. argyi aqueous extract was analyzed and determined using GC– MS (Agilent 7890B-7000C, USA). The chromatographic column specifications are HP-5 ms, 0 m × 0.25 mm × 0.25 μm. The sample injection volume was 10 μL, and the injection port temperature was 280°C. The split ratio was 20:1, and the heater temperature was 280°C. The chromatographic conditions were 40°C, maintained for 5 min; heated to 250°C at 10°C/min; and heated to 280°C at 5°C, maintained for 5 min. Finally, the NIST05a spectrum database was used for analysis to determine the names of each component substance.
Determination of Physiological Indicators of Algae Cells
Pretreatment of algae liquid: A pipette gun was used to absorb 2 mL of algae liquid into a centrifuge tube. The liquid was centrifuged at 12,000 rpm/min for 5 min, the supernatant was removed, and approximately 5 mL of deionized water was added; this operation was repeated thrice. Absorb 2 mL of PBS buffer at 4°C, pH 7.4, and concentration 1 mol/L into the centrifuge tube. The centrifuge tube was placed in an ultrasonic cleaner, and the algae cells were crushed in an ice bath. The power of the ultrasonic cleaning machine was 60%, the ultrasonic crushing time was 5 s, the interval time was 5 s, and the crushing duration was 15 min after the crushing. The crushed cells were centrifuged again at 12,000 rpm/min for 5 min. The supernatant obtained is the crude algae cell enzyme solution required for the experiment.
The soluble protein content was determined by the Coomassie brilliant blue method [14]; the Chl-a was determined by the ethanol method [15]; the MDA content was determined by the thiobarbituric acid method [16]; SOD activity, POD activity, and CAT activity were all measured using colorimetric methods [17]; the conductivity value of the algae solution was measured with a conductivity meter (REX DDS-307A, China). The soluble protein, SOD, CAT, POD, and MDA assay kits were purchased from the Jiancheng Bioengineering Institute (Nanjing, China), and the measurements were conducted in accordance with the manufacturer’s instructions.
EOM and SEM Analysis
Each sample was filtered through a 0.45 μm filter membrane and then subjected to extracellular organic matter (EOM). A fluorescence spectrophotometer (F-320 FL Spectrophotometer, Guangdong, China) measured the fluorescence EEM spectra of all samples. The corresponding scanned emission spectra increased from 250 to 550 nm in 5 nm increments by changing the excitation wavelength from 220 nm to 450 nm at a 5 nm sampling interval.
An appropriate amount of algal fluid was taken into a 50 mL centrifuge tube, 10 mL of PBS buffer was added and cleaned for 10 min, centrifuged at 5000 rpm for 5 min, 10 mL of 2.5% glutaraldehyde solution was added, fixed at 4℃ for 8–10 h, and algal filaments were centrifuged at 5000 rpm for 5 min. Add 10 mL of 50% FAA fixing solution again, mix well, and fix for 3h. The samples were then dehydrated at 30%, 50%, 70%, 90%, and 100% ethanol concentration gradients for 15 minutes, and finally freeze-dried. The samples were observed using a scanning electron microscope (SEM) (Su8010 Hitachi, Japan).
Toxicity Experiment of A. argyi Aqueous Extract on Zebrafish and Vallisneria natans
Given that zebrafish have a sensitive nervous system and their pathological morphology is easy to observe [18], it has been widely used in ecotoxicology research [19]. This experiment selected a body length of 3–4 cm (Ezerinka, Nanjing) as the experiment object. Refer to the M. aeruginosa ecotoxicity experiment on zebrafish [20] to experiment with the effect of A. argyi aqueous extract on zebrafish. A total of 20 zebrafish were placed in each fish box. The volume of experiment water (aerated for 48 hours) in each box were 10 L. The temperature was maintained at about 20±1°C, the pH was 7.0±0.3, and the dissolved oxygen was maintained at no less than 6 mg /L. The extract concentrations in each experiment group were 0, 1, 3, 6, 10, and 15 g/L, and the experiment period was 10 days. The fish were observed regularly every day, and their survival status in each experimental group was recorded. The mortality rate in the control group did not exceed 10%.
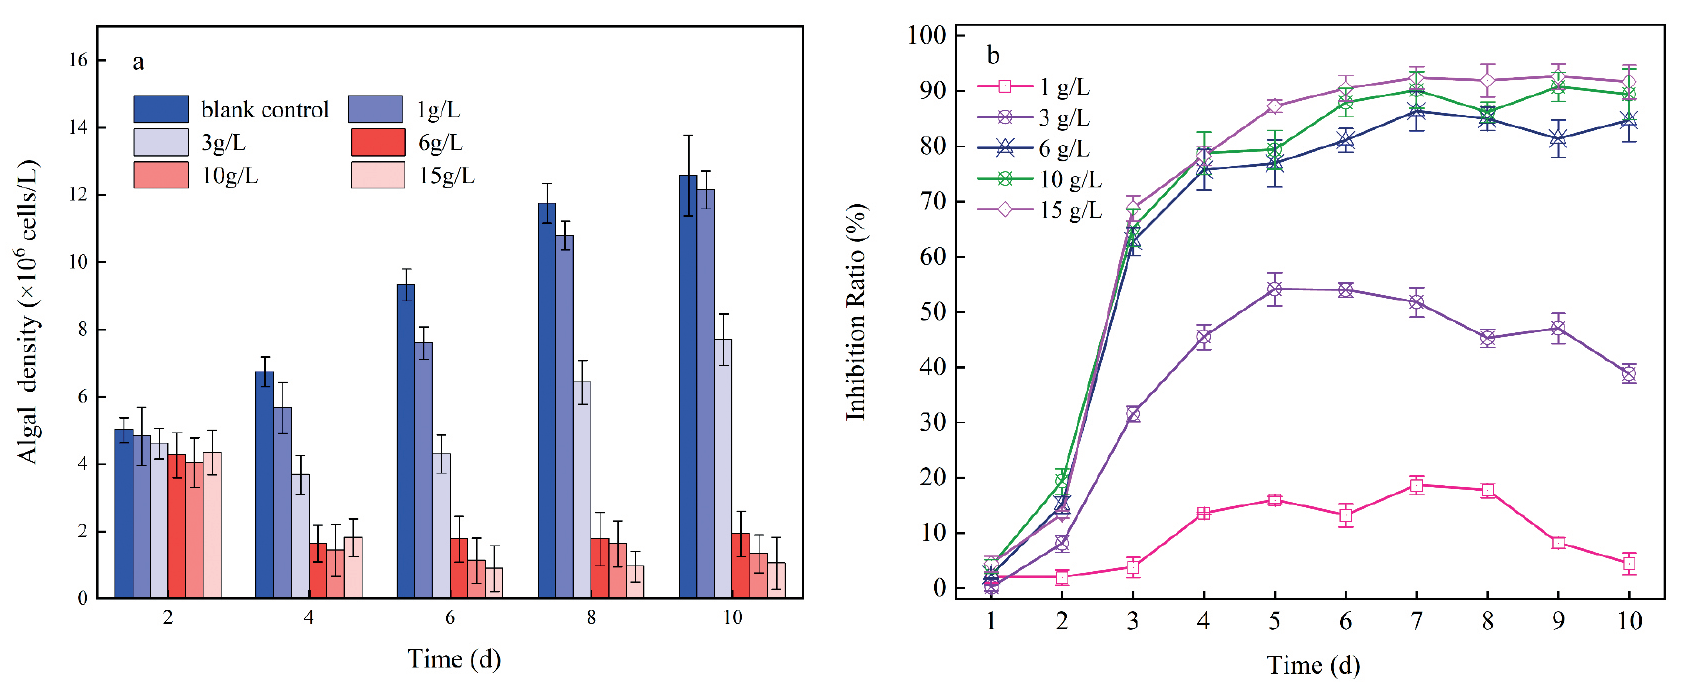
Fig. 1.
Effects of an aqueous extract of Artemisia argyria on the growth of Microcystis aeruginosa: (a) algal density; (b) inhibition ratio.
Vallisneria natans is a submerged plant of the Vallisneria family and genus Vallisneria. It is widespread in rivers and lakes in China. The growth status of Vallisneria can reflect the impact of A. argyi aqueous extract on submerged plants to a certain extent. Vallisneria natans that grow well with a height of (16±1) cm and a weight of (6±0.5) g in the experiment fish box was selected. A total of 12 plants were cultivated in each box. Approximately 5 cm of clay-based gravel was laid at the bottom of the fish box for precultivation 1 week [21]. The concentration of the extract in each experiment group was set at 0, 1, 3, 6, 10, and 15 g/L. The experiment period was 10 days. On days 1, 5, and 10, the growth of Vallisneria natans was recorded, and its Chl-a value was measured.
Statistical Analysis
The half maximal effective concentration (EC50) refers to the concentration that can cause 50% of the maximum effect. The lower the value, the stronger the algal inhibitory ability of the extract [22]. EC50 is obtained by establishing a regression model using SPSS19.0. Excel and SPSS 19.0 were used to process experimental data and statistical analysis, and Origin 2022 software was used for graphing.
Results and Discussion
Effects of A. argyi Aqueous Extract on M. aeruginosa Growth
The growth curve and inhibition rate of M. aeruginosa treated with different concentrations of A. argyi aqueous extract are illustrated in Fig 1. In the experiment, M. aeruginosa in the blank control group exhibited rapid growth, and the density of M. aeruginosa reached 12.58 × 10⁶ cells/L on the 10th day (Fig.1 (a)). Upon the addition of A. argyi aqueous extract, the inhibition rate of algae initially increased and then fluctuated over time. After the third day, the inhibition rate of A. argyi aqueous extract on algae significantly rose. Moreover, with higher concentrations of A. argyi aqueous extract, this inhibitory effect became more pronounced. The maximum inhibition rate in the group with the extract concentration of 15 g/L was 92.64% on the 9th day (Fig.1(b)). The above results indicate that A. argyi aqueous extract had an inhibitory effect on the growth of M. aeruginosa, with significant variation observed among different concentrations. Furthermore, as the concentration of A. argyi aqueous extract increases, its inhibitory effect continues to strengthen.
The inhibitory effect of low concentrations of A. argyi aqueous extract on M. aeruginosa is limited. As depicted in Fig. 1 (b), even at concentrations of 1 and 3 g/L, the extract still exhibits some inhibitory effect on M. aeruginosa throughout the entire experimental period, although the effect is insignificant. This implies that low concentrations of allelochemicals may not induce significant stress on algae and may degrade over time, resulting in diminished inhibitory effects. This observation aligns with the conclusion of Qian et al. [23], who found that low-concentration Houttuynia extract exhibited poor inhibitory effects on M. aeruginosa. Conversely, the results indicate that A. argyi aqueous extract concentrations exceeding 6 g/L significantly inhibit M. aeruginosa. When the concentration of allelochemicals surpasses the alga’s anti-inhibitory capacity, notable alterations can occur in membrane lipids, proteins, and other vital cell structures within algal cells [24]. Subsequent sections will delve into how A. argyi aqueous extract induces stress on M. aeruginosa and modifies its cellular structure.
Table 1.
10d EC50 of the aqueous extract of Artemisia argyria.
| Botanical | Regression equation | 10d EC50 | 95% Confidence interval |
|---|---|---|---|
| Artemisia argyria | y= 2.194x−0.907% | 2.59 g/L | 1.66/L−2.80 g/L |
In addition, SPSS software was used to perform regression analysis on the obtained experiment data, and the 10-day half-effective concentration value (10d EC50) and dose equation of A. argyi aqueous extract against M. aeruginosa were calculated. The experiment results are shown in Table 1.
Identification Results and Analysis of GC–MS
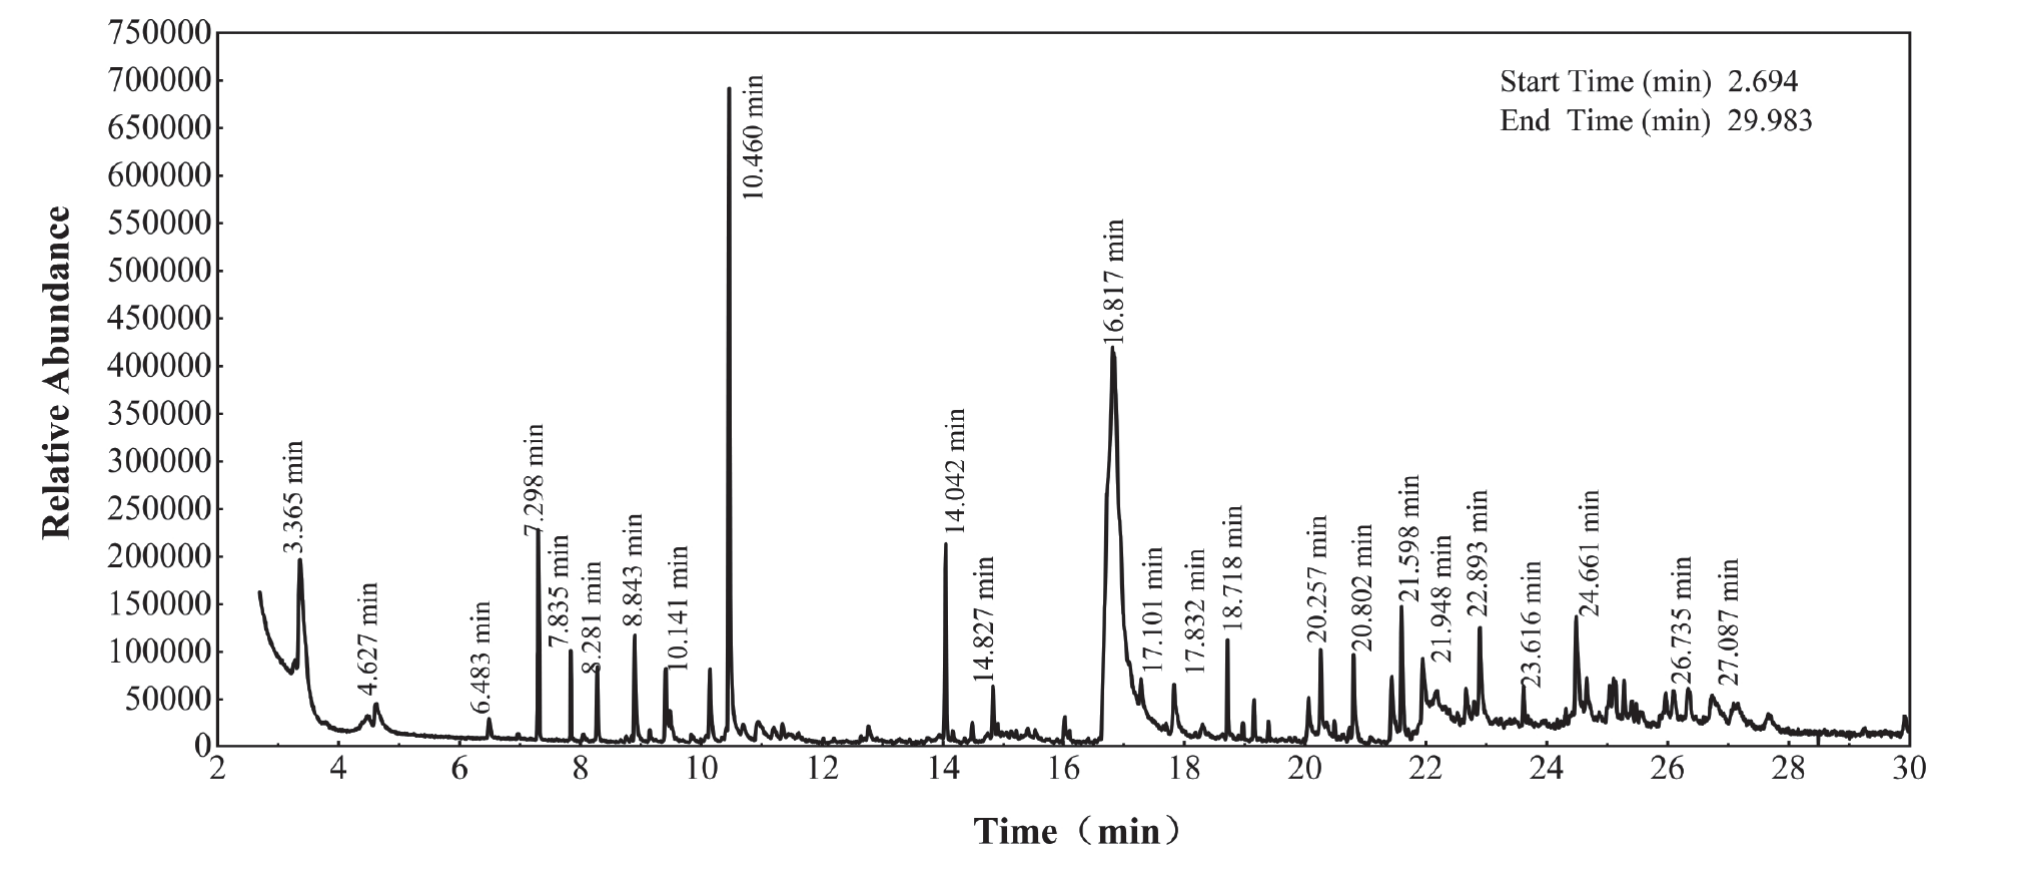
GC–MS analysis was employed to examine the primary components of allelopathic substances in the A. argyi aqueous extract, with the area normalization method utilized to determine the relative content of each chemical constituent. The GC–MS spectrum of the A. argyi aqueous extract is depicted in Fig. 2. Upon comparison with the standard library, Table 2 provides details such as retention time, compound, CAS registry number, and percentage of the identified compounds. The GC–MS spectrum and ingredient list reveal that a total of nine types of compounds were identified, including terpenes, fatty acids, esters, alkenes, phenols, alcohols, aldehydes, and naphthalenes. Among these compounds, terpenoids accounted for the largest proportion, with eighteen species detected at approximately 57.11%. Terpenoids, a broad category encompassing hydrocarbons with the general formula (C5H8)n and their oxygenated derivatives, are primarily found in the secretory tissues of higher plants due to their potent aroma. Composite plants such as mugwort are notably used for the preparation of volatile essential oils. Monoterpene and sesquiterpene compounds, the primary constituents of volatile oil, have been documented to possess relatively active insecticidal and deworming properties, as well as cytotoxicity [25]. Moreover, esters and organic acids are also the major components of the A. argyi aqueous extract. Prior research has indicated that esters and organic acids can be self-oxidized in aqueous solutions, prompting the generation of reactive oxygen species (ROS) and inducing apoptosis in M. aeruginosa [26, 27]. Therefore, we believe that the allelopathic compound of M. aeruginosa is not a single compound but the result of combining several compounds. Moreover, future studies should further isolate and explore which compounds in A. argyi aqueous extract are more conducive to inhibiting M. aeruginosa.
Physiological Impacts of the A. argyi Aqueous Extract on M. aeruginosa
Changes in the MDA, SOD, POD, and CAT
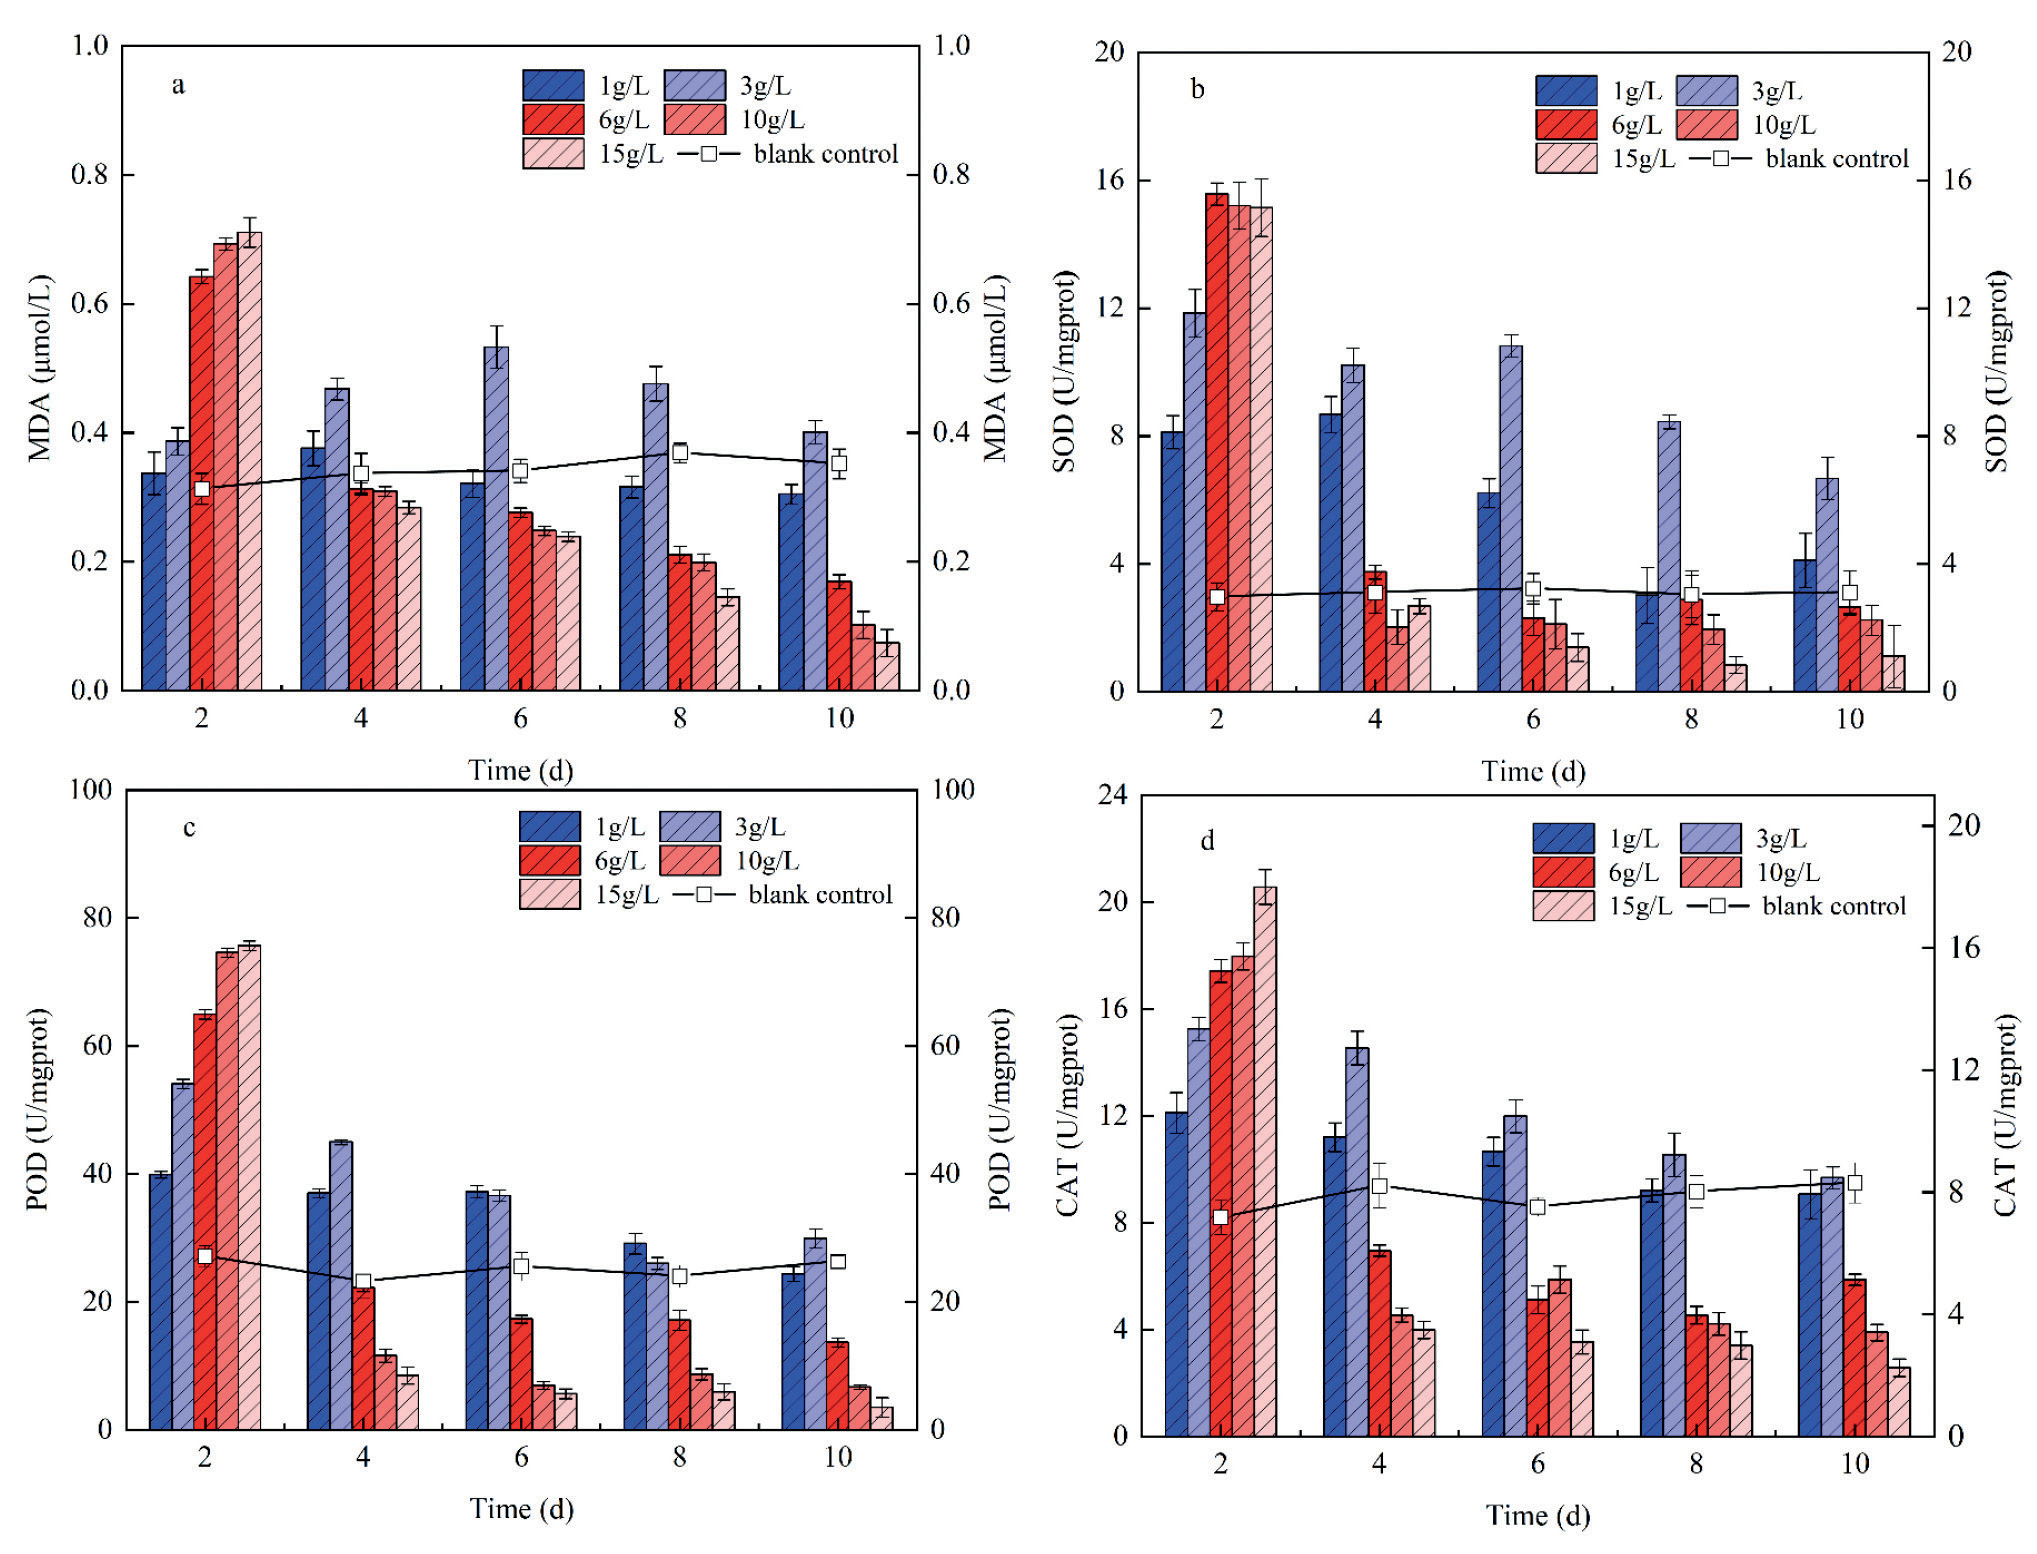
To delve deeper into the inhibition mechanism of A. argyi aqueous extract on M. aeruginosa, indicators representing the physiological characteristics of M. aeruginosa, such as MDA, SOD, POD, and CAT, were measured during the experiment. MDA is a product of membrane peroxidation, and higher MDA content indicates greater lipid peroxidation in the membrane and more damage to algal cells [28]. Fig. 3(a) depicts the impact of A. argyi aqueous extract at different concentrations on MDA content in M. aeruginosa cells. Throughout the experiment period, MDA content in the 1 g/L experiment group was not significantly different from that in the blank control group and remained relatively stable, indicating that the concentration of extract would not cause membrane lipid peroxidation of algal cells. When the concentration of A. argyi aqueous extract was ≥6 g/L, MDA content initially increased before subsequently decreasing over time. The experimental groups with concentrations of 6, 10, and 15 g/L reached peak values on the second day at levels 2.05 times, 2.21 times, and 2.46 times that of the control group, respectively, indicating lipid peroxidation had occurred in algal cells at this time due to invasion by oxygen free radicals into polyunsaturated acids within cell membranes resulting in oxidative stress [29]. However, as the experiment progressed, there was a sharp decrease in MDA content; since day 4th onwards, it has been lower than that of the control group because when algal cells are stressed, they produce many reactive oxygen species (ROS) and free radicals, and ROS and MDA have a positive correlation [30]. Simultaneously, algal cells secrete various antioxidant enzymes to neutralize ROS through the antioxidant system, resulting in a continuous reduction in MDA content within high-concentration experimental groups. This phenomenon is similar to the findings of Chen et al.’s [31] research on M. aeruginosa utilizing quercetin.
Table 2.
Main chemical components of aqueous extract of Artemisia argyria.
SOD is a vital antioxidant metalloenzyme in the antioxidant system of M. aeruginosa, playing a key role in cata-lyzing ROS in the cell body into H2O2. Subsequently, POD and CAT facilitate the further decomposition of H2O2 into H2O, effectively eliminating reactive oxygen species from cells and preventing cellular oxidation [32]. The alterations in SOD, POD, and CAT contents in algal cells under different concentrations of A. argyi aqueous extract are depicted in Fig. 3(b), (c), and (d). On the second day of the experiment, SOD activity significantly surpassed that of the control group in the experimental groups. Throughout the experiment, SOD activity exhibited significant variation in the experimental groups: it gradually declined over time in groups with 1 and 3 g/L extract concentrations but consistently exceeded that of the control group, even on the 10th day. In experimental groups with an extract concentration ≥6 g/L, SOD activity decreased significantly by the 4th day. Starting from the 6th day, SOD activity consistently lagged behind that of the blank control group. The overall change trend of POD and CAT activities was close to that of SOD activity. In experimental groups with an extract concentration ≥ 6 g/L, both POD and CAT activities exceeded those of the blank control group by more than twofold on the second day of experimentation. However, by the 4th day, there was a sharp decline in their activities, which gradually stabilized as days progressed, ultimately remaining consistently lower than those observed in the control group.
Initially, there was a notable elevation in SOD, POD, and CAT levels across all experimental groups. This can be ascribed to the stress induced by A. argyi aqueous extract on the growth of M. aeruginosa, resulting in a significant increase in ROS content within algal cells. Algal cells responded to this oxidative stress by activating their intricate antioxidant enzyme system, leading to the swift accumulation of these enzymes. As the experiment progressed, the activities of SOD, POD, and CAT decreased in all concentration groups due to continuous consumption of these antioxidant enzymes for scavenging free radicals. Consequently, levels of SOD, POD, and CAT were reduced. Furthermore, excessive ROS exceeded the tolerance threshold of certain algal cells, leading to the inhibition of the antioxidant enzyme system [33]. This ultimately culminated in the collapse and inactivation of the antioxidant system within algal cells. Ultimately, the activity of each enzyme system in the antioxidant system was lower than that of the blank control group. Thus, it can be inferred that high concentrations of A. argyi aqueous extract have the potential to weaken or even destroy the antioxidant system within algal cells, thus exhibiting specific algae-killing properties.
Changes in the Soluble Protein and Chlorophyll A Content
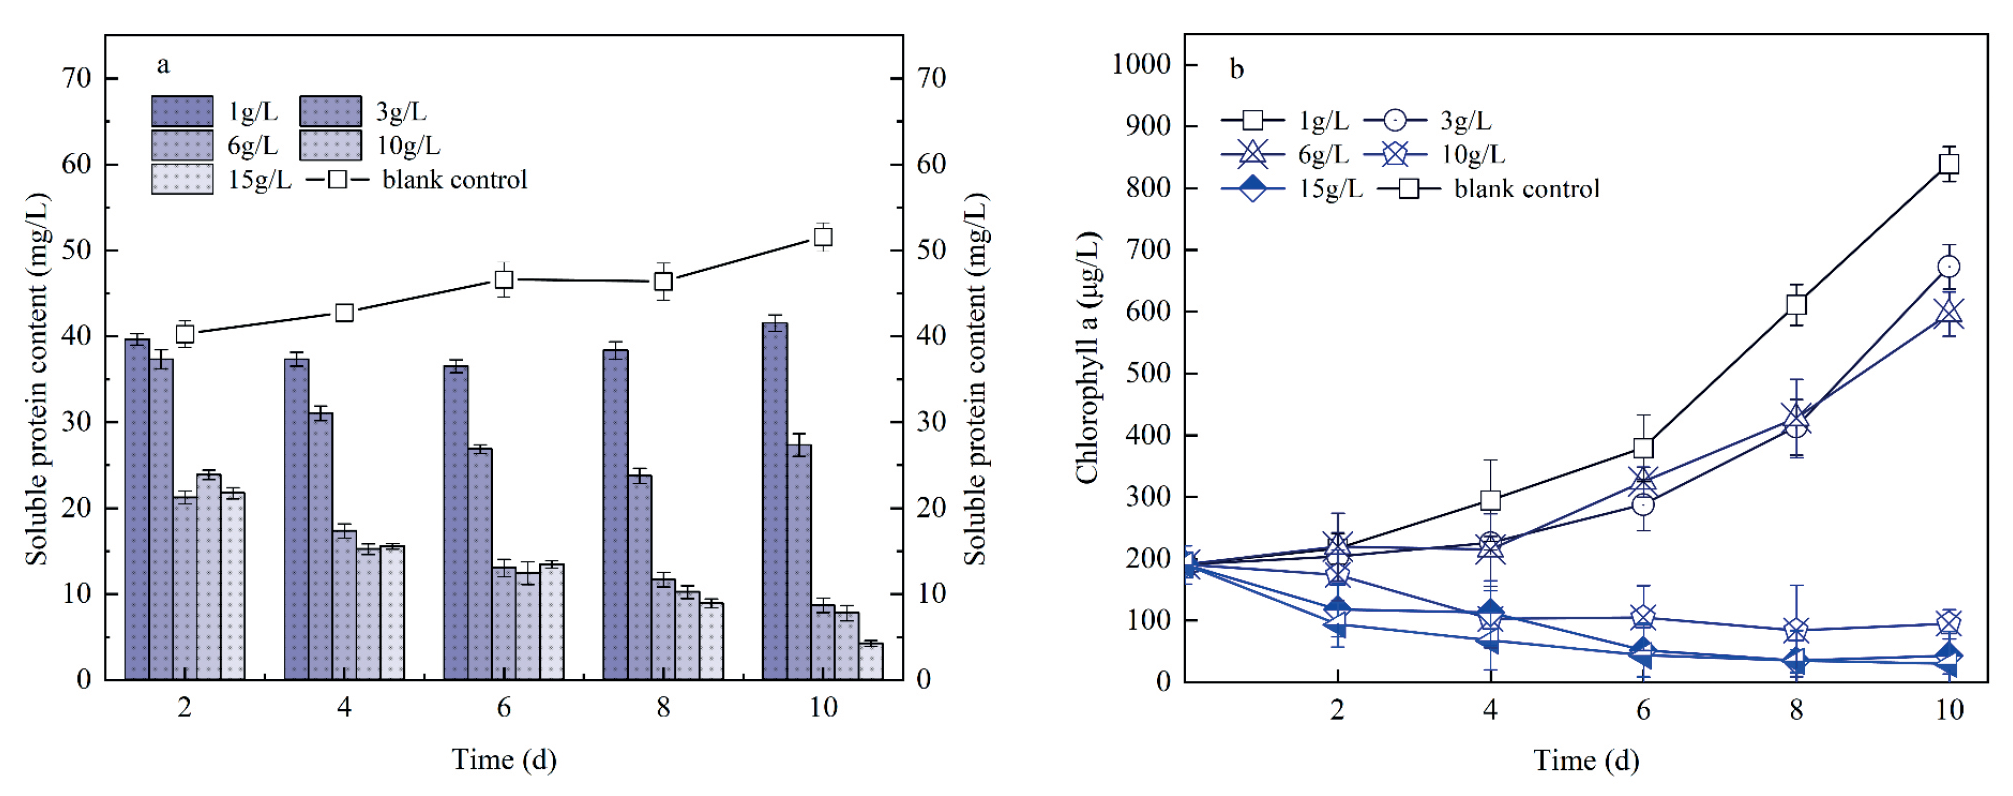
The soluble protein in algal cells is directly related to the growth and metabolism of algal cells, and the increase of soluble protein can improve the water retention ability of cells, thereby protecting their important substances and biofilms [34]. Fig. 4(a) illustrates the impact of A. argyi aqueous extract concentration on soluble protein content in M. aeruginosa cells. The soluble protein content of M. aeruginosa in each group was consistently lower than that in the control group and gradually decreased with increased extract concentration. Soluble protein in groups with 1 and 3 g/L exhibited a gradual increase in the later stages compared to other experimental groups. This phenomenon may stem from algae›s ability to self-regulate in response to stressors at lower extract concentrations, as suggested by the research of Xu et al. [35]. However, the soluble protein content of algal cells in other concentration groups exhibited a gradual decline, which is due to the increase of MDA content and the lipid oxidation of cell membrane caused by A. argyi aqueous extract, resulting in the reduction of protein content, cleavage, and internal dissolved matter overflow, which can no longer be adjusted by itself and thus inhibit algal growth.
The Chl-a content is intricately linked to the photosynthetic activity of M. aeruginosa cells. Previous research has shown that allelopathic substances can impede the synthesis rate of Chl-a in algal cells, affecting their photosynthetic efficiency and ultimately resulting in biomass reduction [36]. Fig. 4(b) illustrates the impact of A. argyi aqueous extract concentration on Chl-a content in M. aeruginosa cells. During this experiment, a gradual reduction in Chl-a content in algal cells was observed when the concentration of A. argyi aqueous extract exceeded 6 g/L. This observation implies that A. argyi aqueous extract influences the photosynthetic process of algal cells, consistent with findings by Ni et al. [37], who reported that artemisinin extracted from composite decreases the photosynthetic pigment in M. aeruginosa. Chen et al. [38] conducted algal inhibition experiments using fresh camphor leaf extract and found that it mainly contained terpenoids, esters, and other substances that could also reduce the maximum photochemical quantum yield of M. aeruginosa. Chloro-plasts play a crucial role in Chl-a production and photosynthesis in microalgae, serving as primary sites for ROS production [39]. Given the activities of antioxidant enzymes and the aforementioned changes in MDA content, it can be inferred that a high concentration of A. argyi aqueous extract will induce the generation of numerous ROS within the chlorophyll of algal cells. Subsequently, ROS can disrupt the structure and function of the photosynthetic complex, leading to a reduction in Chl-a content. Thus, the reduction of Chl-a in algal cells by A. argyi aqueous extract may represent one of the mechanisms by which allelopathic substances suppress algal growth.
Effect of A. argyi Aqueous Extract on the Integrity of M. aeruginosa Cell Membrane
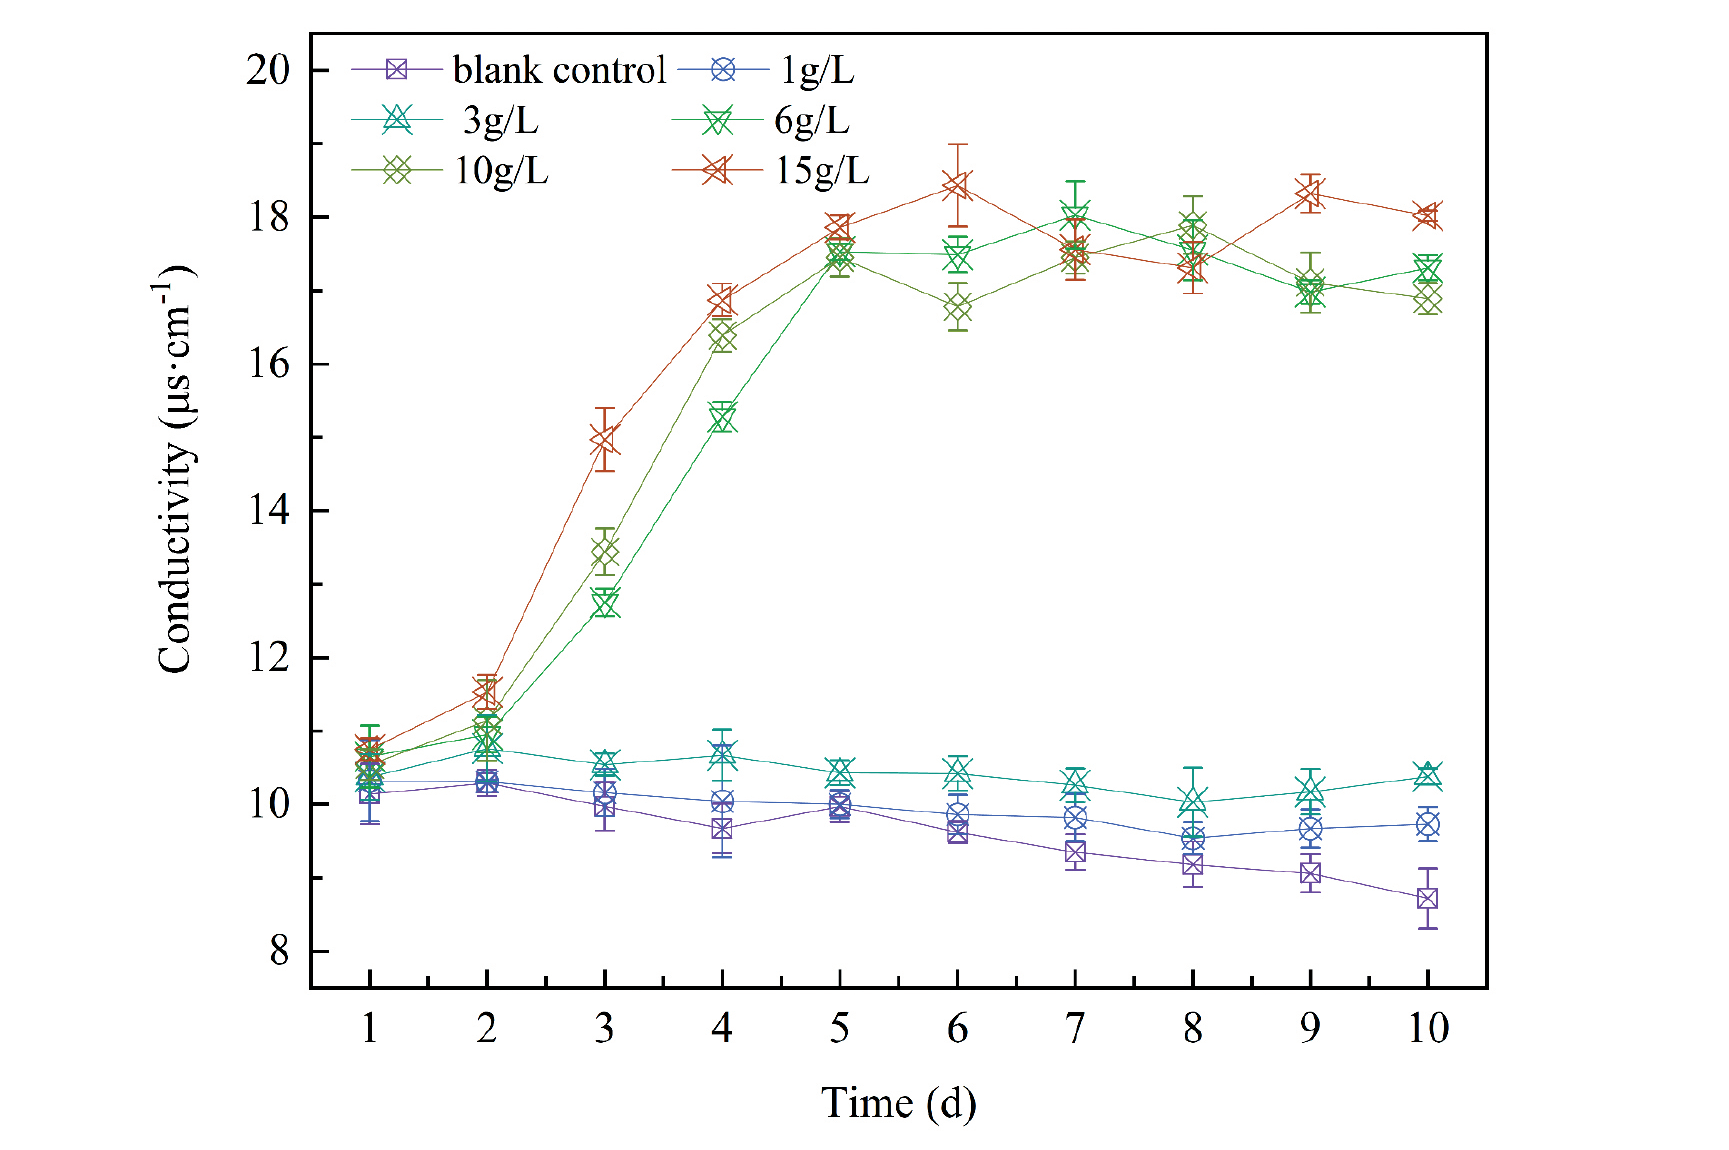
Variations in algal fluid conductivity directly mirror alterations in algal cell membrane permeability. Under stress or damage, the permeability of algae cell membranes increases, facilitating electrolyte outflow and elevating extracellular solution conductivity [40]. Fig. 5 illustrates variations in the conductivity of the M. aeruginosa algae solution under different concentrations of A. argyi aqueous extract. The conductivity value in the blank control group is closely related to the density of algae. With the extension of the experiment and the increase in algae density, the conductivity value gradually declines. This suggests that algae cells assimilate trace elements from the culture medium during growth, reducing free ions outside the cells and diminishing solution conductivity. The conductivity of the algae solution in the 6, 10, and 15 g/L experiment groups increased remarkably, indicating that the cell membrane permeability changed and intracellular substances flowed out of the body. Yu et al. [41] indicate that certain bioactive substances, including allelochemicals, compromise membrane integrity by causing damage to cell membranes, imbalances in ion channels, and changes in membrane permeability. The experiment also demonstrated that the cell structure of M. aeruginosa was impacted, and the growth of algal cells was inhibited when the concentration of A. argyi aqueous extract exceeded a certain threshold.
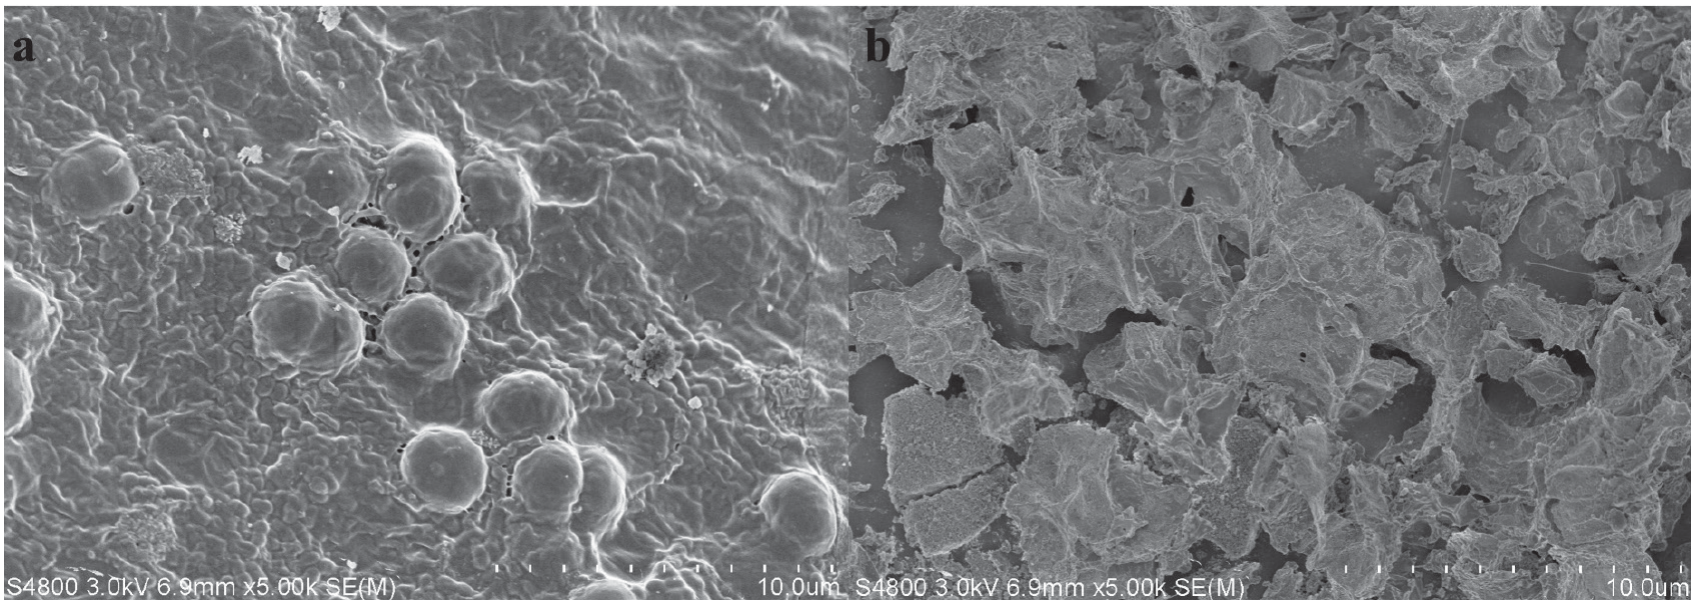
To directly observe the impact of A. argyi aqueous extract on the cell structure of M. aeruginosa, SEM images were captured on the 10th day for both the blank control group and the experimental group treated with 15 g/L extract. In the control group, algal cells appeared spherical and smooth, exhibiting good cell integrity. However, we observed cell atrophy and disintegration in the experimental group treated with 15 g/L. We hypothesize that under the stress of A. argyi aqueous extract, lipid oxidation of the cell membrane and increased permeability of algal cell membranes occur, leading to increased efflux of algal cell fluid, cell atrophy, membrane integrity damage, and ultimately, cell destruction. This analysis is supported by the significant increase in MDA, SOD, POD, and CAT activities observed in the high concentration group at the beginning of the experiment, as well as the atrophy and death of algal cells observed in the SEM images post-experiment.
Effects on Extracellular Organic Matters
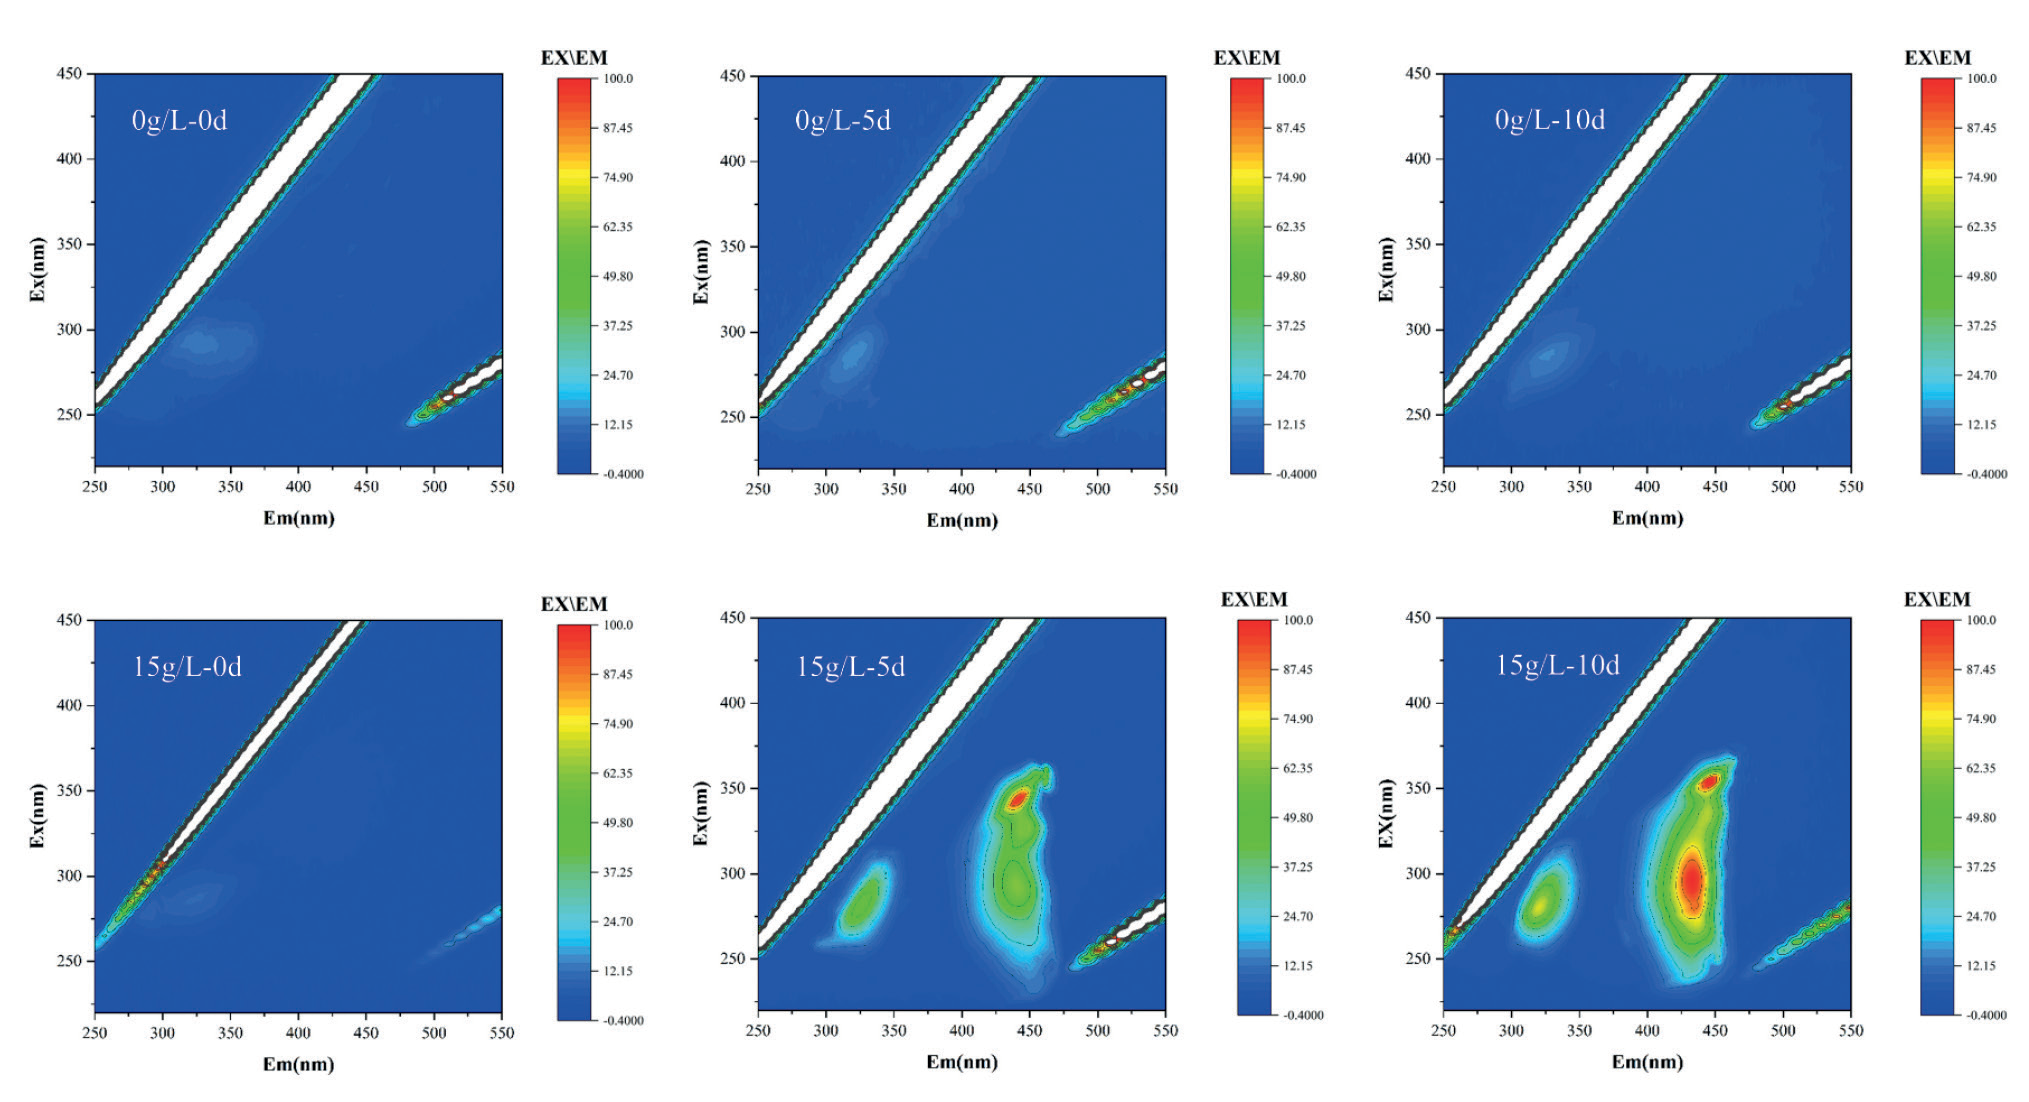
The fluorescence excitation-emission matrix (EEM) can reflect the presence of organic matter in water [42], and the EEM in this experiment reflects alterations in the composition of extracellular organic matter (EOM). The three-dimensional EEM fluorescence spectra of M. aeruginosa EOM treated with A. argyi aqueous extract at different concentrations (0 and 15g/L) after 0, 5, and 10 days are shown in Fig. 7. In this experiment, the EEM fluorescence spectrum mainly exhibits three prominent peaks: the first peak mainly reacts at 280/330nm Ex/Em, and the other two peaks mainly react near the Ex/Em of 355/445 and 275/450 nm. These peaks reflect the changes of protein, humus, and fulvic acid, respectively [43, 44]. The EEM fluorescence spectra of the blank control group remained relatively stable, suggesting normal growth of M. aeruginosa. The EEM fluorescence spectra of M. aeruginosa under the treatment of 15g/L A. argyi aqueous extract mainly reflected the increase of extracellular protein, humus, and xanthohumic. It is normal for EOM to contain protein because protein is a vital component of algal cells, and a small amount of protein can be released through cell metabolism [45]. The rise in extracellular proteins could be linked to the high concentration of A. argyi aqueous extract, causing the increase of cell membrane permeability and the release of intracellular soluble proteins and various enzymes. Additionally, an increase in fluorescence intensity of humus and fulvic acid peaks occurred due to the decomposition of organic macromolecules, including proteins and polysaccharides, from deceased algal cells [46]. This observation is consistent with SEM characterization results presented in Fig. 6, suggesting that a high concentration of A. argyi aqueous extract can modify the permeability of M. aeruginosa cell membranes. This alteration leads to changes in crucial cell structures such as membrane lipids and proteins within the cell body, ultimately resulting in atrophy and death of the algal cells.
Toxicity of A. argyi Aqueous Extract on Zebrafish and Vallisneria natans
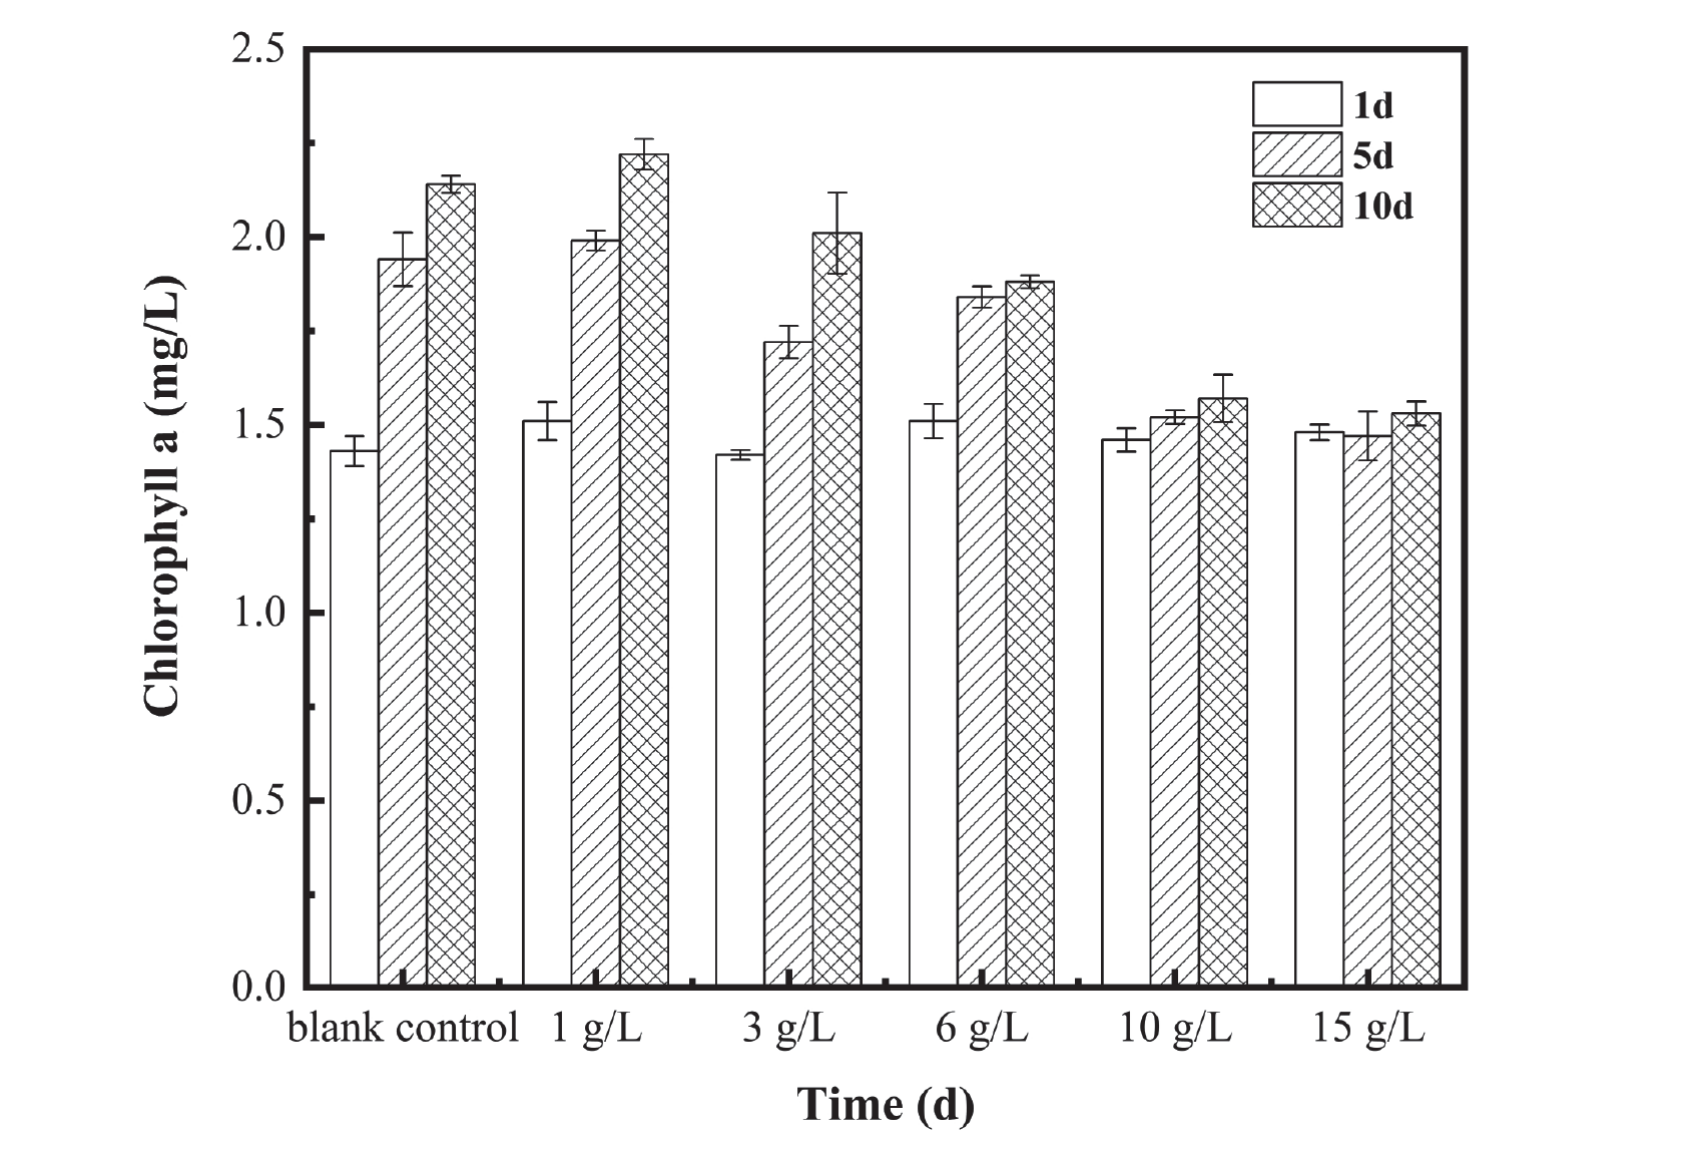
The impact of different concentrations of A. argyi aqueous extract on the survival rate of zebrafish is presented in Table S2. Zebrafish in the blank control group exhibited healthy growth throughout the experiment and did not experience any mortality. As the concentration of the extract increased, there was a gradual decrease in the survival rate of zebrafish in each experimental group, especially since the zebrafish in the 15 g/L experimental group appeared to have died on the first day. Subsequently, there was a downward trend in the survival rate, with only 55% surviving on the 10th day. Additionally, the 10d EC50 of M. aeruginosa on zebrafish was 19.82 g/L by SPSS software, which was higher than the 10d EC50 of A. argyi aqueous extract on M. aeruginosa (2.59 g/L), indicating that the toxicity of A. argyi aqueous extract on zebrafish was less than that on M. aeruginosa. Fig. 8 shows the effects of different concentrations of A. argyi aqueous extract on chl-a content in bittergrass. It can be observed from this figure that except for the 15 g/L experimental group, all other experimental groups showed a similar change trend with a slight increase as time progressed. For the 15 g/L experiment group, the chl-a content was almost kept within the range of 1.5(±0.03) mg/L during the experiment period, and the change range was small, indicating that A. argyi aqueous extract did not affect the growth of Vallisneria natans.
Considering the potential impact of a high concentration of A. argyi aqueous extract on the survival rate of zebrafish, it is recommended to control the concentration of the extract at approximately 6 g/L when using it to inhibit the growth of M. aeruginosa; at this concentration, the extract is found to be less toxic to zebrafish. The different concentrations of A. argyi aqueous extracts in each group did not have a considerable impact on the growth of Vallisneria natans and still had good aquatic ecological safety. Additionally, considering the biodegradability of the extract [47] and not maintaining a high level in the water body, it can be inferred that the A. argyi aqueous extracts have almost no adverse effects on aquatic ecological health.
Conclusions
This study utilized A. argyi aqueous extract as an inhibitor and investigated the effects of different concentrations of A. argyi aqueous extract on the growth of M. aeruginosa under laboratory conditions. The primary allelopathic substances in A. argyi aqueous extract include terpenoids, esters, and organic acids, with terpenoids constituting up to 57.11% of the total composition. The inhibition experiment revealed that A. argyi aqueous extract at various concentrations has an inhibitory effect on the growth of M. aeruginosa. Specifically, when the concentration of A. argyi aqueous extract is ≥ 6 g/L, a significant algal inhibitory effect was observed; notably, the inhibition rate of M. aeruginosa reached 91.76% under the influence of 15g/L A. argyi aqueous extract. According to the physiological index experiment of M. aeruginosa, it is inferred that A. argyi aqueous extract reduces the Chl-a content of algal cells and increases the permeability of the cell membrane, thereby increasing the concentration of allelochemical substances in the cytosol, triggering changes in other physiological indicators, and causing algae cell death. Cell membrane rupture and Chl-a reduction may be vital signs of allelopathy. The 10-day EC50 of A. argyi aqueous extract against zebrafish was 19.82 g/L and had no adverse effects on Vallisneria natans. Given that A. argyi aqueous extract has an excellent inhibitory effect on M. aeruginosa and has good ecological safety, it is expected to be used as an eco-friendly inhibitor for the prevention and control of cyanobacterial blooms after subsequent verification of the effect in the field. Future research efforts could focus on isolating specific allelochemical components within A. argyi aqueous extract, which is crucial for understanding their internal mechanism acting upon M. aeruginosa. This study provides valuable insights for future promising studies aimed at gaining a clear understanding regarding mode-of-action mechanisms associated with allelopathic extracts derived from Asteraceae crops targeting M. aeruginosa.

