

Introduction
The rapid construction of a high-speed transportation network provides an essential guarantee for the rapid development of the local economy, especially in the southwest mountainous area with complex geological conditions, which can effectively shorten the driving distance. Expressway construction will promote local traffic and economic development and inevitably affect the soil ecosystem in the region to varying degrees [1, 2]. Due to the prominent heavy metal pollution of soil in karst areas, soil utilization efficiency in karst areas will be further reduced [3, 4]. The present study indicates that soil and crops along the highway are polluted by varying degrees of Pb, Zn, Cd, Cr, Cu, and other heavy metals. Heavy metals in the soil along the highway mainly come from gasoline combustion, exhaust emissions, brake pad wear, tire wear, and road subgrade weathering. All of the above conditions may lead to the release of substances containing heavy metals, which become the primary pollution or an essential source of Pb, Zn, Cd, Cr, Cu, and other heavy metals in the soil [5, 6]. At the same time, expressways are characterized by large traffic flow, good mobility, and wide diffusion areas, and their potential impact on the surrounding soil’s heavy metal pollution cannot be ignored [7], especially regarding the accumulation of heavy metals in the soil surface [8]. At the beginning of the study, heavy metal pollution in soil near highways was mainly focused on Pb pollution [9, 10]. The research results show that the Pb content in the soil near the highway is significantly higher than its average background value, and the Pb content is significantly inversely proportional to the distance from the highway [11]. Although unleaded gasoline has been used at this stage, Pb remains in the soil for over 100 years [12]. The research results of soil pollution near the Hefei Expressway, Shanghai-Nanjing Expressway, and Beijing Expressway in China also pointed out the existence of Pb pollution [13-15], which shows that heavy metals will continue to affect the soil ecosystem on both sides of the highway for a long time. In addition, some relevant studies have found that Cu, Cd, Zn, and other elements also exist in the soil on both sides of the highway, which are significantly higher than their average background values and become the main heavy metal pollution elements [16-18]. In addition, the accumulation and distribution of heavy metals in this soil ecosystem will lead to the risk of heavy metal composite pollution on planted plants [19-21]. With the increase in highway traffic service life and traffic flow, the heavy metal accumulation of some compounds in soil generally increases, and its content has a positive relationship with vehicle speed [22]. It can be seen that the highway has an undeniable negative impact on the soil around the highway, with potential long-term effects that necessitate immediate action.
As the main carrier of the future transportation hub in the Guangxi Zhuang Autonomous Region, the expressway has a significant potential or existing impact on the farmland environment along the highway. This impact underscores the importance of the research and its relevance to the reader. The importance of the research cannot be overstated, as it provides crucial insights into the potential or existing impact of the expressway on the farmland environment. Therefore, it is crucial to stress the need for safety planning and construction in the early stage of highway construction to reduce or avoid heavy metal pollution to soil on both sides. Although there have been numerous research results on the heavy metal pollution in soil by highways, there are relatively few studies on the soil pollution in karst areas in southwest China during the construction period of highways. This paper addresses this gap by taking the Hezhou-Bama Expressway (Laibin to Du'an section), which will be put into use in 2023 in the Guangxi Zhuang Autonomous Region, as a case study. The research object samples and analyzes the heavy metal contents and distribution characteristics of Cu, Pb, Zn, Cd, As, and Hg in the soil surrounding the highway and determines the soil moisture content, δ13C, and δ15N. The purpose of this paper is to stress the importance of safety planning and construction in future highway projects and to provide a scientific basis for crop planning and planting along local high-grade highways. It also includes technical support for ecological and environmental benefit evaluations around highways.
Materials and Methods
Study Area
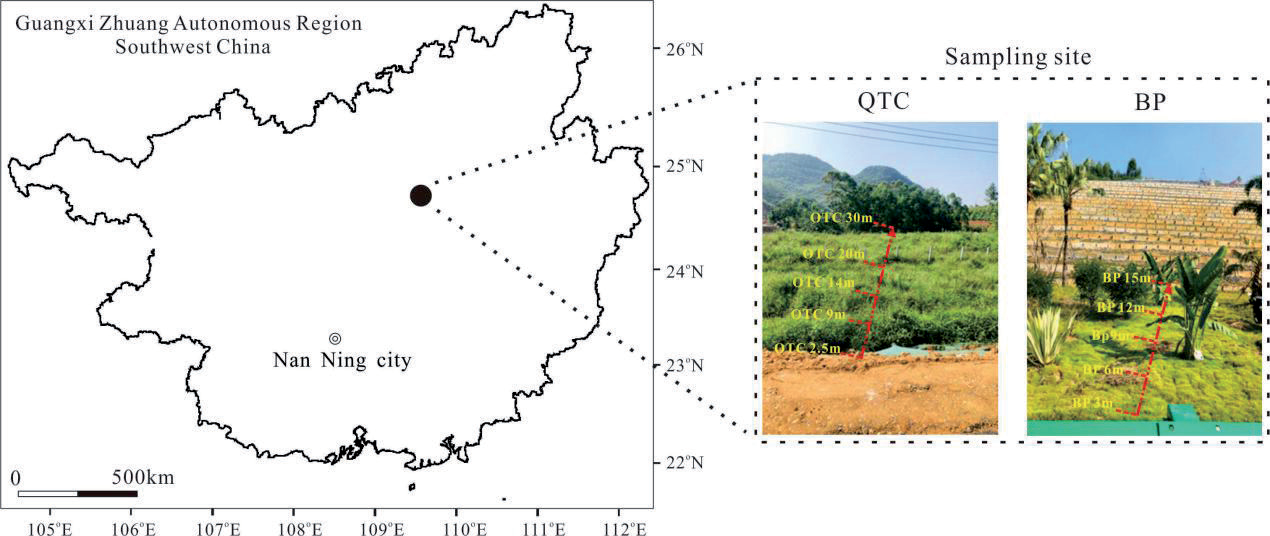
The research area of this paper is located in the Hezhou-Bama Expressway (Laibin to Du'an section) NO. 2 section YK296+300~YK296+580, which is situated in Nongchang village, Xincheng County, Laibin City (as shown in Fig. 1). Xincheng County is located in the monsoon climate zone of transition from subtropical to subtropical. The Tropic of Cancer runs through it. Sunshine is relatively abundant, the climate is mild, and the rainfall is plentiful. It is a denudative hilly landform with a slight relief, with a ground elevation of 145-180 m and a relative elevation difference of 35 m. In the autumn of 2022, there was very little rainfall and severe drought. From September 17 to December 31, 2022, the precipitation was only 162 mm, of which the precipitation in October was only 17.8 mm. The underlying bedrock is the weathered limestone of the Lower Triassic Qixia Formation (P1q).
Sample Collection
Soil samples were collected in October 2022, and plots with similar slopes were selected as sampling sites. Located east of the highway, each sampling point is 5-10 meters apart, and the sample name is QTC series. Located west of the road, each sampling point is 3 meters apart, the sample name is BP series, and there are 5 points in this section. According to previous studies on heavy metal pollution in soil, heavy metals along the highway mainly accumulate in 0-20 cm surface soil [23], and the content of heavy metals in 0-10 cm soil is significantly higher than that in 10-30 cm soil [24]. Therefore, each quadrate was arranged in an 'S' shape, and 0-10 cm surface soil samples were taken. Surface vegetation, grassroots, and visible stones were removed for sample collection. To ensure the uniformity and representativeness of samples at sampling points, soil from 3 sample points in each quadrat was mixed. The collected samples were kept in a field sampling cooler and returned to the laboratory for analysis and testing. The soil sample to be tested is dried naturally at room temperature, ground with a soil grinder, and passed through a 100-mesh screen, a process that guarantees the thoroughness and accuracy of our testing.
Sample Analysis
Soil moisture content was determined by the drying method according to the "Soil Moisture Determination Method" NY/T 52-1987; soil pH is determined using the PHS-3C pH meter (Shanghai Lei-magnetic Company), according to "Soil Testing Part 2: Determination of Soil pH" NY/T 1121.2-2006, using the electrode method (soil to water ratio 2.5:1). The cation exchange capacity in the soil is determined based on the “Determination of Cation Exchange Capacity in Forest Soil” LY/T 1243-1999, using the ammonium acetate exchange method and the ammonium chloride-ammonium acetate exchange method. Cu, Pb, Zn, Cd, Mn, and As in soil were determined using the iCAPQ Inductively Coupled Plasma Mass Spectrometer (ThermoFisher Scientific). An MA-3000 automatic mercury meter (NIC Corporation of Japan) measures Hg in the soil. The total organic carbon, total nitrogen, and their δ13C and δ15N contents were determined by the EA IsoLink Elemental Analyzer in conjunction with the 253 Plus Gas Isotope Mass Spectrometer (ThermoFisher Scientific, USA). All the above tests were completed at the Institute of Karst Geology at the Chinese Academy of Geological Sciences. In each batch of samples, a proportion of no less than 10% should be inserted into the standard material and repeated samples for whole process monitoring. The standard material and control samples should be distributed in each batch of samples according to the head, middle, and tail, and the standard deviation of the analysis results should be less than 0.20‰.
Soil Heavy Metal Pollution Evaluation Index
The soil environmental risk assessment method on the east and west sides of the expressway was adopted by the soil accumulation index method (Igeo) [25]. This method is a quantitative evaluation method for the degree of pollution of a single heavy metal element in soil, designed by German scientist Muller in 1969, which can take into account the influence of human activities on heavy metal pollution. Its calculation formula is as follows:
Igeo is the ground accumulation index of heavy metals in soil, and Ci is the measured concentration of heavy metals in soil (mg/kg). Si is the background reference value of heavy metals (mg/kg). This paper adopts the research method of soil background value published by the Guangxi Institute of Environmental Protection Science in 1992 and the soil background value of Guangxi, and k is the coefficient of background value change, which is generally 1.5 [26]. According to the degree of pollution, Igeo is divided into 0-6 levels: No pollution, Igeo<0; Slight pollution, 0≤Igeo<1; Moderate pollution, 1≤Igeo<2; Medium intensity pollution, 2≤Igeo<3; Intensity pollution, 3≤Igeo<4; Strong pollution, 4≤Igeo<5; and Extreme pollution, 5≤Igeo<6.
The Contamination Factor (CFi) is used to assess the pollution level of heavy metals by comparing the measured heavy metal content with a reference value (such as background or standard values). Its calculation formula is as follows:
CFi represents the ratio between the measured concentration and the reference value, and the result can be used to evaluate the degree of contamination of the heavy metal in the soil. Ci represents the measured concentration of a certain heavy metal in the soil (mg/ kg). C0 is the reference value for the heavy metal, which can be the soil background value, soil environmental quality standard value, or other standard values (mg/ kg). This paper adopts the research method of soil background value published by Guangxi Institute of Environmental Protection Science in 1992 and the soil background value of Guangxi. According to the degree of pollution, CFi is divided into 1-4 levels: No pollution, CFi≤1; Light pollution, 1<CFi≤2; Moderate pollution, 2<CFi≤3; and High pollution, CFi >3.
The pollution load index is calculated by comprehensively considering the pollution situation of various heavy metals and taking the weighted average of the single-factor pollution index for all heavy metals [27]. The calculation formula is:
PLI is the pollution load index; n represents the number of heavy metal elements participating in the assessment. According to the degree of pollution, PLI is divided into 1-4 levels: No pollution, PLI≤1; Light pollution, 1< PLI≤2; Moderate pollution, 2< PLI≤3; and High pollution, PLI >3.
Results
Physical and Chemical Properties of Soil on both Sides of the Expressway
The key findings of the physical and chemical properties of farmland soil on both sides of the Hezhou-Bama Expressway (Laibin to Du'an section) NO. 2 section YK296+300~YK296+580, as summarized in Table 1, hold significant implications for our understanding of soil dynamics. The soil temperature at the sampling points ranged from 29.5℃ to 32.1℃, with an average of 31.1℃. The soil water content at the sampling points ranged from 9.6 to 20.9%, with an average value of 14.8%. The soil pH values at the sampling sites ranged from 5.54 to 7.93, with an average of 6.54. The soil conductivity at the sampling points varied from 58 to 94 ms/m, averaging 77 ms/m. The average cation exchange capacity (CEC) of the sampling points was 6.6 cmol/kg, and the coefficient of variation on both sides was 10.36 and 2.62, indicating relatively small variation.
Distribution Characteristics of Heavy Metal Content in Soil on both Sides of the Expressway
The average soil content values for the QTC series samples on the east side of the highway are as follows: Cu (ppm) is 20.2, Pb (ppm) is 26.4, Zn (ppm) is 52.9, Cd (ppm) is 0.66, As (ppm) is 26.1, Hg (ppm) is 0.23, and Mn (ppm) is 550, respectively. The average soil content values for the BP series samples on the east side of the highway are as follows: Cu (ppm) is 12.1, Pb (ppm) is 19.7, Zn (ppm) is 39.7, Cd (ppm) is 0.23, As (ppm) is 25.2, Hg (ppm) is 0.22, and Mn (ppm) is 162, respectively (as shown in Table 2). The coefficient of variation of different heavy metal elements in QTC series samples ranged from 0.05 to 0.16, indicating mild variation [28]. The variation coefficients of different heavy metals in BP series samples ranged from 0.09 to 0.38, among which Cd and Mn had moderate intensity variation levels, and the other heavy metals had mild variation levels. The results show that different heavy metals are enriched to a certain extent on the east side of the expressway. The concentration of Cd and Mn is relatively large on the west side of the expressway. According to the screening value of the second type of land in China's Soil Pollution Risk Control Standard for Soil Environmental Quality Construction Land (GB3660-2018), the content of heavy metals was monitored without exceeding the standard.
Table 1.
Soil physical and chemical properties of each soil sampling point.
Soil δ13C, δ15N, and Content Changes
on both Sides of the Expressway
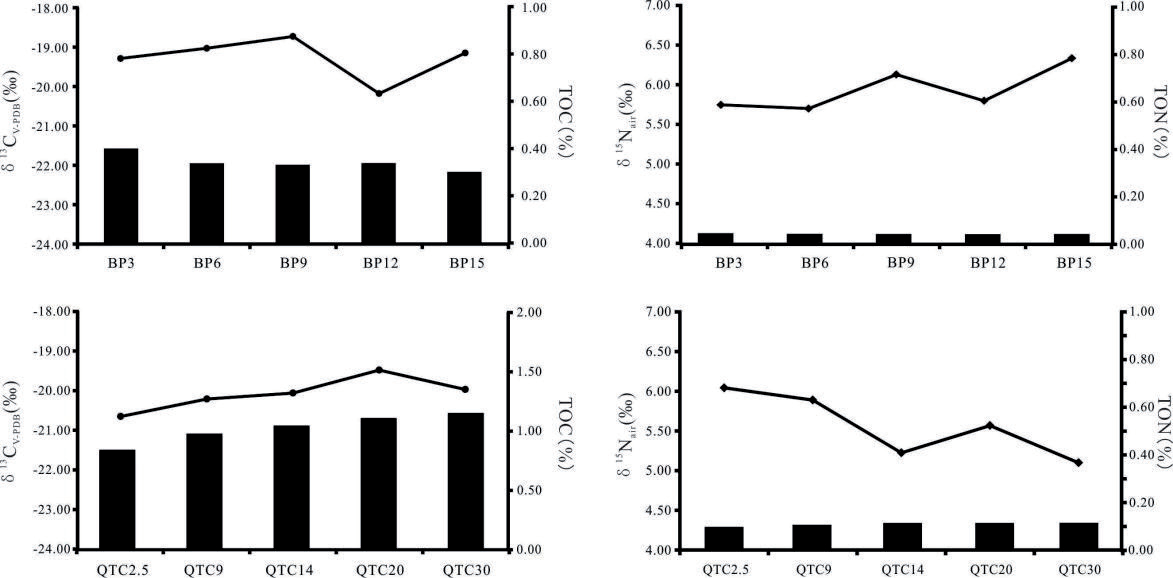
Fig. 2 showcases the novel variation range of soil organic carbon content and soil organic nitrogen content of the QTC system on the east side of the expressway, which is 0.84-1.15% and 0.09-0.11%. The change in soil organic carbon content of the BP series in the west was 0.30-0.40%, and the change in soil organic nitrogen content was 0.04%. These novel findings reveal that the soil organic carbon and organic nitrogen contents on the east side of the expressway were higher than those on the west side, mainly due to the apparent differences in vegetation cover types on both sides (as shown in Fig. 1). The QTC vegetation cover type on the east side of the highway is mainly shrub, while the BP vegetation cover type on the west side is primarily grassland. The distribution of soil organic carbon δ13C of the QTC system on the east side of the expressway ranges from -19.48 ‰ to -20.65 ‰, showing a trend of gradually accumulating 12C. The distribution of soil organic carbon δ13C in the BP system on the east side of the expressway ranges from -19.42 ‰ to -20.18 ‰ and does not show a significant change trend in general. The distribution of soil organic carbon δ15N in the QTC system ranges from 5.10 ‰ to 6.04 ‰, generally showing a gradual decrease with the distance increase. The distribution of soil organic carbon δ15N in the BP system on the east side of the expressway ranges from 5.75 ‰ to 6.33 ‰, generally showing a gradual increase with the distance increase.
Discussion
Pavement Runoff is the Main Mode of Heavy Metal Migration
The distribution and characteristics of heavy metals in soil on both sides of the Laibin to Du'an section of the Hezhou-Bama Expressway were studied. From the distribution pattern of heavy metals, except Mn, the highest values of BP were distributed in the middle 9 m. Except for As and Zn, QTC points showed a decreasing trend with the increase in distance (Table 2), and the lowest values were distributed at the edge of 30 m. Since the expressway from Hezhou to Bama had just been built and was not open to traffic when the expressway was sampled, the diversification and complexity of heavy metal content in the study area were mainly affected by traffic conditions, environmental factors, and soil properties during construction [29]. First of all, the soil at the BP and QTC sampling points is artificially filled in-situ soil in the later period, and it can be considered that there is little difference in heavy metal content after sufficient mixing. Then, the heavy metal in the soil on both sides of the two expressways is higher than the background value, mainly because during the construction of the expressway project, the size and diffusion mode of the dust, colloids, and powder particles generated by the excavation, filling, and engineering waste-stacking of the planned land are related [30]. The environmental factors affecting the distribution of heavy metals in soil are terrain, precipitation, and land use type. Due to the abundant atmospheric precipitation in Guangxi, the average annual rainfall is 1900 mm, and 70% is mainly distributed in the summer. Therefore, the precipitation on the highway pavement makes it easy to travel the surface runoff, so the heavy metal particles on the pavement are transported by the precipitation to both sides of the highway and then deposited. The left side of the BP point is the highway, and the right side is the slope. During rainfall, the road runoff on the left side and the slope flow on the right side converge simultaneously, resulting in the highest heavy metal content in the middle. However, during the rainfall of the QTC point, only the lateral recharge of road surface runoff is accepted, so the farther away from the road, the less heavy metal accumulation. Therefore, road runoff is the primary mode of heavy metal migration. The accumulation index method evaluated the study area's soil heavy metal pollution degree.
The Igeo of Cu, Pb, and Zn elements in the soil on the east and west sides of the expressway was <0, indicating no pollution. As Hg elements, Igeo<1, for light pollution. Among them, the Cd element Igeo<1 of the BP series is slightly polluted. The Igeo value of the Cd element of the QTC series varies from 1.3 to 2.3, which reaches medium-intensity pollution. It's crucial to note that since the expressway was not open to traffic at the time of sampling, automobile exhaust emissions during construction, friction of automobile axle bearings, brake lining surface, tire wear, anti-rust film on automobiles, wear of anti-rust pigments, etc., which are the primary pollution sources of heavy metals in soil, will increase the content in soil on both sides [31, 32]. This potential impact of expressway operation on the environment underscores the need for careful planning and monitoring of the construction and operation phases.
The CF of soil heavy metals at various sampling points on the east and west sides of the highway and the PLI were translated, and a pollution assessment was conducted based on the grading standards. The evaluation results indicate that the average CF values of Cu, Pb, Zn, Cd, Mn, As, and Hg in the BP series, from high to low, are: Mn (0.34), Cu (0.64), Zn (0.71), Pb (1.12), Hg (1.99), As (2.24), and Cd (2.27); the average single pollution index values of Cu, Pb, Zn, Cd, Mn, As, and Hg in the QTC series, from high to low, are: Zn (0.94), Cu (1.07), Mn (1.16), Pb (1.50), Hg (2.08), As (2.32), and Cd (6.50). In the BP series, Cd and As are classified as moderate pollution, Pb and Hg as light pollution, and Cu, Zn, and Mn as no pollution; in the QTC series, Cd is classified as high pollution, Hg and As as moderate pollution, Cu, Pb, and Mn as light pollution, and Zn as no pollution. The single-factor pollution index is a simple and intuitive evaluation method. Still, it only considers the pollution situation of a single heavy metal and does not consider the comprehensive impact of multiple heavy metals. Therefore, combining other indicators to comprehensively assess soil pollution status is usually necessary for practical applications. The PLI value of the BP series ranges between 1.36 and 1.40, with an average value of 1.37, showing light pollution, and the maximum PLI value indicates a light pollution level. The PLI value of the QTC series ranges between 1.41 and 1.53, with an average value of 1.47, showing light pollution, and the maximum PLI value indicates a light pollution level.
On the other hand, the study found that the high Cd content of limestone soils in karst areas may be due to the characteristics of the high Cd content of carbonate rocks [33]. Although the total amount of Cd is high, the available state is low, and the harm to vegetation is minor. The study also found that the excess rate of Cd in vegetation in the karst area is lower than in the non-karst area [34]. Therefore, the study suggests that with the increase in expressway operation time, a specific isolation belt between the highway and the agricultural planting area in the study area should be considered, and the planting area and plant types should be scientifically planned. Related research suggests that soil geochemical processes play a significant role in influencing the elements Cu and Mn in the soil [35]. These processes, mainly of geological origin, are crucial in understanding the distribution of these elements in the study area's soil. The Cu and Mn in the soil are, to a large extent, controlled by these soil geochemical processes and the soil's parent material. Additionally, the heavy metals Pb and Zn in the soil on both sides of the road are likely derived from the combustion of car tires and leaded gasoline during construction, and some are deposited in the soil on both sides of the road through airborne dispersion or via dry and wet deposition [36]. Furthermore, it reflects that elements such as As, Pb, Cd, and Zn in the agricultural soil of the study area are mainly influenced by human activities. The sources of heavy metal elements in the soil include farming, industrial, transportation, and soil geochemical sources.
Table 2.
Whole-state content characteristics of heavy metals in soil.
Highway Construction Leads to Soil Organic Carbon and Nitrogen Loss on both Sides
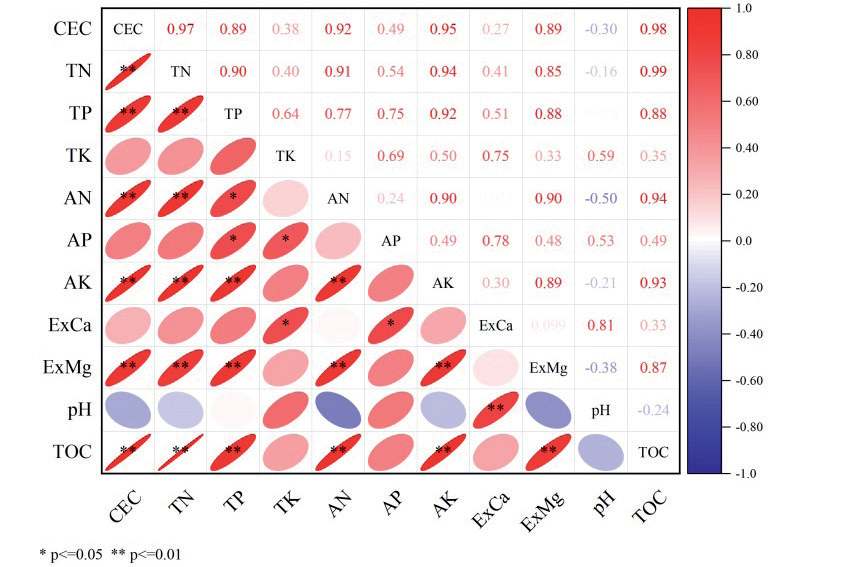
During the construction of high-speed kilometers, the soil in the study area is significantly disturbed, and the original soil structure is destroyed so that the topsoil rich in organic matter is stripped or buried. As a result, the soil organic carbon content on both sides is significantly lower than the national average value of dryland in the second soil census due to the influence of human activities, such as highway construction [37]. It can be seen that expressway construction affects the fixation and accumulation of soil organic carbon and organic nitrogen and the spatial distribution of soil nutrients. The organic nitrogen content is also lower than that of shrubs and grasslands in karst areas, which is not conducive to the accumulation of soil organic carbon and organic nitrogen [38]. When the available nutrients in the soil decrease, the net primary productivity in the soil ecosystem will be limited to some extent [39]; among them, CEC can be used as an index to evaluate the soil fertility holding capacity and is also an essential factor affecting the soil environmental capacity and the migration and transformation of pollutants. The size of CEC is directly affected by solid phase composition, such as the specific surface area of soil colloid and surface negative charge density [40]. Organic matter, as the main component of the soil solid phase, is the main influencing factor of CEC. Soil organic carbon content and total nitrogen content in the study area showed a very significant positive correlation with CEC (Fig. 3), indicating that organic matter is the main influencing factor of CEC. At the same time, the low content of organic matter is also an essential reason for the low content of soil organic carbon and organic nitrogen in the study area. Therefore, when planting plants to control heavy metal migration on expressways, the improvement of soil properties in the study area should also be considered due to the apparent reduction of soil organic matter and soil nitrogen content.
The construction of expressways plays a significant role in the disruption of soil and vegetation. The δ13C value, which effectively indicates the source of soil organic carbon [41, 42], is about -19.6 ‰, suggesting that it is mainly C4 plants. However, the highway construction destroys the original soil cover vegetation, and the soil is also seriously disturbed. The δ13C characteristics were more inherited from the original organic carbon of the soil in the construction transport area rather than the isotope characteristics of existing plants. Due to the reduction of soil organic matter and nutrients caused by construction, the microbial biomass of 12C-enriched soil decreased [43, 44], and the δ13C in soil as a whole showed a bias. The construction of the expressway led to a reverse succession of vegetation community types on the surface, and its structure and function gradually degraded, vegetation coverage decreased, bedrock was exposed, and soil water content decreased. As a result, the soil's fixed nitrogen enriched with 14N decreases. In contrast, the ammonia volatilization enriched with 15N is exacerbated by increased precipitation, which results in the overall positive δ15N in the soil [45]. The type of vegetation is an essential factor affecting the nitrogen isotope composition of surface soil [44], which leads to specific differences in soil nitrogen isotope composition on both sides of the expressway.
As the highway operation time increases, the pollution potential of soil heavy metals on both sides of the highway will continue to rise. The heavy metal pollution range of soil on both sides of the expressway can be effectively reduced through shelterbelts and vegetation belts. Given the neutral and acidic environmental characteristics of highway lithologic soil, heavy metals are easily dissolved and precipitated, which can affect soil nutrient forms and planting crops [45]. Therefore, in the process of soil restoration around expressways and prevention of heavy metal pollution, it is crucial to effectively improve the content and availability of carbon and nitrogen in the soil. This is necessary to ensure the survival rate of plants in the green belt of expressways, thereby influencing the restoration of soil ecological functions and the sustainability of regional environmental restoration.
Conclusions
Soil physical and chemical properties, distribution of heavy metals, and carbon and nitrogen isotopes on both sides of the Hezhou-Bama Expressway (Laibin to Du'an section) were studied. After the land around the expressway is used as temporary land for the construction of the expressway project, the land use mode is wholly changed, and the construction activities affect not only the structure and level of the original soil but also the physical and chemical properties of the original soil. The organic matter content and the mass fraction of available nutrients in the soil decreased rapidly, and the fertility decreased, which led to the decline of soil quality. The content of heavy metals in soil on both sides of the expressway is based on the screening value of the second type of land in the soil pollution risk control standard of soil environmental quality construction land (GB3660-2018), and the content of heavy metals monitored does not exceed the standard. However, when the soil accumulation index method was used to evaluate the heavy metal pollution of tea garden soil, the pollution degree of the Cd element was significantly higher than that of other elements, showing the risk of medium-intensity pollution. Therefore, according to this characteristic, selecting hyper-enriched Cd plants to repair heavy metal-polluted soil is necessary. At the same time, the soil's physical structure should be reconstructed to promote the damaged soil's comprehensive fertility and ensure the ecosystem's stability.

