

Introduction
Since China practiced a rapid and extensive economic growth model, which induced heavy consumption of resources and excessive pollutant emissions, a conflict proliferated between economic growth and eco-containment [1-4]. Since 2012, the Chinese government has placed greater emphasis on ecological civilization construction to ensure sustainable development by minimizing resource consumption. In August 2013, the Chinese government proposed to set up 100 national ecological civilization demonstration areas (ECDA) nationwide to explore a model of ecological civilization construction with Chinese characteristics [5-8]. Ecological civilization demonstration areas were formally activated nationwide in 2014, with a national early construction program. This program mandates the selected areas to actively investigate workable and duplicable ecological civilization systems in light of local circumstances, thereby contributing to developing a beautiful and prosperous China in a way that guarantees a reliable system [9]. At the same time, a corresponding target system for constructing the ecological civilization demonstration areas is developed following the program, with detailed provisions, in particular, toward economic growth in terms of quality and efficiency in the use of resources and energy [10, 11].
Hence, ecological civilization demonstration areas aim to restructure irrational current industrial settings, mandate greener production patterns, and optimize the environmental governance system across regions by introducing greater eco-efficiency [12, 13]. Between 2014 and 2015, 47 prefecture-level cities were identified as early ecological civilization demonstration areas, of which 19 resource-based cities were selected in two batches for the demonstration construction list [11].
Eco-efficiency is “the unification of economic and environmental benefits, the pursuit of maximum economic efficiency with less energy, raw materials, and ecological inputs” [14, 15]. Additionally, eco-efficiency belongs to an ecological-socio-economic complex system that maximizes economic benefits and minimizes ecological damage through the effective allocation of economic, natural, and ecological factors to achieve green development of the system. To some extent, the strategic objective of ecological civilization demonstration areas is to practice greener productive patterns and organize better environmental governance structures for each region, aligning precisely with the principles of eco-efficiency. In evaluating and measuring eco-efficiency, the carbon footprint and ecological footprint methods were primarily used in the early days [16-18]. However, in recent years, researchers have predominantly employed the DEA model, life cycle assessment method, three-stage DEA, SBM model, and EBM model to assess eco-efficiency [19-23].
Ecological civilization demonstration areas are quintessentially the government’s environmental policy tool and significant political explorations to advance ecological civilization construction [11]. As such, as an advanced policy tool, some scholars have affirmed the “industrial productivity enhancement” impact of ecological civilization demonstration areas policy [24- 26], but scholars are less aware of its impact on “green development”. For example, scholars have observed that green policies and environmental regulatory policies can significantly contribute to eco-efficiency in China [27, 28], implying that ecological civilization demonstration areas, as a prototypical environmental policy, can likely introduce novel avenues for enhancing eco-efficiency. Nevertheless, very few studies have directly demonstrated how ecological civilization demonstration areas and eco-efficiency in Chinese resource-based cities are associated. Therefore, this study aims to fill that gap by exploring the relationship between the two.
Environmental policies significantly impinge on green development shocks. A growing number of investigations have been initiated to emphasize the nexus between eco-efficiency and relevant environmental policies. Eco-efficiency is subject to various factors such as technological progress, industrial structure, and economic growth [7, 29, 30]. Some scholars debate that environmental regulation directly impinges on eco-efficiency by multiplying binding firm productivity and thus eco-efficiency [31-33]. Yet, other scholars share a divergent view, suggesting that environmental policies contribute to eco-efficiency not by boosting environmental technology innovation and industrial restructuring, but by impairing eco-efficiency gains [34]. Finally, a linear link between the two might not yield robust results, as scholars suggest that the link between environmental regulation and eco-efficiency is nonlinear [19, 35-37]. Ecological civilization demonstration areas have combined policy attributes of green development and environmental regulation, which may introduce novel search thinking for enhancing eco-efficiency.
The concept of a resource-based city denotes an urban center whose economic development is heavily contingent upon the exploitation and harnessing of specific local resources [38]. These cities are distinguished by the preponderance of resource-intensive industries within their economic frameworks [13, 39, 40]. Over the past several decades, resource-based cities have played a pivotal role in propelling China’s overall economic expansion. However, the excessive reliance on resources and their inefficient utilization have precipitated a multitude of consequences, encompassing unsustainable development paradigms, unbalanced industrial growth, and environmental deterioration. It is noteworthy that a substantial proportion of resource-based cities are mining cities [41, 42]. Throughout the operational lifespan of a mine, the city’s economic activities and population can undergo fluctuations contingent upon mineral prices, experiencing periods of prosperity subsequently followed by potential decline. Once resource extraction attains its terminus, the city may ultimately confront abandonment. In the global context, there are numerous resource cities that are presently categorized as “shrinking cities” due to their substantial population declines [43, 44].
Resource-based cities, constituting a unique category of urban development reliant on the exploitation of natural resources for their emergence and growth, have garnered significant academic attention due to their distinctive development trajectories, economic characteristics, social structures, and transformation challenges [45]. Chinese resource-based cities, in particular, have persistently contributed to the rapid expansion of industrialization [46]. Nonetheless, there exists a heightened urgency to construct eco-civilization within these cities, as energy consumption and pollution emissions associated with resource mining and processing have precipitated substantial ecological and environmental issues [47]. The eco-efficiency of resource-based cities is intricately linked to compatible growth and environmental conservation in China [48-50]. Recognizing this interdependence, the Chinese government has placed considerable emphasis on industrial transformation and green development, formulating numerous measures to address the aforementioned challenges. Additionally, several policies pertaining to resource-based cities emphasize the necessity of enhancing their sustainable development capacity [51-53]. Consequently, the pursuit of solutions to fortify the eco-efficiency of resource-based cities is of paramount and immediate importance.
Prior investigations have laid a solid foundation for a deeper evaluation of the impact of ecological civilization demonstration areas on eco-efficiency. However, the research objectives and analytical framework examining the relationship between the two still require additional refinement and extension. The extant literature primarily emphasizes the construction of the appraisal index system for ecological civilization demonstration areas and its practical significance, while relatively few studies address the impact of these areas on the eco-efficiency of resource-based cities. Furthermore, very few studies have applied the Difference-in-Differences model to evaluate policy effects. Lastly, the current literature primarily considers policy as one of the influential forces on eco-efficiency and seldom discusses its underlying mechanism.
In this context, can the policy effects of ecological civilization demonstration areas enhance the eco-efficiency of resource-based cities? If so, how do ecological civilization demonstration areas affect the eco-efficiency of resource-based cities through any underlying mechanism, and how does the impact of ecological civilization demonstration areas vary across different local conditions (such as city type and location)? Answering these questions will support decision-makers in fully leveraging the policy effects of ecological civilization demonstration areas, optimizing the industrial structure rationally, and fostering harmonious economic growth and ecological protection by providing marginal empirical support. Therefore, this study conducts an extensive empirical examination of the policy effects of ecological civilization demonstration areas in an attempt to clarify the underlying mechanism of their impact on eco-efficiency. It is possible to estimate the positive impact of ecological civilization demonstration areas on eco-efficiency, which can not only interpret the implementation effects of Chinese environmental policies but also provide further empirical evidence for the replication of ecological civilization demonstration area policies. Additionally, this study offers a useful factual basis and reference path for other national governments to devise relevant environmental policies.
This research contributes to the existing literature in three ways. First, we empirically examine the impact of ecological civilization demonstration areas on eco-efficiency by constructing a multi-period DID model. Second, when measuring eco-efficiency with the super-efficiency EBM model, we take into account the desirable output, tax revenue, and green areas of resource-based cities. Third, we discuss the heterogeneous effects of ecological civilization demonstration areas on eco-efficiency across different geographical locations and city types.
Theoretical Analysis and Research Hypothesis
Resource-based cities, which played a pivotal role in constructing the integrated industrialization system and rapidly fueled GDP growth during China’s early developmental phases, are prone to encountering inadequate momentum for further expansion due to their strong reliance on resources, monomorphic industrial structure, and unsustainable production model [54]. From the perspective of construction objectives, the establishment of ecological civilization demonstration areas encompasses five primary aspects: fostering high-quality development, enhancing eco-efficiency, nurturing ecological culture, and fortifying institutional mechanisms [11]. Consequently, these demonstration areas must strike a balance between economic development, resource consumption, and environmental protection in accordance with their designated roles.
The creation of an ecological civilization demonstration areas regime necessitates the integration of depleted resources, natural disasters, and ecological performance into the evaluation system of economic development. The policy of “ecological civilization demonstration areas”, akin to government-imposed environmental regulations, aims to enhance eco-efficiency. This is primarily manifested in two dimensions: augmenting economic efficiency output and mitigating ecological and environmental costs. From the vantage point of increasing economic output, ecological civilization demonstration areas can propel economic growth by stimulating overall labor productivity. Secondly, this policy can enhance eco-efficiency by reducing ecological and environmental costs. Environmental regulation, as a form of government initiative, effectively mitigates the adverse externalities of pollution in production and domestic processes through policy establishment. The mandatory nature of the ecological civilization demonstration areas policy influences decisions regarding ecological and environmental input. To ensure economic benefits, pertinent economic agents tend to curtail environmental costs [11, 29]. Accordingly, this paper proposes the following hypotheses:
H1: The ecological civilization demonstration areas may help improve resource cities’ eco-efficiency.
The target system of the ecological civilization demonstration areas furnishes a comprehensive framework of regulations pertaining to the quality of economic growth and the conservation of resources and energy. Its effect on enhancing eco-efficiency is analogous to that of formal environmental regulations instituted by the government. When such environmental policies intervene in regional development, the high dependence on resources that is characteristic of these regions is gradually reversed, providing an impetus for the development of resource-based cities by fostering relevant alternative industries and improving eco-efficiency, which becomes increasingly prominent over time [52, 53].
Furthermore, the ecological civilization demonstration areas expedite the transformation of production modes from the traditional, sloppy type to the environmentally protective and green type, driving industrial upgrading from traditional industries to green industries. The technology-intensive industries with low consumption and high output, which are generated through the cultivation of alternative industries, will gradually replace pollution-intensive industries and reduce resource consumption, thereby enhancing ecological benefits [54]. Engaging in successive substitute industries stimulates the diversification of the industrial structure and decreases adverse environmental impacts stemming from production activities, all of which contribute to the improvement of eco-efficiency [51, 54, 55]. This multifaceted approach not only fosters sustainable economic growth but also promotes environmental preservation, making it a viable strategy for achieving long-term ecological and economic goals.
H2: Mitigating resource dependence is an eco-efficiency mechanism for ecological civilization demonstration areas.
H3: The ecological civilization demonstration areas policy boosts eco-efficiency by promoting upgrading industrial structures.
Based on the above analysis, we drew a mechanism diagram between the hypotheses, as shown in Fig. 1:
Research Design
Econometric Methodology
In 2014, China formally started the construction of ecological civilization demonstration areas nationwide, and the lists of demonstration area construction were determined in 2014 and 2015. There are 19 resource-based cities that have been selected as ecological civilization demonstration areas. Policy shocks (policy effects) are defined as the impact of ecological civilization demonstration areas on eco-efficiency.
The difference-in-differences (DID) technique is employed to estimate such policy effects [17, 56, 57]. The dummy variable for the year in which each resource-based city is actually selected as an ECD is adopted as the core explanatory variable. Eq. (1) is set up as follows.
Among them, i and t signify city and year, respectively. y is eco-efficiency. DID signifies whether resource-based cities are selected as the ecological civilization demonstration areas or not. X designates a set of control variables. βis the estimation parameter. μ and ω denote city and year fixed effect. ε is the error term.
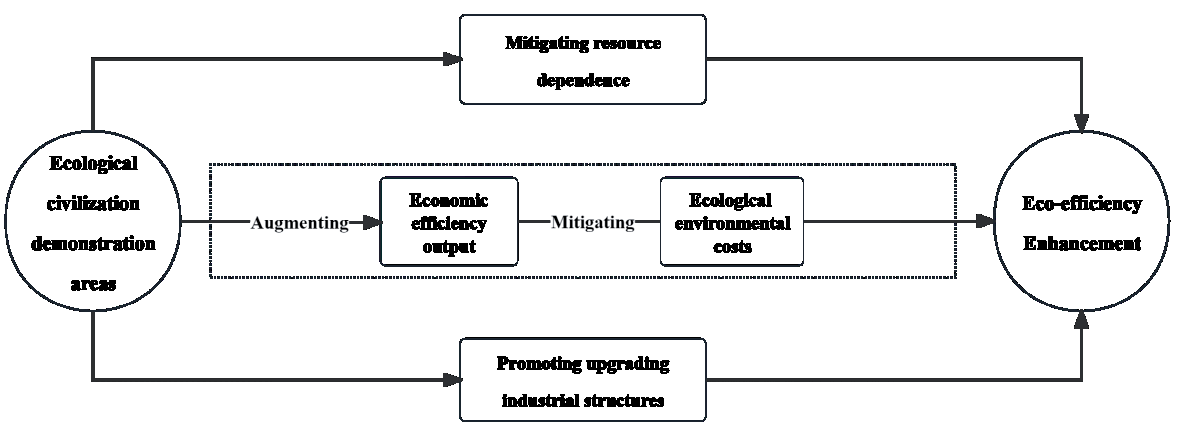
Table 1.
Input-output indicator definitions.
Variable Selection
Explained variable:
Eco-efficiency is a complex unity of resources and ecology, and its essential requirement is to obtain the maximum economic benefits [58, 59]. The input indicators in existing eco-efficiency studies are primarily selected from land, capital, energy, and labor, while the output indicators are generally divided into desired and undesired outputs. Desired output is mostly economic output, typically measured by gross regional product, while undesired output primarily refers to environmental pollutants. However, the above indicators are primarily used in provincial studies, and municipal statistics, especially energy data, are difficult to obtain, making empirical studies on municipal units’ eco-efficiency generally scarce. Therefore, data accessibility in selecting indicators, an evaluation system of eco-efficiency of municipal units was constructed, and construction land, year-end population, and energy consumption were selected as input indicators (see Table 1).
Input factors:
(1) Natural resource factors: Following Li et al. (2021), the area of urban construction land is selected for measurement [51].
(2) Energy factors: Many studies have shown that light brightness is linearly correlated with electric energy consumption, and the lights detected by DMSP/ OLS not only come from lights generated by electric power consumption but also include lights generated by some other energy consumption, such as car lights generated by cars through oil consumption, so the DMSP/OLS nighttime light data is fitted as an energy consumption indicator [54].
(3) Social and economic factors:
The number of employees of urban entities is elected as labor input. Fixed capital stock is considered as capital input. Capital stock is evaluated using the perpetual inventory method [30, 60]. The specific form is as follows:
Kit denotes the current fixed capital stock. Iit denotes capital investment in the current period. δit defines the fixed asset depreciation rate (set to 9.6%). The permanent inventory processing of fixed assets investment is performed considering 2006 as the base period, following which annual fixed capital stock data is obtained.
Output factors:
(1) Desired output is defined as GDP, tax revenue, and green space of the prefecture-level city.
(2) Undesired output is calculated by industrial smoke (dust) emissions, industrial wastewater emissions, and industrial sulfur dioxide emissions.
The stochastic frontier approach (SFA) and data envelopment approach (DEA) are comparatively usual in calculating eco-efficiency [32, 33]. Among them, DEA does not require an initial hypothesis on associations between the variables and has significant benefits in gauging a decision unit’s efficiency with multiple inputs and outputs. DEA is classified into CCR/ BCC-DEA models for radial-based metrics and SBM-DEA models for non-radial-based metrics. It has been shown in the literature that both of these approaches have shortcomings, as the former assumes too stringent conditions that cause the input factors to be scaled down by the same proportion and thus deviate from reality, while the latter improves on the former but loses the original proportional information of the efficiency frontier projection values. A radial and non-radial EBM model was developed by Tone in 2010, allowing the maximization of the simulation of the input/output process of natural factors [61]. A concrete model is as follows:
(4)
Fig. 2.
The eco-efficiency of global and three major regions in the ecological civilization demonstration areas.
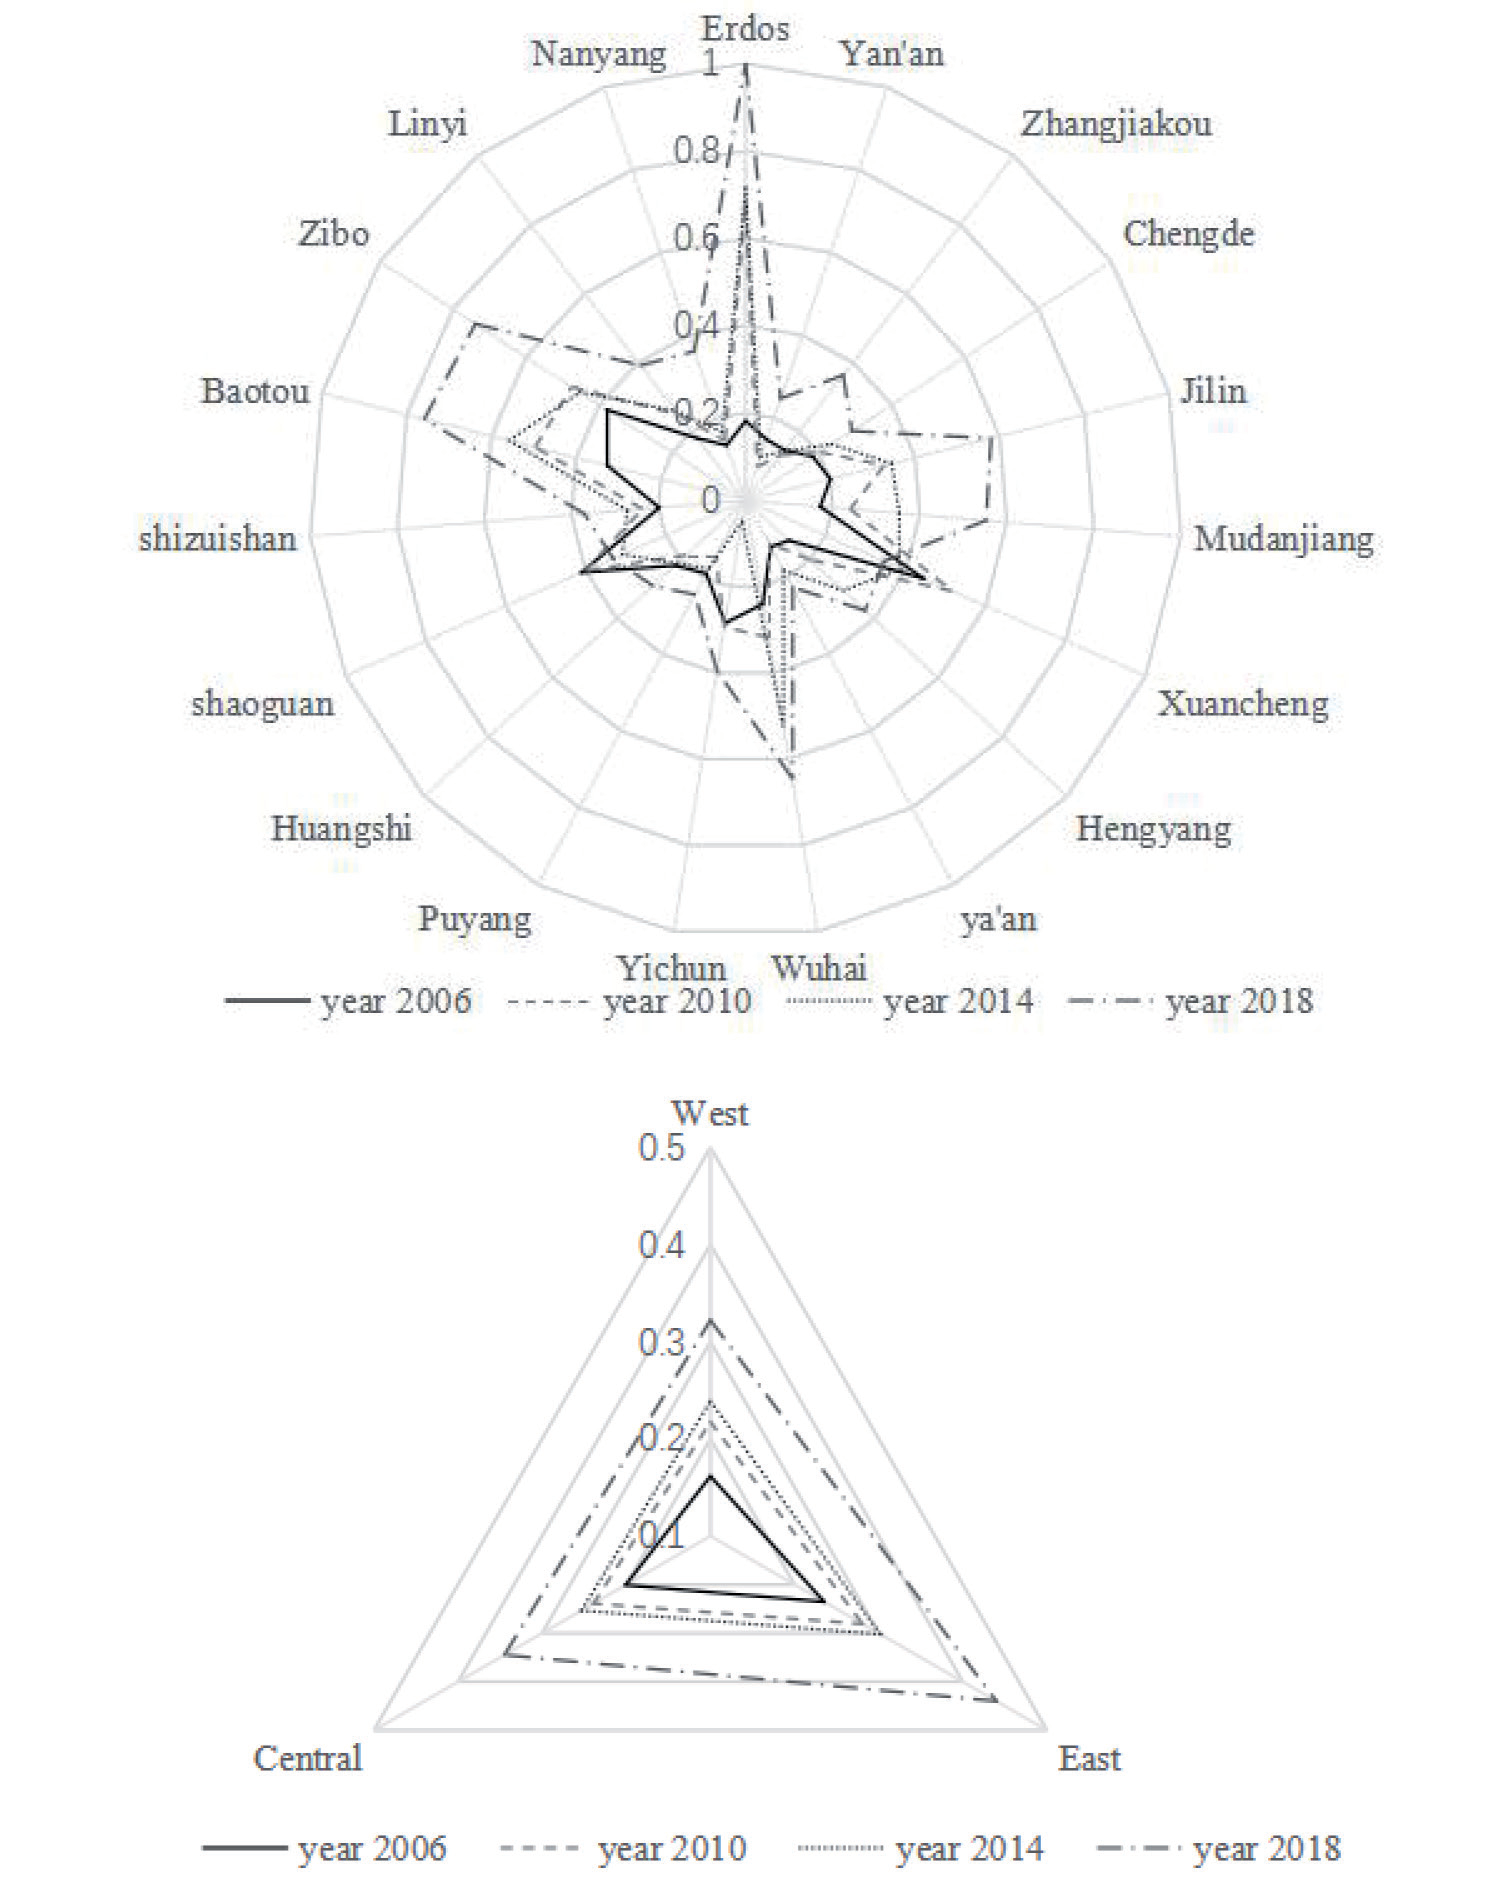
Where γ* is the optimal eco-efficiency value. θ is considered as the radial efficiency value. n, m, s, and q, respectively, denote DMUs numbers, input factor number, desirable output number, and undesirable output number. Sr+ and Sp−, respectively, represent desirable and undesirable output slack variables. wr+ and wp− represent the weight of desirable output and undesired output. Fig. 2 illustrates the eco-efficiency of the global and three major regions.
Control variables:
Concerning Liang et al. (2022), urban level, Openness, financial scale, technological progress, human capital, and economic development level are selected as the six control variables. Urban level (urb) is the share of the non-agricultural population in the total population [11].
Table 2.
Descriptive statistics.
Openness (open). The proportion of foreign direct investment in GDP is adopted to measure Openness [62- 65].
Financial scale (fin). Following Li et al. (2021), fiscal revenue as a share of GDP is quantified by introducing fiscal size [51].
Technological progress (tp). The share of science spending in government fiscal expenditures is adopted to measure technological progress [66].
Human capital (lnhum). Human capital is defined by the logarithm of the number of college students in each region [67]. As students in universities are the foremost innovators in cities, highly qualified individuals are more likely to master advanced technology and gain experience, which contributes to improvements in eco-efficiency [40, 68].
Economic development (lnrgdp). Following Chai et al. (2022), and Wang et al. (2021), the economic development level is calculated in terms of GDP per capita [41].
Mediation variables:
(1) Resource Dependence (res).
Resource industries occupy an important position in the development of resource cities. The high profitability and development advantages of the resource industry increase resource dependence, inhibiting the continuous increase of eco-efficiency. Drawing on Shao and Yang (2010), the share of mining employees in total employment is used as an indication of the city’s dependence on resources [69].
(2) Industrial structure upgrading (str).
Industrial structure upgrading refers to transforming industrial structure from the lower industries to the higher form of knowledge, technology, and digital-intensive industries [70]. The tertiary output to secondary output ratio is programmed to determine the degree of complexity of the industrial structure.
Data Sources and Descriptive Statistics
This article sets the research period of the time-varying DID method to 2006-2020. As for the study areas, 116 resource-based cities are selected as the survey sample. Moreover, Laiwu City was abolished and incorporated into Jinan City in 2019, which is, thus, also removed from the control group. Among it, the experimental group consists of Erdos, Yan’-an, Zhangjiakou, Chengde, Jilin, Zibo, Linyi, Mudanjiang, Xuancheng, Hengyang, Ya’an, Wuhai, Yichun, Puyang, Huangshi, Shaoguan, Shizuishan, Baotou, and Nanyang, whose intervention period of the ecological civilization demonstration areas policy is set to 2014 and 2015; the other 95 resource-based cities serve as the control group sample. Other data are from the China Urban Statistical Yearbook and EPS database (see Table 2).
Empirical Results Analysis
Parallel Trend Test
The parallel trend hypothesis is the basic criterion for DID implementation. Referring to Jacobson et al. (1993), the following model is constructed:
Where t0 represents the year when the district is selected for ecological civilization demonstration areas and k denotes the kth year when the district is selected for ecological civilization demonstration areas. δk signifies whether a significant disparity existed in the eco-efficiency of the treatment and control groups in the kth year after the district was selected for ecological civilization demonstration areas. The other parameters are equivalent to Eq. (1). Fig. 3 presents the parallel trend test results. The parallel trend hypothesis is fulfilled if the coefficient of ecological civilization demonstration areas on eco-efficiency gains does not pass the significance test before ecological civilization demonstration areas implementation, indicating that there is an insignificant difference between the treatment and control groups [71]. Fig. 3 reveals the trend of δk. Coefficients of pre2-pre4 are not significant prior to policy implementation.
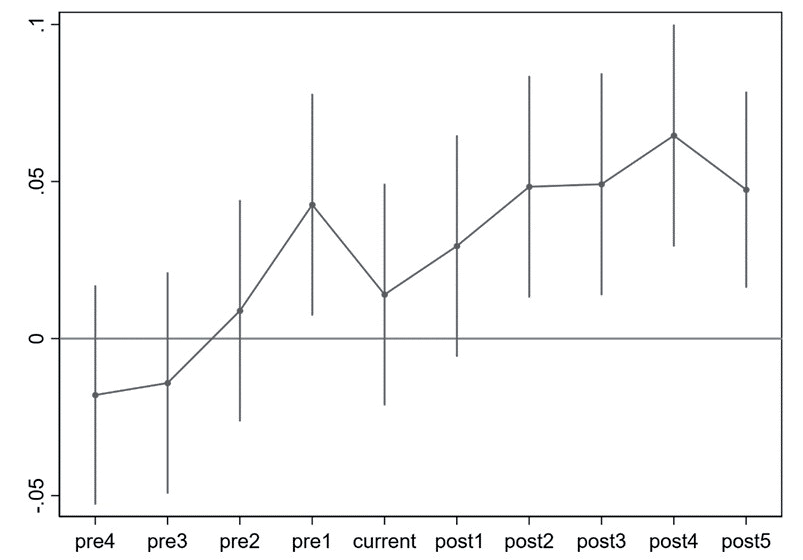
Fig. 3 shows that a shock to eco-efficiency by ecological civilization demonstration areas before the policy implementation does not satisfy the parallel trend hypothesis if it fails the significance level test, indicating that no significant difference is observed between the treatment group and the control group prior to the implementation of ecological civilization demonstration areas [71]. Fig. 3 captures the trend in δk. In the pre2-pre4 period before policy implementation, the regression coefficient is not significant. The estimated coefficients of pre1, current, and post1 mostly fluctuate around 0. Starting from post 2, the estimated coefficients increased significantly. Thus, ecological civilization demonstration areas boost eco-efficiency, and the parallel trend hypothesis is tested.
Benchmark Regression
Columns (1) and (3) of Table 3 report the result without time and city effects. Columns (3) and (4) of Table 3 are added with time effects and fixed effects, without control variables in columns (1) and (2). Table 3 reports the impact of the ecological civilization demonstration areas policy on eco-efficiency. Table 3 implies that ecological civilization demonstration areas can significantly drive eco-efficiency. Hypothesis 1 was confirmed.
Robustness Test
Robustness Test Based on PSM-DID
To ensure that the data are balanced between pilot resource cities and non-pilot resource cities, we addressed deficiencies in data randomization, minimized selection bias, and constructed a logit regression model (see equation (6)). Variables such as city level, openness, financial scale, technological progress, human capital, and level of economic development are utilized to match with pilot city.
Matching variables were tested to address common support hypotheses prior to applying the propensity score matching (PSM) method. Eq. (1) is estimated emphasizing the kernel matching method.
Table 4 shows that a significant reduction in the difference between the means of the treatment and control groups is observed after matching compared to the pre-matching period. Additionally, the standardized deviations of the variables are lower than 10% after matching, indicating that the matching results align with expectations. The reduced selection bias for the effect of the treatment group after PSM justifies the use of the PSM-DID method.
Fig. 4 confirms that a significant reduction in the dispersion of each variable after PSM indicates that the sample distribution is relatively centralized after PSM. Fig. 5 reveals that the matching of a large number of samples is successful, the matching effect is favorable, and the sample loss is small.
Simultaneously, the kernel matching method is employed to evaluate whether the effect of ecological civilization demonstration areas policy on increasing urban eco-efficiency is robust or not, and the matching effect of the treatment-control group is examined by plotting the kernel density function (see Fig. 6). Fig. 6 reveals that, after matching, the probability densities of the propensity scores for the treatment group and the control group are very similar, indicating that the matching in this paper is effective. As a result, PSM-DID’s rationality is further proved.
Randomly Generated Treatment Group
To further detect whether the impact of ecological civilization demonstration areas on eco-efficiency is interfered with by some unknown factors, referring to Liu and Lu (2015), the treatment group is randomly sampled from the full sample to conduct the robustness test [72]. Since the randomly selected treatment group is a “pseudo-treatment set” that does not perform ecological civilization demonstration areas, the interaction term generated by the robustness test should not significantly affect eco-efficiency. To obviate possible errors caused by low probability events, we repeated the random sampling and regression analysis 500 times (see Fig. 7). Fig. 7 reveals that the mean values of the coefficients of the interaction terms of the sampling regressions are close to 0, and the p-values of the majority of the sampling regressions are greater than 0.1, indicating that no significant bias is found in the estimation results. Simultaneously, the estimated coefficient for the actual policy is 0.0391, significantly different from the placebo trial results. Thus, it is possible to rule out other unobservable factors that improve eco-efficiency.
Table 3.
Benchmark regression results.
Table 4.
Applicability test of PSM-DID method.
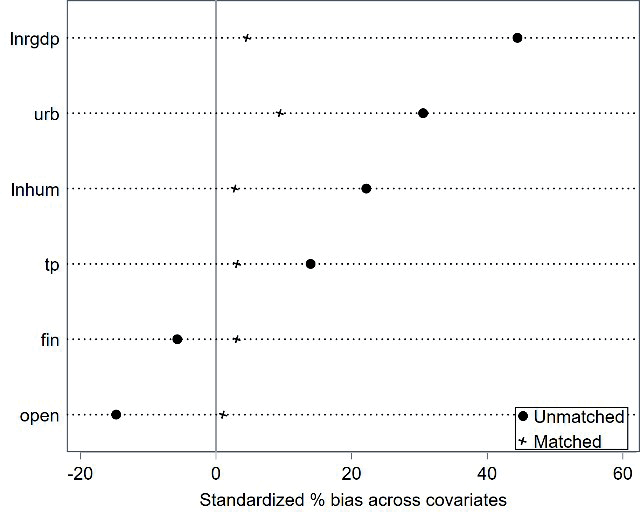
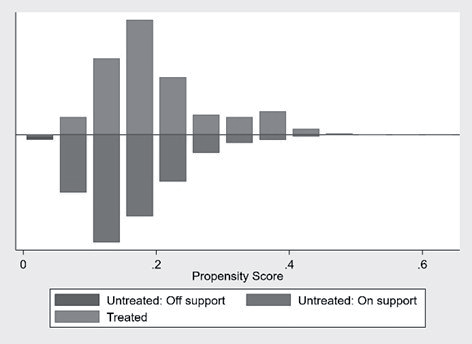
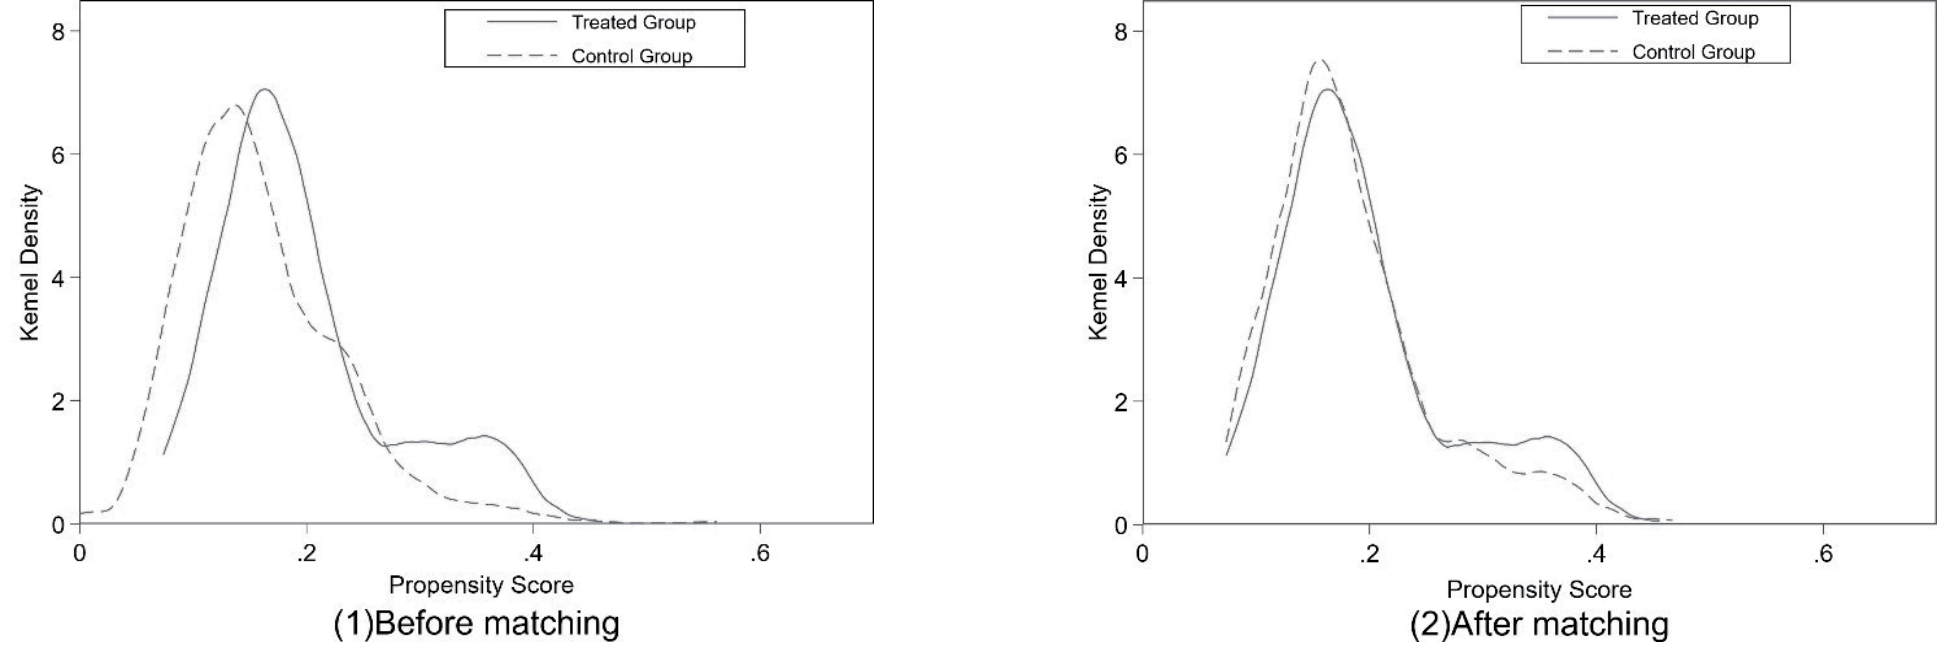
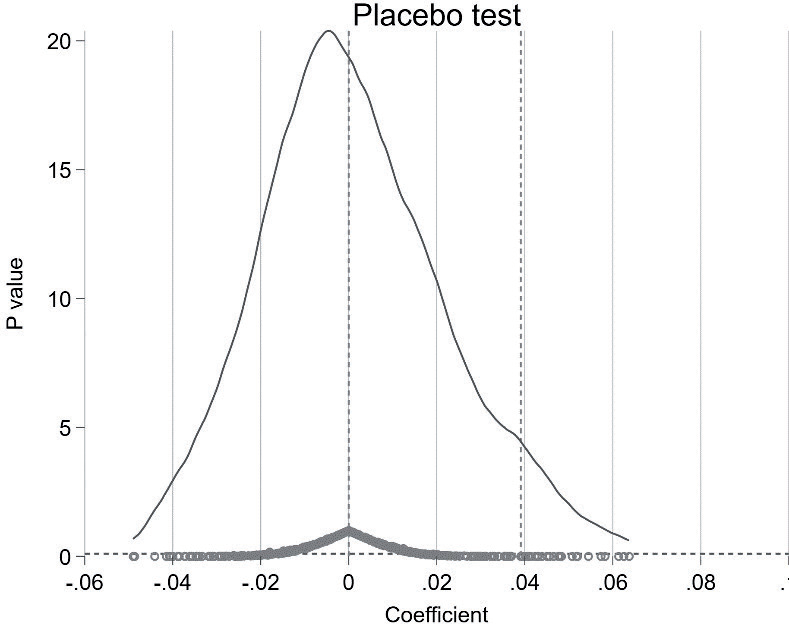
Table 5.
Robustness check results.
Analysis of Robustness Check
We continue the robustness discussion in the following way. Initially, the sample period is changed. The total sample of 2006-2020 is analyzed, but ecological civilization demonstration areas occurred in 2014 and 2015, and the sample may have too many periods before implementation. To avoid shocks from other related policies, 2011-2018 is selected as the sample period, i.e., three years before and three years after the policy, to perform the robustness test (see column (1) of Table 5. To exclude the effect of extreme values, we scale down the value of eco-efficiency to 1% (see column (2) of Table 5). Table 5 reveals that the coefficients of did are similar to the above results, providing further support for robustness.
In addition, in order to exclude the impact of other policies on eco-efficiency during the same period, and to test whether the establishment of the ecological civilization demonstration areas in the benchmark regression has a net effect on eco-efficiency, this paper selects environmental regulation policies similar to the “ecological civilization demonstration areas” policy, such as the “low carbon cities” policy (PLC) and the “civilized cities” policy (PCC), to be included in the regression. The results are shown in column (3) of Table 5. The results show that the estimated DID coefficient decreases after adding other policies but still passes the significance test at the 10% level. This indicates an overestimation of the improvement in eco-efficiency attributed to the establishment of ecological civilization demonstration areas. However, it does not affect the baseline conclusions of this paper, confirming the robustness of the findings.
Mediating Effect Test
The above empirical analysis results verify that the ecological civilization demonstration areas can improve eco-efficiency, but what is the mechanism of this effect?
Hypotheses 2 and 3 examine the mechanism through which the implementation of ecological civilization demonstration areas can improve eco-efficiency. We then test this mechanism from the perspectives of Res and Str, respectively. To analyze the above influence mechanism, and following Wen et al. (2014) [73], we adopt the following model:
Step 1: Verify the impact of the ecological civilization demonstration areas on eco-efficiency:
Step 2: Test the influence of the ecological civilization demonstration areas on two intermediary variables:
Among them, Mit represents two mediating variables: res and str. Res is resource dependence. The ratio of mining employment to total employment is included as a measure of resource dependence by referring to the practice of Shao et al. (2010) [69]. Str represents industrial structure upgrading, denoted by the ratio of the output value of the secondary industry to the output value of the tertiary industry, as defined in the study by Yan et al. (2020) [67]. Following Jiang (2022), this study constructs an econometric model to examine the mediating effect (Table 6) [74].
Columns (1) and (2) in Table 6 reveal that the coefficient of the ecological civilization demonstration areas is significantly positive (p>0.01), while the coefficient on the mechanism variable (res) is significantly negative, implying that the construction of the ecological civilization demonstration areas can alleviate resource dependence and promote eco-efficiency. This demonstrates that once a resource city becomes an ecological civilization demonstration area, the construction of ecological civilization demonstration areas imposes strict limits on the city’s pollution emissions. Thus, H2 is verified.
Columns (1) and (3) in Table 6 indicate that ECDA has a significantly positive coefficient on the dependent variable and a significantly negative coefficient on the mechanism variable, industrial upgrading (Str), indicating that ecological civilization demonstration areas drive industrial structure adjustments. To qualify as ecological civilization demonstration areas, resource-based cities prioritize developing clean industries, such as modern services. Industrial structure upgrading can drive the greening of industries and enhance environmental quality, ultimately improving eco-efficiency. Thus, hypothesis 3 of this paper is confirmed.
Heterogeneity Analysis
Regional Heterogeneity
As China covers a vast area, disparities in geography, resources, and living standards vary widely. The sample cities can be divided into three types: the eastern region, the central region, and the western region. For further exploration, we conduct empirical analysis in each of these regions. Table 7 shows that the estimated coefficients of DID in the eastern region are positive, indicating that ecological civilization demonstration areas in the eastern region can significantly improve eco-efficiency. In contrast, the estimated coefficients of DID in the central and western regions are not significant, indicating that ecological civilization demonstration areas do not improve eco-efficiency.
Resource-based cities located in the eastern region are somewhat weaker than those located in the central and western regions regarding deprivation of natural resources. Moreover, the eastern region enjoys considerably more opportunities for international trade and open economic opportunities. Consequently, it is easier for resource-based cities in the eastern region to capture more labor, capital, and other development factors to foster industrial transformation. Simultaneously, resource-based cities in the eastern region are more responsive to ecological civilization demonstration areas than those in the central and western regions. Serving as the carriers of China’s industrial transfer, resource-based cities in the central and western regions are characterized by a higher concentration of polluting and energy-intensive enterprises, often developing at the expense of the environment [75]. Additionally, the central and western regions lag in economic development, have relatively low investment in ecological management, and the role of ecological civilization demonstration areas in boosting eco-efficiency is relatively weak [76].
Table 6.
Role mechanism results.
| Variable | (1) y | (2) res | (3) str |
|---|---|---|---|
| ECDA | 0.051*** | -1.455*** | -0.338*** |
| (0.010) | (-0.132) | (-0.043) | |
| constant | -1.077*** | -5.543*** | -0.479*** |
| (-0.043) | (-0.580) | (-0.193) | |
| N | 1,710 | 1,710 | 1,710 |
| R2 | 0.4981 | 0.1217 | 0.068 |
Table 7.
Regional heterogeneity results.
Table 8.
City types heterogeneity results.
City Type Heterogeneity
China’s geographic location, resource endowment, and livability level vary widely. The sample cities can be divided into three categories: located in eastern, central, and western regions, for which we conduct empirical analyses separately. Table 7 illustrates that the coefficient of DID in the eastern region is positive, indicating that ecological civilization demonstration areas in the eastern region can significantly drive eco-efficiency, while the coefficients in the central and western regions are insignificant.
Different sustainability and resource industry dependence of these resource-based cities may have different policy impacts (Table 8). Resource-based cities have overly depended on resource development to achieve economic growth in their long-term development process [51]. Along with the depletion of resources, the long-term rough economic development model leads to low resource utilization, shrinking industrial profits, and environmental pollution. The ecological civilization demonstration areas policy sets higher requirements for industrial transformation, energy reduction, and environmental protection. Through this policy, resource-based declining cities can drive ecological efficiency by reducing resource consumption and developing clean industries. Simultaneously, many resource-based declining cities have a low level of development and are not highly dependent on resource industries, making it easier for local governments to transform these industries [77].
Conclusions and Policy Implications
China has embarked on a new era of growth, with green development serving as the central theme. In this context, where balancing economic progress and environmental preservation is paramount, enhancing eco-efficiency becomes imperative for addressing the dichotomy between China’s economic advancement and environmental degradation, as well as a pivotal aspect of its sustainable development strategy. Utilizing the Difference-in-Differences (DID) model, we select 19 resource-based cities designated as ecological civilization demonstration areas to assess the implications of this governmental policy. Our findings reveal three key points. Firstly, the ecological civilization demonstration areas policy significantly enhances eco-efficiency in resource-based cities, with those selected as eco-demonstration zones experiencing an increase in eco-efficiency by 0.0391 compared to resource cities not designated as such. Secondly, there exists regional and typological heterogeneity in the impact of ecological civilization demonstration areas on eco-efficiency. Specifically, while coastal cities’ ecological efficiency is promoted by these demonstration areas, the effect is insignificant in central and western regions. Conversely, the ecological efficiency of declining resource-based cities is notably influenced by ecological civilization demonstration areas, but this influence is not significant in other resource-based cities. Lastly, resource dependence and industrial upgrading are crucial mechanisms for facilitating eco-efficiency. Specifically, the ecological civilization demonstration areas policy can reduce resource dependence and foster industrial upgrading, thereby improving eco-efficiency. These conclusions offer insights into how authorities can formulate effective policies.
Therefore, the ecological civilization demonstration areas policy not only facilitates the green transformation of resource-based cities but also contributes valuable ideas for realizing sustainable development globally. To enhance the applicability and generalizability of our study’s conclusions, we draw the following policy implications with considerations from both Chinese and global perspectives.
First, policymakers should continue to support the implementation of ecological civilization demonstration areas due to the significant improvements in eco-efficiency observed in these cities. The economic transformation of resource-based cities is crucial not only for China’s high-quality development but also for promoting sustainable practices worldwide. By prioritizing eco-efficiency, policymakers can set an example for other regions globally that face similar challenges in balancing economic growth and environmental protection. Second, policymakers should strive to lessen their reliance on mining activities and actively seek new sources of energy and avenues to generate eco-efficiency substitutes. This shift is essential not only for the local environment but also for mitigating the global impact of resource extraction. Local governments should vigorously engage in developing diverse industries that can substitute for natural resources, preventing economic decline resulting from a monolithic economic structure. By fostering economic diversification, local governments can contribute to greater eco-efficiency and resilience, aligning with global sustainable development goals. Third, for resource-based cities in different regions, differentiated local policies need to be considered based on specific local conditions. Policymakers should recognize that each city’s unique circumstances require tailored strategies to realize the positive role of environmental policies in improving eco-efficiency. By adopting a context-specific approach, policymakers can ensure that their efforts are effective and contribute to the broader goal of sustainable development, both within China and internationally. By considering the broader implications of our findings, policymakers can make informed decisions that not only benefit local communities but also contribute to the global pursuit of sustainable development.
Limitations and Future Research Directions
Although this paper explores the existing issues as much as possible, it still has some shortcomings. The study is limited to 19 resource-based cities designated as ecological civilization demonstration areas in China, which may not fully represent the diverse range of resource-based cities across the country or globally. This selection might bias the results towards the specific contexts and characteristics of these cities. Besides, the findings indicate regional variations in the impact of ecological civilization demonstration areas on eco-efficiency, with coastal cities showing more pronounced effects than central and western regions. This heterogeneity suggests that the policy implications derived from this study may not be universally applicable without considering the specific regional contexts. Therefore, future research could benefit from expanding the sample size to include a broader range of resource-based cities, both within China and internationally, to enhance the generalizability of the findings. Moreover, comparative research across different countries or regions with similar policies could offer valuable insights into the transferability and adaptability of the ecological civilization demonstration areas model in diverse contexts. Meanwhile, incorporating qualitative research methods, such as case studies or interviews with policymakers and local stakeholders, could provide richer contextual information and nuanced perspectives on the challenges and opportunities of implementing ecological civilization policies.

