

Introduction
Cities are the primary drivers of a country’s economic development, and maintaining a harmonious and dynamic balance between urban economics and the environment is a critical global issue. Cities contribute approximately 80% to the global GDP, yet they are also responsible for over 70% of total global greenhouse gas emissions. On one hand, cities serve as hubs for population and industry concentration, accommodating more than half of the world’s population. The United Nations predicts that by 2050, 70% of the global population will reside in urban areas. On the other hand, resource consumption and environmental pollution resulting from human activities present significant challenges to the sustainability of urban development [1]. As China’s urbanization process undergoes a gradual shift from high-speed expansion to high-quality development, the urban development paradigm is required to transition from a quantitative growth model overly reliant on resources to a qualitative growth model that takes into account resource and environmental constraints. Within this context, enhancing urban ecological efficiency has emerged as an imperative necessity to realize a harmonious coexistence of both the quality and quantity dimensions of economic development [2].
The concept of ecological efficiency was initially introduced by Schaltegger and Sturm [3] as the ratio of value-added to environmentally affected value. It served as an indicator, bridging the domains of business and sustainability. In 1992, the World Business Council for Sustainable Development (WBCSD) first proposed the use of ecological efficiency to evaluate corporate environmental performance, aiming to maximize corporate value while minimizing resource consumption and negative environmental impacts. Subsequently, ecological efficiency has found extensive applications in various research domains, including aviation, biotechnology, agricultural production, and urban environments [4–6]. Its core principle remains focused on achieving low input, low emissions, and high output, thereby maximizing product competitiveness while reducing threats to the ecological environment [7]. In recent years, both the Ratio Approach and Data Envelopment Analysis (DEA) have been commonly used to calculate various types of efficiencies, including ecological efficiency, land efficiency, and energy efficiency, among others [8, 9]. The Ratio Approach defines ecological efficiency as the ratio between the value created and the environmental impact of products. However, it is susceptible to interference from subjective factors in setting indicator weights, which may affect the accuracy of results [10]. On the other hand, DEA, as a non-parametric frontier analysis method, allows the incorporation of multiple indicators into a unified system and automatically assigns weights, thereby capturing the interactions between indicators. DEA offers the advantage of providing a measure of relative efficiency for each decision-making unit based on the linear relationships between inputs and outputs for each sample rather than using absolute weights [11].
With the introduction of carbon peaking and carbon neutrality goals and the rapid growth of the digital economy, the construction of digital infrastructure centered around modern Information and Communication Technology (ICT) has significantly impacted China’s environmental governance approaches [12]. Leveraging digital infrastructure, cities have employed digital technologies to transform their economic development strategies and resident governance models, providing solutions to urban challenges such as resource consumption, environmental degradation, and unregulated expansion in a cost-effective and highly efficient manner [13]. According to the New Infrastructure Investment Analysis Report, compared to traditional infrastructure, investments in digitally upgraded new infrastructure have resulted in carbon emissions reductions across 22 industries, with a significant decrease in carbon emissions. However, it cannot be denied that the high energy consumption associated with the operation of digital infrastructure contradicts the current requirements for transitioning towards a green economy [14] Digital infrastructure, which relies on technologies such as the internet, big data, and 5G, expands from the inside out, and this expansion includes data centers and other internet facilities that intensify societal electricity use. This leads to industrial spillovers and economies of scale, further increasing energy consumption [15, 16]. In this context, researching the impact pathways of digital infrastructure on urban ecological efficiency plays a crucial role in achieving green and sustainable development in China and worldwide. To fully leverage the supportive role of the latest information technology in urban upgrading and transformation, the Chinese government initiated the National Smart City Pilot Program in 2012. Over the next two years, the scope of the pilot program was gradually expanded. As of 2020, the number of pilot cities in China’s smart city development approached 500 (covering over 89% of cities at or above the prefecture level and 47% of cities at or above the county level). The challenge of maintaining orderly and sustainable urban development has become a pressing issue for many countries [17]. Against this backdrop, this study explores whether digital infrastructure will contribute to the improvement of urban ecological efficiency, aiming to provide insights into achieving a dynamic balance between economic development and ecological conservation in cities.
Currently, research related to Digital Infrastructure Construction (DIC) and Urban Ecological Efficiency (UEE) primarily focuses on the spatiotemporal evolution of ecological efficiency measurement and the impact of digital infrastructure on specific industries or sectors. Few studies combine the two and analyze their transmission mechanisms. The most relevant research to this paper at present is Ren et al.’s (2023) study on the impact of new digital infrastructure construction on agricultural ecological efficiency. However, research on the effect of DIC on cities remains confined to a single industry or sector. The findings of this paper may contribute to the field of urban ecological efficiency. Secondly, this paper, building on existing research, incorporates a carbon emissions inventory as a non-desired output into ecological efficiency indicator construction, aiming to enhance the ecological efficiency indicator system. Lastly, there is currently no standardized characterization of DIC in research, with most studies portraying DIC as a single indicator such as internet or broadband investment, or using ICT-related indicators as substitutes. This not only fails to accurately measure the true level of digital infrastructure construction but may also result in endogeneity issues with ecological efficiency. In this paper, we employ the “Smart City” pilot as an external shock policy to mitigate potential endogeneity in indicator construction, and policy implications are derived from the results.
To elucidate the relationship and mechanisms between the two, this study employs data from 247 Chinese cities from 2007 to 2021. It treats China’s “Smart City” pilot policies as a quasi-natural experiment, utilizing a multi-period DID (difference in differences) and SDM (spatial Durbin model) to assess the impact of digital infrastructure development on urban ecological efficiency as well as the effectiveness of Smart City policies. The study further examines the channels through which Smart City policies influence urban ecological efficiency, focusing on green innovation drivers, industrial structural upgrades, and information platform support. To ensure the reliability of the results, this research conducts a series of robustness tests, including placebo tests, variable substitutions, the elimination of other policy interferences, and the removal of cities with unique characteristics, building upon the baseline regression analysis. It also takes into consideration that different city endowments may have varying effects on empirical results. Therefore, heterogeneous tests are conducted on the sample, categorized by pilot batch, geographic location, and whether the city is resource-intensive. Finally, by introducing the SDM to capture the spillover effects of Smart City policies, this study aims to provide insights and references for future urban ecological development and the implementation and promotion of policies.
The remaining sections of this study are arranged as follows: Section Two presents the policy background and research hypotheses. Section Three describes the research methodology and data. Section Four contains the baseline regression results and robustness checks. Section Five conducts mechanism analysis. Section Six demonstrates the spatial spillover effects of the research subjects. Section Seven discusses the research findings. Section Eight provides the conclusions and policy implications.
Policy Background and Research Hypotheses
Policy Background
The term “Smart City” was first introduced in the 1990s with the aim of promoting urbanization in a more technological, innovative, and globalized direction [18]. The content of smart city development includes smart infrastructure, intelligent transportation, smart agriculture, smart education, and more, with different countries emphasizing various aspects of development based on their geographical location, ecosystems, and environmental resources. In 2012, when the urbanization rate in China first exceeded 50%, the Central Economic Work Conference formally proposed a “new type of urbanization path that is intensive, intelligent, green, and low-carbon.” In the same year, in December, the first batch of applications for Smart City pilot projects commenced, with a total of 90 cities entering the pilot list. Over the following two years, applications continued, resulting in a total of 277 Smart City pilot projects. These pilot cities were required to undergo Smart City transformations in four major areas: security systems and infrastructure, intelligent construction and livability, smart management and services, and smart industries and the economy, within a creation period of 3–5 years. Ultimately, the Ministry of Housing and Urban-Rural Development conducted assessments and evaluations. The Smart City policy provided an environmental support system for the development of new infrastructure, utilizing information technology and data-driven solutions for urban governance, fostering a virtuous cycle for the economic and ecological sustainability of cities [19]. In summary, the Smart City policy pilot projects have provided an excellent quasi-natural experiment for evaluating the development of digital infrastructure.
Mechanism Analysis
Based on the previous analysis, ecological efficiency refers to obtaining optimal green economic outputs with minimal input factors and environmental disruption [20]. Given the complexity of digital infrastructure’s impact on the socio-economic sphere and the dual nature of its ecological effects, studying the influence of digital infrastructure on ecological efficiency requires a comprehensive consideration of both environmental and economic aspects. The economic impact brought about by digital infrastructure generally manifests as economic benefits. Investments in digital infrastructure provide residents with more convenient lifestyles and greater job opportunities. The increase in consumer surplus resulting from this not only far exceeds the investment costs but also promotes economic benefits. Additionally, the widespread adoption of information technology helps increase the number of employees engaged in research and development and enhances employee innovation efficiency, thereby further strengthening a company’s economic contribution to the market [21, 22]. Digitization has brought new dynamics and opportunities to economic development, but its environmental impact remains subject to debate. Network spillover effects of telecommunications infrastructure can alter consumers’ energy usage patterns, which favorably enhances energy efficiency, thus achieving the sustainability of both the economy and the environment [23–25]. However, the strong dependence of ICT on electricity will have a long-term impact on national energy consumption [26]. The DIC, as a fundamental unit of urban public services, inevitably results in significant carbon emissions due to its long-term and high-intensity operation. Nevertheless, existing research indicates that it is possible to mitigate urban carbon emissions and significantly reduce the negative externalities of digital infrastructure on the environment by improving marginal diminishing factor productivity and reducing the total energy input [16].
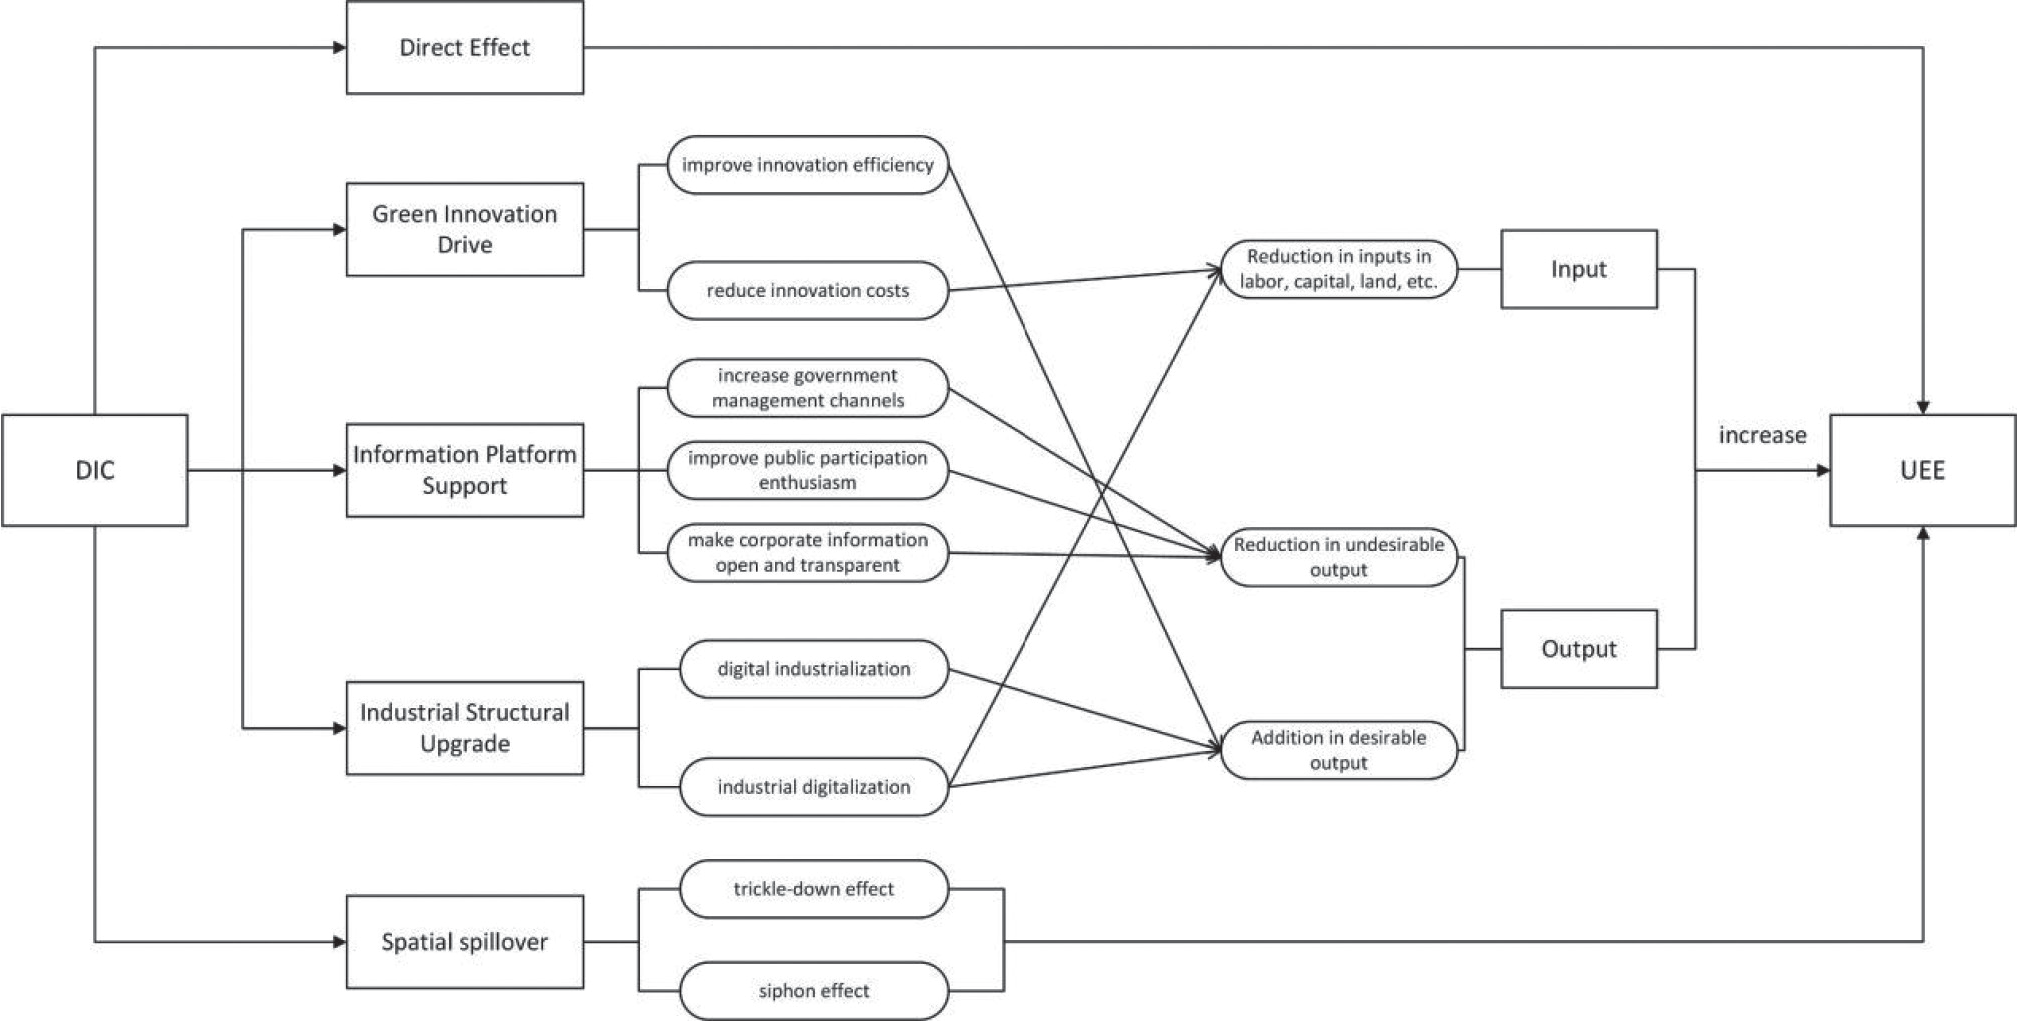
The construction of DIC exhibits different development patterns due to variations in factors such as the development status, geographical location, and resource environment of different cities. Given the relatively small differences in the developmental endowment of neighboring cities, a successful digital infrastructure construction model can provide learning opportunities for surrounding cities, driving an enhancement in the ecological efficiency levels of these neighboring areas. Additionally, DIC facilitates the free flow of factors like labor and capital among regions, promoting the “trickle-down” effect from the central developing city to stimulate the development of peripheral cities and achieve regional resource sharing.
However, based on spatial economics theory, central cities can exert a “siphon effect” on neighboring cities during their development. As mentioned earlier, DIC is characterized by high energy consumption. Typically, urban planning layouts tend to relocate these heavily polluting industries to peripheral areas far from the city center, which inevitably generates negative external environmental impacts on neighboring cities, restraining the ecological efficiency of these surrounding areas. Therefore, when both the “trickle-down effect” and the “siphon effect” come into play simultaneously, it is challenging to determine the spatial spillover effects of digital infrastructure construction on the ecological efficiency of neighboring cities. Further empirical analysis is required to address this issue. Hence, we put forth Hypothesis 1 and Hypothesis 2.
H1: DIC has the potential to enhance UEE.
H2: DIC influences the UEE of neighboring cities through spatial spillover effects. However, the direction of this impact remains uncertain.
According to the Diffusion of Innovation (DOI) theory, over time, innovation spreads among social actors, and information dissemination channels are crucial in influencing the spread of new ideas [27]. As a vital support for social information dissemination, DIC primarily demonstrates its role in driving GI in two main aspects: the enhancement of innovation efficiency and the reduction of innovation costs. DIC, relying on modern technologies such as cloud computing, big data, and the internet, possesses characteristics like openness and sharing. The flow of information across time and space promotes the acceleration of knowledge dissemination and the efficiency of resource allocation, thereby increasing the efficiency of GI across regions. Particularly in the context of deep integration between big data and the real economy, the flow of innovation factors exhibits spatial spillover effects, fostering a virtuous cycle of innovation interaction between regions and sectors further accelerating the enhancement of green innovation efficiency [28]. Furthermore, based on the absorptive capacity theory, enterprises, as important agents of green technology innovation, can enhance their ability to absorb external knowledge through big data. Big data helps enterprise managers more efficiently exercise top-down management, assisting companies in making rational decisions and planning, thereby improving the quality and efficiency of GI and achieving the sustainable development of both internal and external aspects [29]. The environmentally friendly nature of GI itself makes it an important means to improve UEE. The construction of DIC further enhances the promoting effect of this behavior on UEE.
The improvement of regional ecological efficiency is a multifaceted process involving interactions among government, society, and businesses [30]. DIC realizes the digitization and networking of public services and simultaneously propels the transformation of government governance into digital governance. The government can not only apply digital technology to environmental management and prediction processes but can also promote environmental protection, low-carbon production, and living through media networks, thereby providing an excellent public service environment for enhancing UEE [31]. Digital technology, while enhancing the speed of information dissemination, also makes market information more open and transparent, compelling enterprises towards green reform. Enterprises either actively reduce energy consumption and pollution emissions using new technologies or are forced to adopt cleaner production methods to comply with environmental regulations [32]. In comparison to the “visible hand” and the “invisible hand”, public participation, as a “soft tool” for enhancing regional environmental governance and green development, possesses unique advantages. Due to the inherent lag in information exchange among governments, enterprises, and the public, governments sometimes cannot promptly monitor whether companies are in compliance with their emissions. The public, as direct witnesses and victims, can often play a more effective role in supervising corporate behavior through their complaint actions compared to government oversight [30].
The promotion of industrial structure upgrading on UEE is manifested in aspects of digital industrialization and industrial digitalization. On one hand, digital technology, with its advantages of fast transmission and broad coverage, has rapidly infiltrated various industries and fields, giving rise to a plethora of emerging industries such as smart healthcare, online education, and new energy vehicles. It integrates digitalization into various aspects of production, exchange, distribution, and consumption [33]. Digital industrialization transforms the industrial structure toward technology-intensive industries with high efficiency and low energy consumption, thereby injecting new vitality into improving UEE. On the other hand, industrial digitalization is the process of digital technology upgrading traditional industries, leading to increased production quantity and efficiency [34]. The application of digital technology propels industries into the era of Industry 4.0, signifying the transformation from machine-led manufacturing to digital manufacturing. Digitalization automates production processes, optimizes resource utilization, and enhances energy efficiency and production efficiency. The construction of digital infrastructure provides technological support for industrial digitalization and, to a certain extent, alleviates the low UEE resulting from rapid industrialization in cities [35, 36]. Hence, Hypothesis 3 is proposed. Fig. 1. illustrates the mechanism by which DIC on UEE.
H3: DIC enhances UEE through green innovation driving, information platform support, and industrial structure upgrading.
Variable Selection and Research Methods
Variables Descriptions
Urban ecological efficiency (UEE) is a key focus of this study. To measure UEE, this paper employs the Constant Returns to Scale Undesirable Super Slack-Based Measure (CRS-US-SBM) model based on non-expected outputs. Data Envelopment Analysis (DEA) is a commonly used method for assessing ecological efficiency. DEA provides a measure of relative efficiency for each decision-making unit, computed based on the linear relationship between outputs and inputs for each sample, thus mitigating the impact of subjective factors on the results to some extent. However, DEA has limitations in accurately measuring the efficiency scores of decision-making units with a score of 1 and addressing input-output factor slackness issues. The non-expected output SBM model improves the DEA model by addressing these issues while incorporating non-expected outputs into the model [37]. Consequently, this paper chooses the CRS-US-SBM model to measure UEE, and the calculation formula is as follows:
In Equation (1), where there are assumed to be decision-making units, each unit comprises three input-output components: inputs (x), expected outputs (yg), and non-expected outputs (yb). These are represented by –x, y–g, and y–b, respectively, indicating the corresponding slack variables. The objective function value, p, represents the UEE, with m denoting the number of input indicators, s1 indicating the number of expected output indicators, and s2 representing the number of non-expected output indicators. Equation (2) presents the conditional constraints of Equation (1). In practical terms, inputs typically exceed their expected values, while the actual expected outputs often fall short of their expected values. Considering the situation of non-expected outputs, these outputs are invariably “overproduced” in inefficient cases, so their actual values exceed the expected values.
Regarding the selection of UEE indicators, this study followed the guidance of existing literature for the selection of indicators related to inputs and expected outputs. Inputs are categorized into four aspects: capital, labor force, land, and energy. Expected outputs are measured using the nominal GDP at current prices for the given year. Specific metrics used for calculations are presented in Table 1. As for the calculation of non-expected outputs, most existing literature primarily employs carbon emissions or related industrial pollution emissions as measurement indicators. This study integrates these indicators into the measurement system, with carbon emissions referring to the China Carbon Emissions Inventory developed by Shan et al. [38]. This inventory encompasses carbon emissions from 47 economic sectors within cities, including 17 fossil fuel sectors and emissions from cement production. It stands as one of the most comprehensive methods for calculating carbon emissions in Chinese cities to date and is sourced from the China Emissions Accounts and Datasets (CEADs). Other indicators of ecological efficiency are derived from the China City Statistical Yearbook (CCSY). Fig. 2. illustrates the temporal and spatial distribution of ecological efficiency across 247 sampled cities for the years 2007, 2015, 2018, and 2021.
Table 1.
Input-output indexes of UEE.
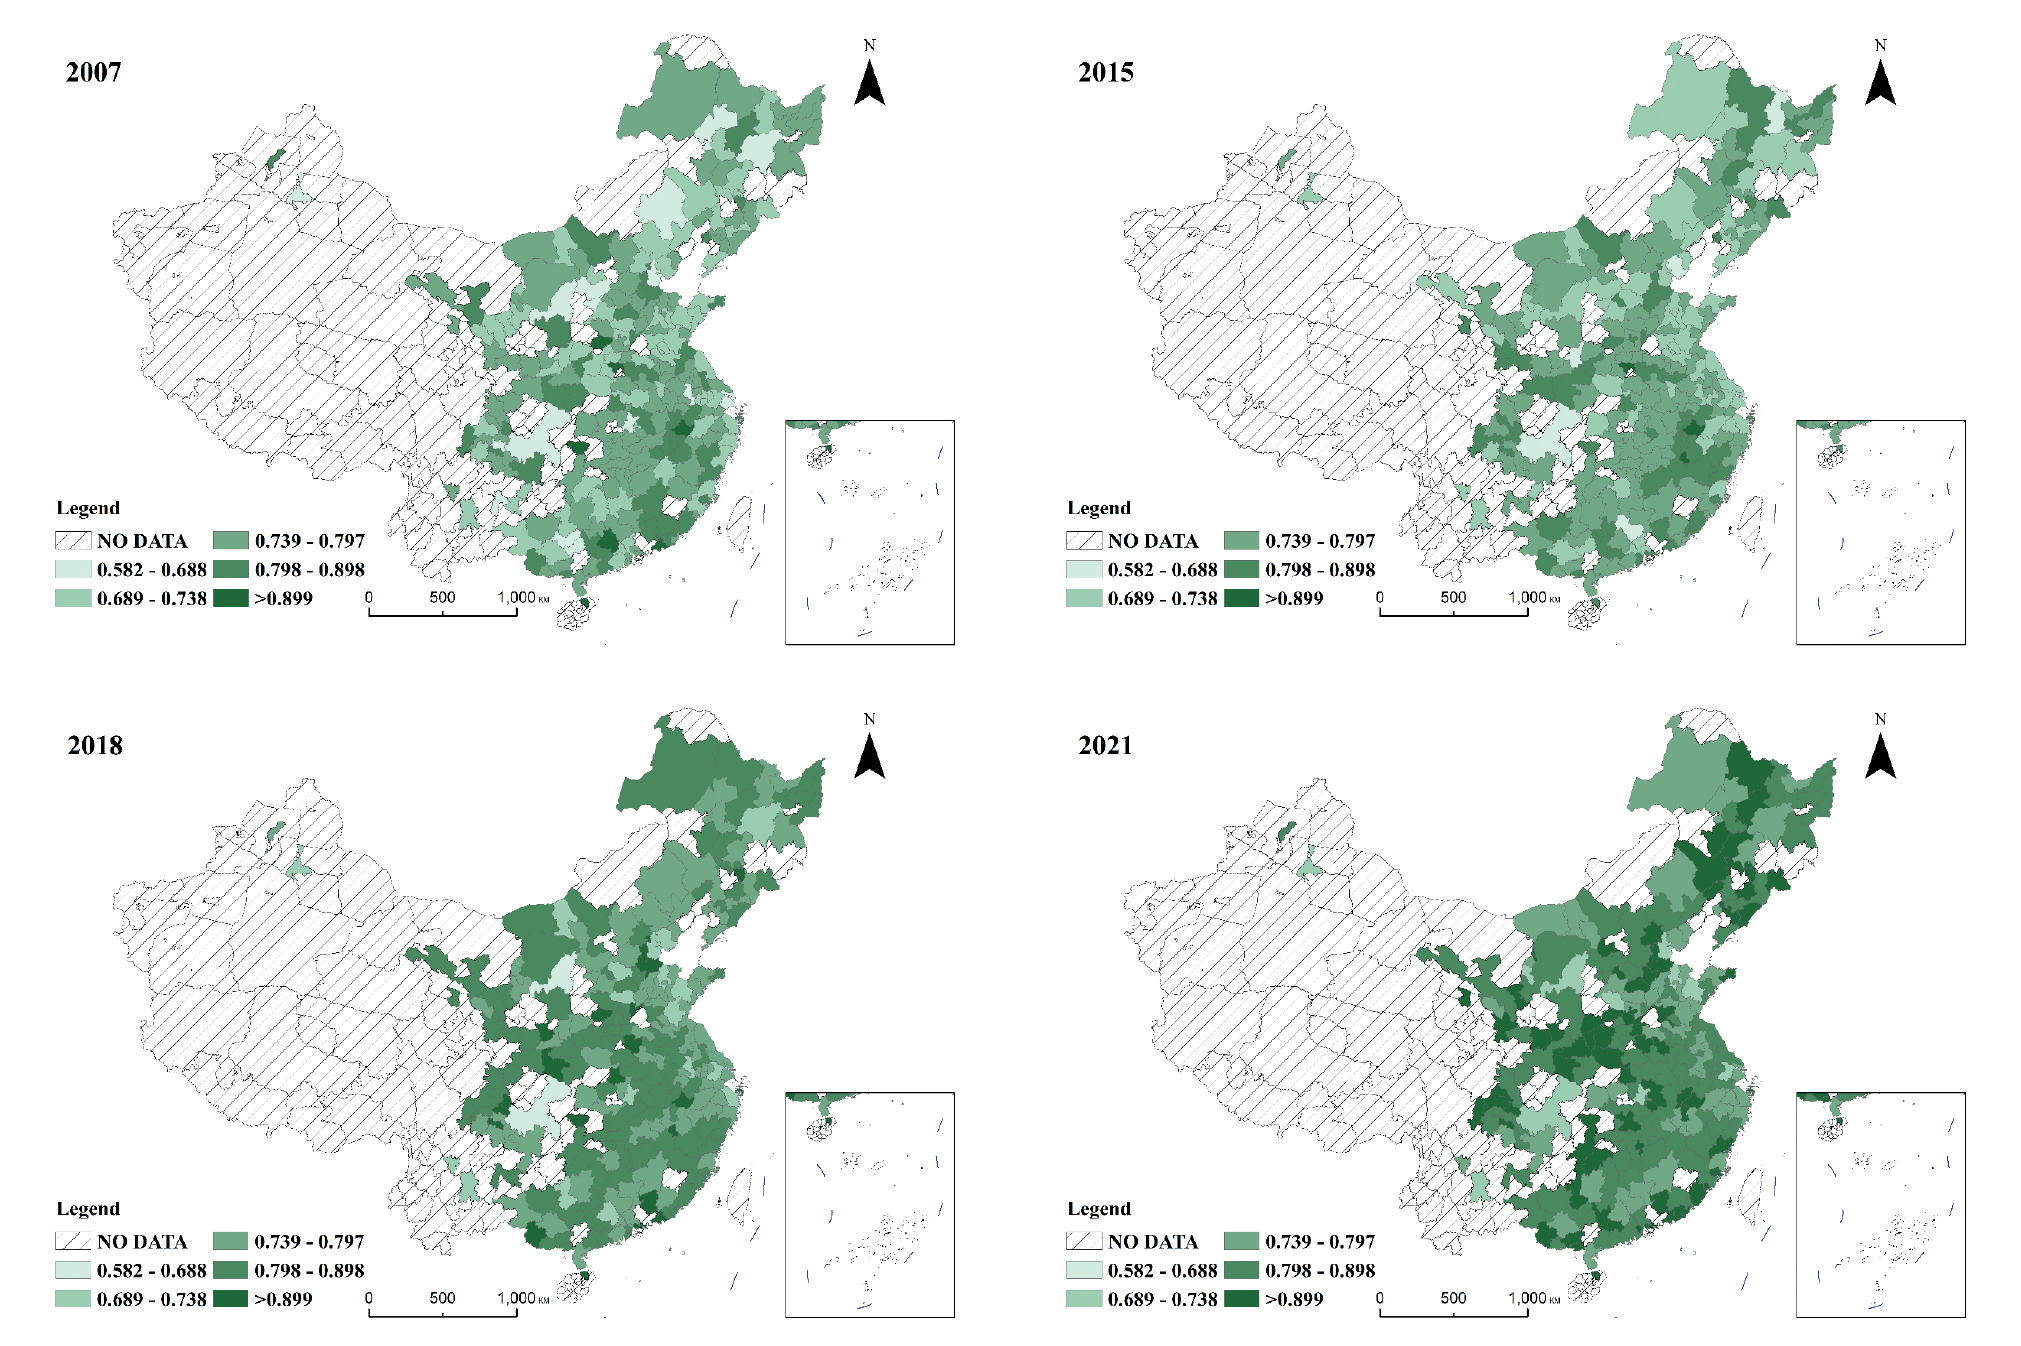
Digital Infrastructure Construction (DIC) is integral to this study. The policy pilot cities for smart cities provide an ideal quasi-natural experiment for assessing the impact of DIC on UEE. The implementation of smart city policies occurred in three phases. Certain cities with substantial missing data were excluded from the sample. Ultimately, 93 cities from the three policy phases were selected as the experimental group, while the remaining 154 cities were considered the control group. Furthermore, the policy announcements for the first and third phases were made in 2012 and 2014, but the list of cities was officially published in January 2013 and April 2015, respectively. Taking into account the time lag associated with policy implementation, this empirical research considers a one-year delay in the policy pilot dates, which corresponds to the years 2013, 2014, and 2015.
Based on relevant studies regarding DI and UEE, this study incorporates the following variables as control variables:1. Financial development level. Represented by the proportion of year-end RMB loans held by financial institutions to regional GDP. 2. Level of openness to foreign direct investment. Measured by the ratio of the actual use of foreign direct investment in a given year to regional GDP.
3. Population density. Represented by the ratio of the year-end population to the land area of the administrative region.
4. Government intervention level. Indicated by general budget expenditure as a proportion of regional GDP. 5. Social consumption level. Measured by the proportion of total retail sales of social consumer goods in the city to regional GDP. 6. Human resource reserve. Represented by the number of students currently enrolled in ordinary secondary schools.
Mediating Variables: 1. Green Innovation Drive (GID). Represented by the number of green patent applications. Following the calculation method of Shiwei et al. [39], this variable aggregates the number of green patent applications at the city level using the green patent list provided by the National Intellectual Property Office and the World Intellectual Property Organization (WIPO). The data is subsequently logarithmically transformed.
2. Information Platform Support (IPS). Measured by the number of broadband internet access users per 100 people. 3. Industrial Structure Upgrading (ISU). Indicated by the proportion of the value-added by the tertiary industry to GDP.
Research Models
This study focuses on the Smart City Policy pilot policy and analyzes the impact of DIC on UEE. Given the temporal and regional variations in pilot policies, we designate the Smart City pilot cities as the experimental group, while the remaining cities serve as the control group. To examine the effects, we employ the multi-period difference-in-difference (DID) method. The model is constructed as follows:
In the equation above, UEEit denotes the UEE index for cityin year. DIDit is a binary dummy variable representing the smart city policy pilot. It takes the value of 1 if cityis designated as a smart city pilot in year, and 0 otherwise. CONTROLSit includes a series of control variables that vary with changes in i and t. δit represents the city and time with interactive fixed effects. Following the method proposed by Bai [40], interactive fixed effects not only incorporate individual fixed effects but are more stringent, as they can control for factors at both the regional and temporal dimensions that may influence the dependent variable, thus mitigating omitted variable bias. εit represents the random disturbance term, and standard errors are clustered at the city level. α1 is the coefficient of primary interest in this study. If the coefficient is significantly positive, it demonstrates that DIC has a promoting effect on UEE.
To further identify the mechanisms through which ISU, GID, and IPS influence UEE in the context of DIC, we constructed and tested the mediation effect model:
In the equation above, Midit represents the mediating variable. First, observe the coefficient of α1 in the baseline regression in equation (3). If it is statistically significant, it demonstrates a significant effect of DIC on UEE. Next, use equation (4) to perform a regression test of the significance of β1. If it is statistically significant and positive, it indicates a positive mediating effect of the mediating variable in the influence of DIC on UEE, and vice versa.
To investigate the potential spatial spillover effects of DIC on UEE, we construct a spatial econometric model based on Lesage and Pace [41]:
In the equation, ωij represents the spatial weight matrix, ρ stands for the spatial lag autoregressive coefficient, and υ1 and υ2 denote the regression coefficients for the spatial interaction terms of the explanatory and control variables. To account for the effects resulting from both geographical distance and economic distance, this study opts for the spatial inverse distance matrix for estimation.
The data for this study was sourced from the China City Statistical Yearbook (CCSY), the China Carbon Accounting Database (CEADs), various provincial statistical yearbooks, and national economic and social development statistical bulletins. Samples with severe missing data were removed, and interpolation was applied to supplement some missing data. Descriptive statistics for each variable are provided in Table 2.
Results and Discussion
Benchmark Regression Results
Table 3 presents the empirical results of the impact of DIC on UEE. We employ a progressive regression approach, categorizing control variables into economic and non-economic factors and conducting stepwise regressions. Observing columns (1) to (4) of Table 3, it can be noted that the inclusion or exclusion of control variables does not affect the significance of the regression coefficients significantly. The minor changes in coefficients suggest that smart city pilot policies, as a quasi-natural experiment, exhibit strong exogeneity, with minimal potential influence from selected economic factors and other unobservable variables. Regarding economic significance1, the implementation of smart city pilot policies 1 The formula to calculate economic significance is: (Regres-
sion coefficient of the independent variable * Standard de-
viation) / Mean of the dependent variable. results in an average increase of 1.06% in urban ecological efficiency. The estimated coefficients for smart cities are statistically significant in different models, indicating that, compared to cities that have not implemented smart city pilot projects, DIC in pilot cities more effectively promotes the enhancement of UEE. Thus, Hypothesis 1 is supported.
Table 2.
Descriptive Statistics.
Endogeneity Test2
There may be endogeneity issues between the digital economy and urban ecological efficiency, suggesting the need to select appropriate instrumental variables for testing. Following the approach of Huang et al. [42], this study uses the number of fixed telephones in each city in 1984 as an instrumental variable. On the one hand, the quantity of fixed telephones in the 1980s significantly represents the historical development of telecommunications infrastructure in a given locality, and it has had a substantial influence on the subsequent application of internet technology from both a technological and lifestyle perspective. On the other hand, as the level of economic development increases, the importance of fixed telephones gradually decreases with a decrease in their frequency of use, satisfying the exogeneity requirements of instrumental variables. To construct panel data that meets the research needs, the number of fixed telephones in each city in 1984 interacted with the previous year’s national internet users and the year-end mobile phone users to create instrumental variables I and II. Additionally, following the study by Xun et al. [43], the spherical 2 We conducted robustness checks, including parallel trend
tests, placebo tests, replacing the dependent variable, con-
trolling for other policy interferences, and removing samples
with weak endogeneity. Due to space limitations, these re-
sults are not presented in the main text but can be provided if
you need. distance from each city to Hangzhou is chosen as the third instrumental variable for DIC. These three instrumental variables are then incorporated into the regression model. Table 4 demonstrates that, under the premise of weak identification and overidentification tests, the effect of digital infrastructure development on improving UEE remains valid and is significant at the 1% level.
Heterogeneity Analysis
Batch Effects Analysis
Given that the smart city pilot policy was implemented in three different batches, it is essential to investigate whether the policy’s impact on UEE varies across these different implementation phases. To achieve this, three dummy variables, namely DID2013it, DID2014it, and DID2015it, were introduced in regression analyses to assess the differential effects of policy implementation in different years on UEE. The results are presented in Table 5. The first four columns of Table 5 report the regression results for the initial two years of policy implementation. It can be observed that the second batch of pilot cities had a significantly lower positive impact on UEE compared to the first batch. This divergence in outcomes may be attributed to various factors. Firstly, the initial pilot cities bear the responsibility of setting an example, and governments invest substantial resources to build smart cities, hoping they will serve as demonstrations for broader implementation in other cities. Secondly, after the success of the first batch, the second batch of cities might tend to replicate the development models without innovation, which might not be conducive to their own urban development [44]. The last two columns of Table 5 present the results for the third batch of pilot cities. The estimated coefficients for this batch show a slight increase in comparison to the second batch. One possible explanation for this increase is that, with the introduction of the big data strategy, smart city policies could leverage more advanced technological capabilities in pilot cities, leading to a more pronounced enhancement of UEE.
Table 3.
Baseline estimation results.
Regional Heterogeneity Analysis
Taking into account the vast geographical expanse of China and the differences in the endowment of production factors across regions, the overall sample was divided into four sub-samples representing the Eastern, Central, Western, and Northeastern regions of China, respectively, to estimate the varied effects of DIC development on these different economic zones. Table 6 presents the regression results, where the estimated coefficient of smart city policies is significantly positive in the Eastern and Western regions. This suggests that the promotion of UEE through DIC development is more pronounced in both the Eastern and Western regions. This is because, compared to other regions, the Eastern region has better economic foundations, locational advantages, and policy environments, which can easily synergize with DIC development, thus enhancing UEE. In the Western region, there is a notable gap in infrastructure development compared to the Eastern region, and the implementation of smart city policies significantly raises the local level of DIC, resulting in a noticeable improvement in UEE.
Table 4.
Endogeneity test.
Table 5.
Heterogeneity analysis based on different batches.
Resource Endowment Heterogeneity Analysis
The resource endowment of cities plays a significant role in influencing UEE. This study classifies cities into resource-based and non-resource-based categories for regression analysis3. The results, as presented in Table 7, columns (1) and (2), show that the estimated coefficients for smart cities are significantly positive in both categories. However, the estimated coefficient for resource-based cities is larger. This is mainly because smart city policies in resource-based cities can generate more substantial energy-saving and emission reduction effects, thereby promoting improvements in UEE. Additionally, the “Notice” further classifies resource-based cities into four types: growth, mature, declining, and regenerative, based on their resource security and sustainable development capabilities. This study 3 Criteria for classification can be found at: https://www.gov.
cn/zwgk/2013-12/03/content_2540070.htm matches these classifications with the sample cities for regression analysis, as shown in the last four columns of Table 7. Only mature and regenerative cities pass the significance test at the 10% level, indicating that smart city policies have a more significant impact on improving UEE in these two city types.
Mechanism Analysis
Based on the theoretical analysis presented in Section 3.2, within the context of DIC, green innovation driving, information platform support, and industrial structure upgrading can promote UEE. This section examines how these three mechanisms play a role in the impact of DIC on UEE. Building upon the previous analysis, this mechanism test does not incorporate the mediation variables as control variables into the baseline regression model. There are two reasons for this: firstly, a review of previous literature establishes that the selected mediation variables have a positive impact on the dependent variable; secondly, including them in the base model may introduce potential endogeneity. Hence, in this section, Equations (3) and (4) are used to regress the three mechanisms to examine their operative pathways.
Table 7.
Heterogeneity analysis is based on different resources.
Table 8.
Results of the mechanism test.
| Variable | (1) | (2) | (3) | (4) |
|---|---|---|---|---|
| UEE | GID | IPS | ISU | |
| DID | 0.021*** | 0.901*** | 0.603*** | 0.171*** |
| (0.005) | (0.092) | (0.072) | (0.037) | |
| CONTROLS | YES | YES | YES | YES |
| City×Year FE | YES | YES | YES | YES |
| N | 3705 | 3705 | 3705 | 3705 |
| R2 | 0.997 | 0.978 | 0.998 | 0.948 |
Table 8, column (1), presents the baseline regression results, while column (2) depicts the regression results of green innovation driving smart cities. The significant positive estimate for smart cities suggests that DIC can enhance a city’s green innovation capability. Moreover, green technological innovation is considered one of the solutions to global climate change and energy consumption [45], and its inherent environmentally friendly characteristics are also crucial for improving UEE. Column (3) demonstrates the results of information platform support for smart cities. The estimate of 0.603, along with its passing of the 1% significance test, signifies that DIC promotes the development of information platforms. Additionally, information platforms support the multi-stakeholder governance structure of government-society-enterprise in environmental governance, leading to reduced pollution emissions, resource consumption, and other non-desired outputs, thereby enhancing UEE. Column (4) reveals that smart cities also significantly promote urban industrial structure upgrading. Industrial structure upgrading can positively impact urban economic development and environmental governance through digital industrialization and industrial digitization. As a result, it contributes to the enhancement of urban ecological efficiency. Thus, Hypothesis 3 is supported.
Spatial Spillover Regression Results
The above analysis is based on the DID model, which conducted baseline regression, robustness tests, heterogeneity analysis, and mechanism testing on the relationship between smart city policies and UEE. In this section, a spatial econometric model will be used to examine the spatial spillover effects of smart city policies. Additionally, based on the regression results, we will determine whether the dominant effect in the spatial spillover process is the “siphoning effect” or the “trickle-down effect.” This will provide empirical evidence for future policy implementation. Before the regression, the Global Moran’s I test was applied to assess the spatial correlation between the explanatory variable and the dependent variable. Table 9 indicates that over the fifteen years from 2007 to 2021, UEE’s Moran’s I was significantly greater than 0, implying a significant positive spatial autocorrelation in UEE. Since the smart city pilot policies began in 2013, the table reports Moran’s I only after 2013, which also exhibits significant positive spatial autocorrelation. This suggests that the smart city pilot policies not only influence the UEE of the host city but also affect neighboring cities, necessitating the construction of an appropriate spatial econometric model to examine policy effects.
Table 9.
Moran’s I (2007–2021).
Table 10.
Results of the spatial panel model selection test.
The test results in Table 10 show that the LM statistic is significant at the 1% level, indicating the appropriateness of selecting a spatial econometric model. The LR test statistic and the Wald test statistic are also significant at the 1% level, indicating that the Spatial Durbin Model (SDM) is superior to the Spatial Error Model (SER) and the Spatial Lag Model (SAR). The LR test for spatiotemporal effects is significant at the 1% level, suggesting that when choosing the SDM model, a spatiotemporal fixed-effects model is more effective. Based on this, we select the SDM model with spatiotemporal fixed effects for our analysis.
Table 11 presents the regression results of the spatial econometric models. The first three columns represent the regressions using three different models. Based on the R-squared statistic and the significance of the explanatory variables, the Spatial Durbin Model (SDM) is the relatively optimal choice. The coefficient for smart cities is -0.007 and is significant at the 1% level, indicating a negative spatial spillover effect of smart cities on urban ecological efficiency, with the predominant role of the “siphon effect.” The following three columns break down the spillover effects within the SDM model: The direct effect represents the impact of smart city policies on local ecological efficiency, with a coefficient sign opposite to the baseline regression due to the consideration of variable spatial lags in the spatial econometric model. The indirect effect reflects the influence of smart city policies on the UEE of neighboring areas, which is the spatial spillover effect of particular interest in this chapter. The estimated coefficient for smart city policies is -0.138, signifying, at a 1% confidence level, that DIC has an inhibitory effect on the UEE of surrounding cities. This result aligns with the “pollution haven” hypothesis, suggesting that industries with severe pollution tend to relocate from areas with stringent environmental regulations to regions with weaker regulations [46]. Cities implementing smart city initiatives are likely to enhance local environmental regulations, potentially leading to a pollution refuge effect between regions, which, in turn, causes the siphon effect of pilot cities on adjacent cities, resulting in decreased UEE. The total effect is the sum of the direct and indirect effects, further demonstrating that, in the spatial econometric model, DIC has a negative spillover effect on the UEE of surrounding cities.
Conclusions
Compared to traditional infrastructure such as transportation and postal services, DIC has improved public service quality and enhanced resource allocation efficiency through digitization, thereby increasing a city’s ecological efficiency. Treating smart city pilot policies as a quasi-natural experiment in DIC, the study found that cities implementing pilot policies showed an improvement in UEE relative to cities that did not implement these policies. This conclusion aligns with the findings of Ghimire and Johnston [47]rain gardens, porous pavements, and green roofs are emerging as viable strategies for climate change adaptation. The modified framework includes 4 economic, 11 environmental, and 3 social indicators. Using 6 indicators from the framework, at least 1 from each dimension of sustainability, we demonstrate the methodology to analyze RWH designs. We use life cycle assessment and life cycle cost assessment to calculate the sustainability indicators of 20 design configurations as Decision Management Objectives (DMOs. When examining the mechanisms through which DIC affects UEE, the study found that the estimated coefficient for smart city policies’ impact on green innovation was the largest. This suggests the importance of technological innovation for a city’s sustainable development, consistent with the results of Ahmad et al. [48]. Additionally, the influence of DIC on UEE exhibits resource heterogeneity, with a more pronounced promoting effect of DIC on resource-based cities. This finding differs from the study by Guo et al. [49], who analyzed the impact of smart city pilot projects on energy and environmental performance, suggesting that non-resource-based cities have more diversified industrial structures, reducing their reliance on energy. The divergent performance of the two types of cities in this study may offer insights for future research directions and policy implementation. However, this study has certain limitations. First, while it employed smart city pilot policies as a quasi-natural experiment for DIC and regressed virtual variables against UEE, as DIC becomes more comprehensive, its evaluation system and measurement indicators will be more diverse. Future research can consider standardizing DIC variable indicators for more precise regression results. Second, the spatiotemporal analysis of UEE should be more comprehensive. Due to space limitations, the paper did not extensively analyze the spatiotemporal distribution of UEE. Based on the results presented in Fig. 2, future research could explore the combination of ecological efficiency with the Hu Huanyong Line.
Table 11.
The spatial econometric regression results.
This study, based on panel data from 247 cities in China from 2007 to 2021, employs multiple-period DID, CRS-US-SBM, Arc-GIS spatial analysis, and SDM to empirically investigate the relationship between DIC and UEE. The study yields the following findings: (1) DIC has a significant positive impact on UEE. This conclusion remains valid even after the introduction of instrumental variables and a series of robustness checks.
(2) The ecological efficiency improvement effect of DIC exhibits distinct variations based on batches, regions, and resource heterogeneity. In eastern and western regions and among resource-based cities implementing the first and last batches of pilot policies, DIC has a more pronounced positive impact on UEE. (3) In the current development stage, DIC primarily affects UEE through three channels: green innovation, information platform support, and industrial structure upgrading. Among these, the influence of green innovation is the most substantial.
(4) DIC has a negative spatial spillover effect on the UEE of neighboring cities. This is mainly due to the predominant role of the suction effect in its impact process.
Based on these conclusions, the study offers the following recommendations: First and foremost, focus on the technical integration and environmental enhancement effects of DIC to enhance urban ecological efficiency. Additionally, addresses the issue of the uneven impacts of DIC on UEE by actively promoting resource coordination and experience sharing among different regions and various batches of pilot cities, thereby reducing regional disparities. Finally, mitigate DIC’s negative impacts on neighboring cities’ ecological efficiency by establishing an effective regulatory system to monitor and reduce environmental pollution from urban development. Furthermore, cities can engage in regional cooperation mechanisms to collaboratively address the ecological effects of DIC and implement environmental protection measures.

