

Introduction
With the contradiction between the goal of human social development and that of ecological and environmental protection becoming increasingly clear, China has proposed the goal of carbon peaking by 2030 and carbon neutrality by 2060. Smart city construction is an important way in which to cope with the current challenges of climate change and rapid urbanization [1]. Moreover, it is involved in national sustainable development as an important innovation-driven initiative [2, 3]. As of 2020, a total of 749 cities in China were included in the plan for smart city construction, which focused on the innovative transfer of information technology. Visibly, innovation is considered the engine of modernization and the key driver of smart city construction and economic growth [4]. Additionally, because facilitating the creation of a reciprocal and synergistic pattern for innovation factors can enhance the transformation and upgrading of smart cities, it is meaningful to establish urban innovation ecosystems for sustainable development [5]. Moreover, similar to biological communities, innovation ecosystems prioritize symbiosis and dynamics, where innovation subjects and environments coexist and mutually influence one another [6]. Thus, the implementation of innovation ecosystems can effectively address issues such as regional disparities in development, inefficient innovation activities, and weak links in innovation chains [7]. In particular, the virtuous cycle of conversion and interaction among material, energy, and information fosters the robust development of urban innovation ecosystems, enabling dynamic evolution that can withstand external disruptions [8]. Therefore, the innovation ecosystems are significant for smart transformation in urban management.
The innovation ecosystem concept was initially proposed in 2004 and then evolved within the context of globalized innovation, relying on ecological theories and methods [9]. This concept originally referred to an operational paradigm that leverages natural ecosystems in the collaborative innovation process [8]. Since its proposal, this concept has been popularly applied in many fields [10-13], and its connotations have been interpreted in diverse ways [14-17]. For example, Holgersson et al. defined an innovation ecosystem as a complex system of symbiosis and competition that is formed by innovation groups and the surrounding innovation environment [18]. Until now, scholars have not reached a unified conclusion as to what constitutes an urban innovation ecosystem. Kummitha proposed that an urban innovation ecosystem consists of a heterogeneous and evolving set of components that are interconnected through a complex network of relationships, create value together, and are interdependent for survival [19]. Most scholars have shown that the urban innovation ecosystem is an organic whole of interconnection and synergistic progress among the innovation community, innovation resources, and the innovation environment [20-22]. It can be concluded that the urban innovation ecosystem emphasizes the interaction between biomes and the external environment and the dynamic evolution of innovation subjects. Thus, the construction of ecological flows of innovation ecosystems is critical for assessing the level of urban sustainability and is critical for cities to maintain a healthy equilibrium.
Currently, urban innovation ecosystems have been gradually built, and three streams of research have focused on three aspects: performance assessment, evolution mechanisms, and system evaluation. In terms of performance assessment, for example, Bai and Jiang [23] constructed a correlation weight matrix combined with spatial metrological analysis to study the impact of collaborative innovation on the performance of Chinese provinces. Wang and Luo emphasized innovation output when assessing the innovation performance of innovative cities [24]. In terms of the evolution mechanisms, for example, Pique et al. [25] examined the mechanisms of the Silicon Valley innovation ecosystem, which was found to be centered around high-tech firms and to be constituted by universities, research institutions, integrated service infrastructures, talent pools, entrepreneurship, and gemstone markets. Moreover, Zhang and Ji [26], Ma et al. [27], and Liu and Xie [28] analyzed and simulated the innovation mechanism of competitive evolution and symbiotic synergy among cities. In terms of system evaluation, for example, Komninos [29] comprehensively assessed generic pathways for the green transformation of urban ecosystems based on prioritization, identification, and digital platforms. Liu et al. [30] measured and evaluated the suitability of regional innovation ecosystems with models of niche suitability and evolutionary momentum. Furthermore, the content of system evaluation includes mainly health in dynamic processes [30-33]. Although there is no unified evaluation system, the indicators constructed from various perspectives exhibit inherent unity, as they provide necessary conditions and characteristics for the health of an innovation ecosystem. The types of indicators selected for urban innovation ecosystem evaluations are displayed in Table 1.
The method for evaluating the health of urban innovation ecosystems is another focus. Significantly, the established methods have shifted from qualitative to quantitative. In the early stage, the health of urban innovation ecosystems was measured by using the hierarchical analysis method [41], the mutation-level method [42], and the close value method [36]. Subsequently, the HF-EDAS (hesitant fuzzy-evaluate based on distance from average solution) method [43], the InVEST (Integrated Valuation of Ecosystem Services and Tradeoffs) model [40], the TOPSIS (entropy-weight-Technique for Order of Preference by Similarity to Ideal Solution) method and the ARIMA (Autoregressive Integrated Moving Average) method [37] were proposed. We introduce the combined DEMATEL (Decision-making Trial and Evaluation Laboratory)-TOPSIS method to evaluate urban health status. Simultaneously, an improved entropy value method is adopted to eliminate the interference of subjective factors in the traditional DEMATEL method [44], which is based on visualized causal diagrams and mathematical matrices to demonstrate diversified relationships and degrees of influence between factors [45]. The TOPSIS method is a decision-making method [46] in which the closeness between an evaluated object and its ideal state is calculated, and the priority ranking obtained is objective due to the exclusion of experts’ subjective influence on weights. The combination of the DEMATEL and TOPSIS methods not only enables the clear identification of hierarchical relationships within the system but also provides a comprehensive assessment of the proximity to the state. It avoids the shortcomings of a single DEMATEL method for the overall logical relationship analysis and a single TOPSIS method for the inaccurate analysis of the influence degree among indicators. Although the combined method is rarely applied in the health evaluation of innovation ecosystems in cities, it is widely employed in the fields of enterprises [47- 49] and buildings [50, 51] index evaluation, providing valuable insights. In summary, the DEMATEL-TOPSIS method exhibits feasibility and has significant advantages in evaluation studies, thus providing theoretical and methodological support for the health evaluation of urban innovation ecosystems.
Table 1.
Indicators for evaluating the health of urban innovation ecosystems.
From the above, we can see that the objects of existing systematic evaluation are mostly concentrated on enterprises, cities, and regions. There is a lack of relevant research on smart city ecosystems. Moreover, few studies use the combined method of DEMATEL-TOPSIS to evaluate the health of urban innovation ecosystems. This is the gap that we intend to fill in this paper.
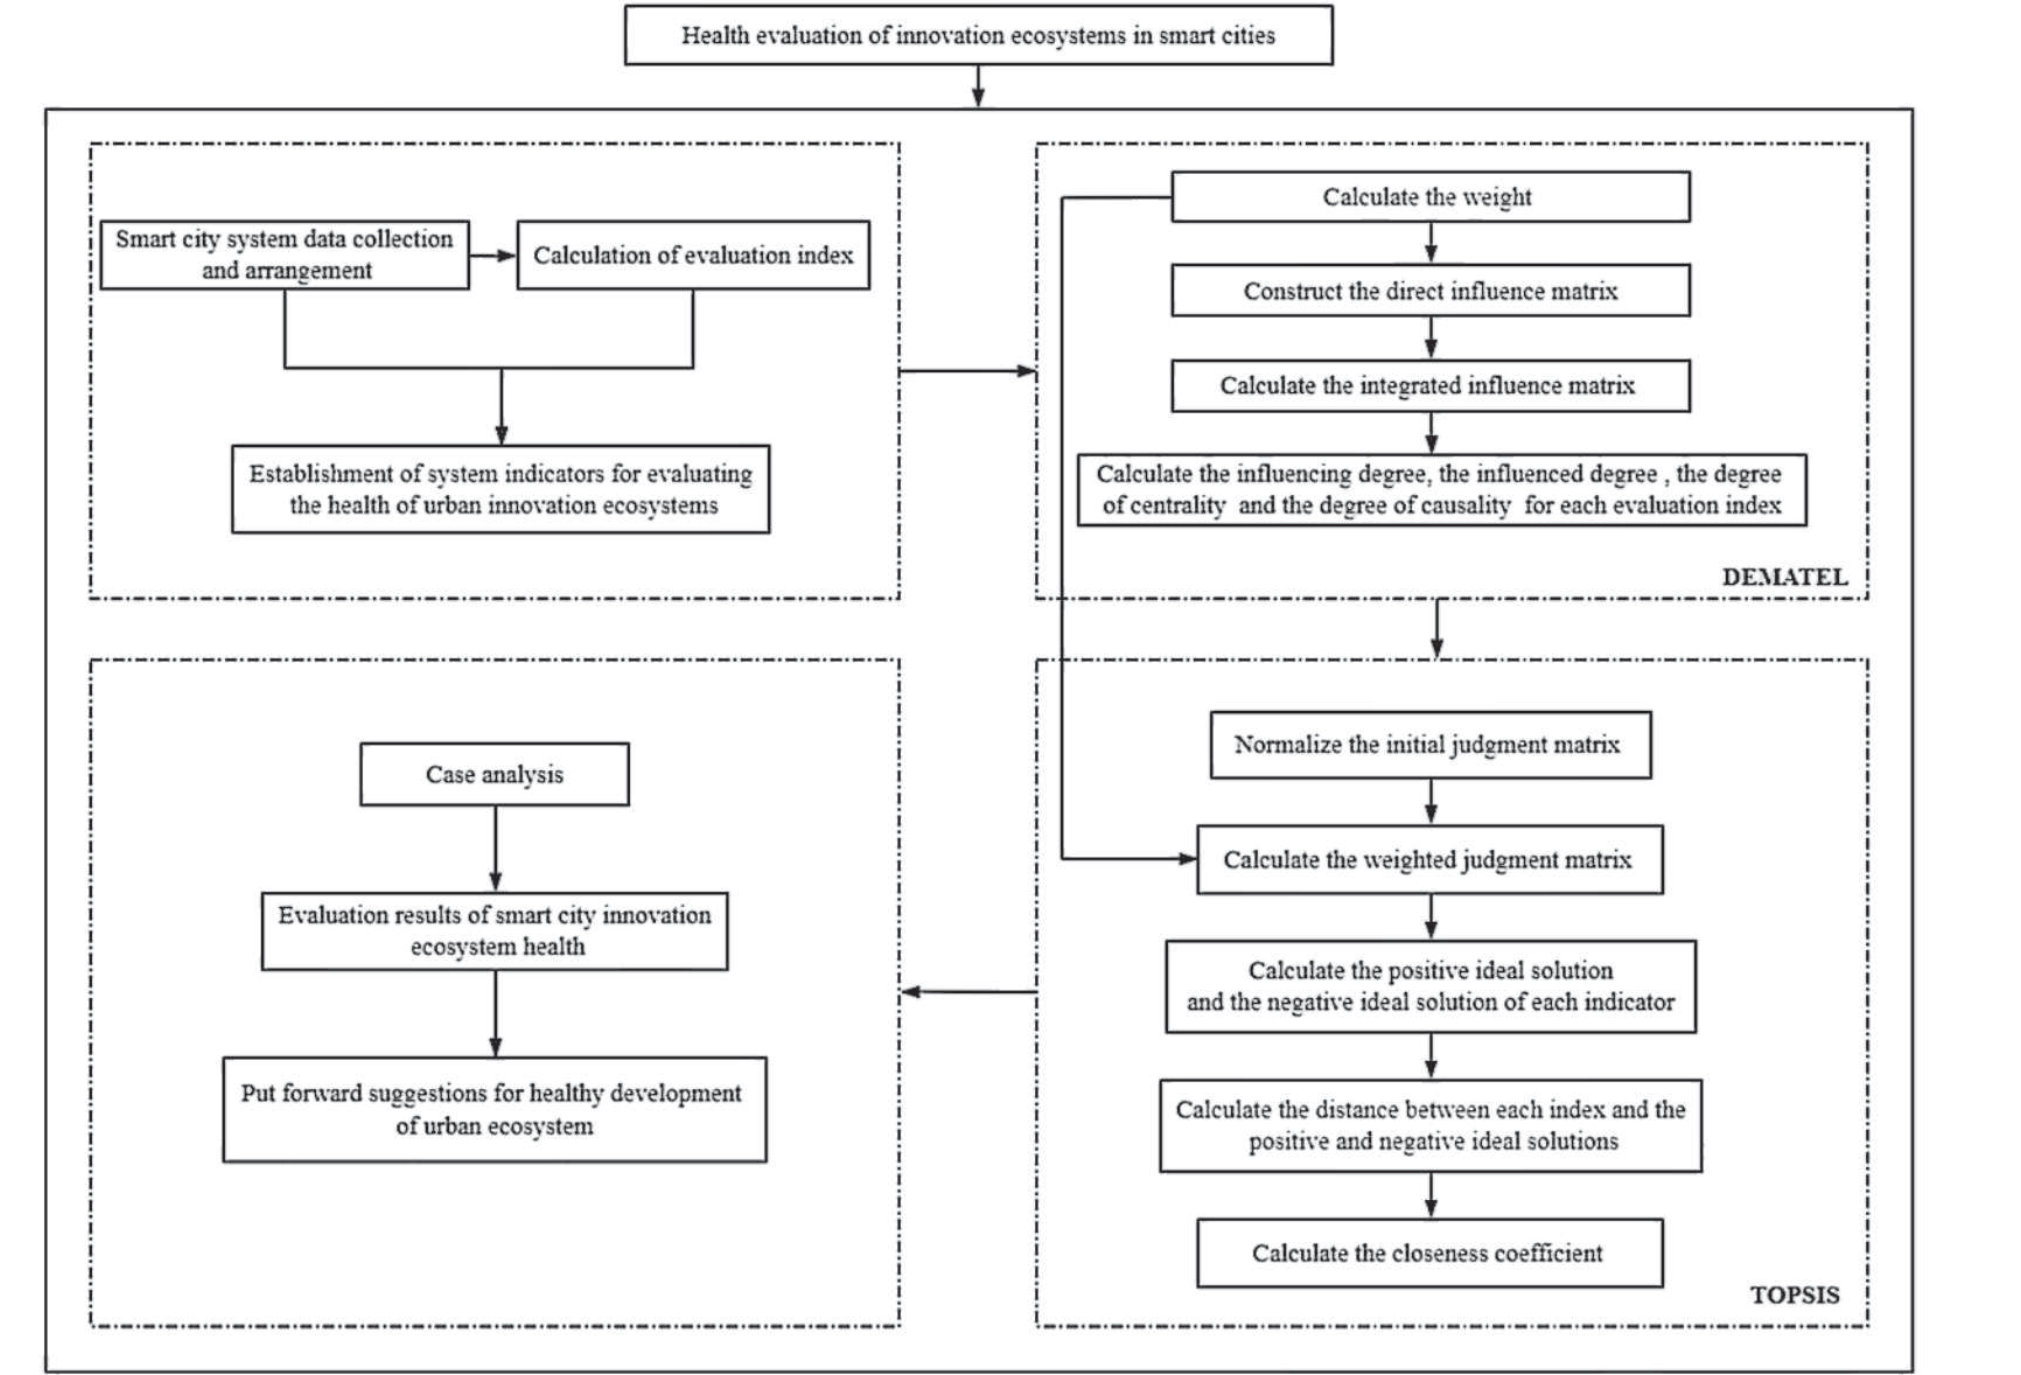
The aim of this paper is to evaluate innovation ecosystem health for the transformation and upgrading of smart cities. Wuhan, as a smart city, was selected as our research object. The evaluation index system was originally established to evaluate the health of urban innovation ecosystems. The improved entropy method was applied to weigh the evaluation indicators. Then the DEMATEL method was used to analyze the causal relationships and the degrees of influence among indicators. The TOPSIS method was adopted to assess the health status of the innovation ecosystem in Wuhan from 2012 to 2020. Finally, paths were proposed to improve the health level of Wuhan’s innovation ecosystem. The workflow of the research is shown in Fig. 1.
Material and Methods
Study Area and Data Sources
Wuhan is the center of finance and trade, science and technology research and development (R&D), and culture and education in central China. Wuhan, as a Chinese smart pilot region, has advanced smart city construction and possesses the foundation and capacity to leverage big data and machine learning, capitalizing on its unique advantages in terms of industry and educational resources. By 2020, Wuhan had successfully carried out 42 institutional reforms related to resource conservation and environmental protection and set up the Hubei Carbon Emission Trading Platform, with the value added of high-tech industries accounting for 22.8% of its gross domestic product (GDP).
The main data sources of this paper are the Wuhan Statistical Yearbook (2012-2021) and the Wuhan Science and Technology Statistics Summary Table (2012-2021).
Establishment of System Indicators for Evaluating the Health of Urban Innovation Ecosystems
Referring to a review of existing indicator compositions, this paper establishes an index system for the health evaluation of urban ecosystems from three aspects: innovation resources, the innovation environment and innovation vitality.
Indicators of innovative resources, reflecting static resource allocation, are established from innovation subjects and innovation funding. The former involves the main producers of innovative technologies and knowledge, namely, the number of universities and R&D institutions, and the applicators of innovation results, namely, the number of enterprises engaged in high-tech and R&D activities. The latter includes the expenditures of R&D and new product development in large-scale industrial enterprises.
Indicators of the innovation environment include the economic environment, culture and education, and infrastructure. In terms of the urban economic environment, GDP per capita, foreign investment in actual use, the per capita disposable income of urban permanent residents, and the average wages of employed persons in nonprivate units are selected. In terms of urban culture and education, the number of books in public libraries, the average number of students per 10,000 population, and the average number of students per full-time teacher are selected. Concerning urban infrastructure, information-based infrastructure can better promote innovation output and better reflect the concept of smart city construction. Thus, not only traditional transportation facility evaluation indicators, including the road area per capita and the number of public transport vehicles per 10,000 people but also the number of fixed Internet broadband access users and the total number of telecommunication services are selected.
Indicators of innovation vitality, reflecting the flow of elements needed to maintain the efficient stability of the ecosystem, are established from innovation output, innovation performance, social progress and the innovation network. Specifically, the number of patent applications and the total output value of high-tech industries are used to measure innovation output. The number of patents authorized and the sales revenue of new products in large-scale industrial enterprises are used to reflect the application and economic benefits of innovation achievements. The total retail sales of consumer goods, the percentage reduction in energy consumption per unit of GDP and the total volume of imports and exports are used to measure the level of social progress. As a new type of industrial network organization formed by people, an innovation network optimizes resource allocation and improves efficiency through the integration of elements. A number of national incubators and a number of national makerspaces are used to evaluate the construction of urban innovation networks.
Ultimately, a three-level evaluation index system is established based on the principles of scientificity, reliability, representativeness and accessibility (Table 2).
Methodology for Evaluating the Health of Urban Innovation Ecosystems
Steps to Improve the Entropy-DEMATEL Method
The improved entropy value is combined with the DEMATEL method to determine the weight of each indicator, after which the degree of influence and centrality between the indicators are calculated. The specific steps are presented below.
Step 1: Standardize the evaluation indexes. Because different dimensions have diverse impacts on the model, the initial values of the evaluation indicators that affect the health of urban innovation ecosystems should be standardized. Since all the indicators are positive, the following formula is chosen:
where Yij denotes the standardized value of each indicator in the innovation ecosystem for health evaluation of smart cities, with a range of [0,1]; i is the number of years to be evaluated; j is the number of indicators for evaluation; Xij denotes the value of the jth indicator in the ith year; and Xjmax and Xjmin denote the maximum and minimum values of the jth indicator among the years of study, respectively.
Step 2: Calculate the information entropy ej. The time variable is introduced to calculate ej with the following formula:
where ej is the information entropy of each indicator, with ej∈[0,1];
Step 3: Calculate the weight wj. The weight of each indicator can be obtained with the following formula:
Step 4: Construct the direct influence matrix ψ. The matrix ψ reflects the direct impact relationships between indicators and can be obtained with the following formula:
where φnm denotes the importance of the nth evaluation indicator relative to the mth evaluation indicator, with φnm = wn/wm; wn and wm denote the weights of the nth and mth evaluation indicators, respectively; and φss = 0, with s = 28.
Step 5: Calculate the integrated influence matrix η after normalizing matrix ψ and obtaining matrix β. The following formulas are used:
where βij∈[0,1] and E denotes the unit matrix with the same dimension as that of matrix β.
Table 2.
The index system for evaluating the health of innovation ecosystems in smart cities.
Step 6: Calculate the influencing degree Fn, the influenced degree Dn, the degree of centrality Cn and the degree of causality Gn for each evaluation index. Each row in the matrix η is summed to obtain Fn, and each column in the matrix η is summed to obtain Dn. The degree of centrality Cn reflects the comprehensive influence of the factor on the evaluation system. A larger value of Cn implies that the indicator is more important. The degree of causality Gn is used to judge the type of indexes. A degree of causality greater than 0 is categorized as a causal factor; otherwise, it is categorized as a result factor. The formulas used are as follows:
where Fn, Dn, Cn and Gn indicate the influencing degree, influenced degree, centrality degree and causality degree of the nth indicator, respectively, and ηnm and ηmn denote the elements in the integrated impact matrix η.
Steps in the TOPSIS Method for Evaluation
The closeness of the evaluation objects to the positive and negative ideal solutions is calculated with the TOPSIS method, and the results are subsequently ranked to evaluate the level of innovation ecosystem health in Wuhan from 2012 to 2020. The specific steps of the TOPSIS method are as follows:
Step 1: Normalize the initial judgment matrix A. In this step, we identify that the initial judgment matrix A = (aij)nm. The decision matrix Z = {zij} can be obtained after normalizing matrix A. The formula used is as follows:
where aij denotes the value of the jth evaluation index of the ith year.
Step 2: Calculate the positive ideal solution (B+) and the negative ideal solution (B-) of each indicator. The values of B+ and B- can be obtained through the weighted judgment matrix B, which is obtained by multiplying the weight vector W=(w1, w2,…,wn) obtained from the improved entropy-DEMATEL method with the matrix Z. The formulas used are as follows:
Step 3: Calculate the closeness coefficient S. The relative closeness to the positive and negative ideal solutions in each year is calculated with the following formulas:
where DJ+ is the distance from the health status of the innovation ecosystem to the positive ideal solution in the jth year; DJ– is the distance from the health status of the innovation ecosystem to the negative ideal solution in the jth year; and the closeness coefficient Sj∈ [0,1], in which S is closer to 1, indicates a better evaluation.
Results and Discussion
Importance Ranking and Causality Analysis
Based on the DEMATEL method, the weights, influencing degree, influenced degree, degree of centrality, and degree of causality of each indicator are calculated with Eqs. (1)-(10) based on the original data in Table 1. Moreover, the degree of centrality is sorted, and the element types are categorized. The results are shown in Table 3.
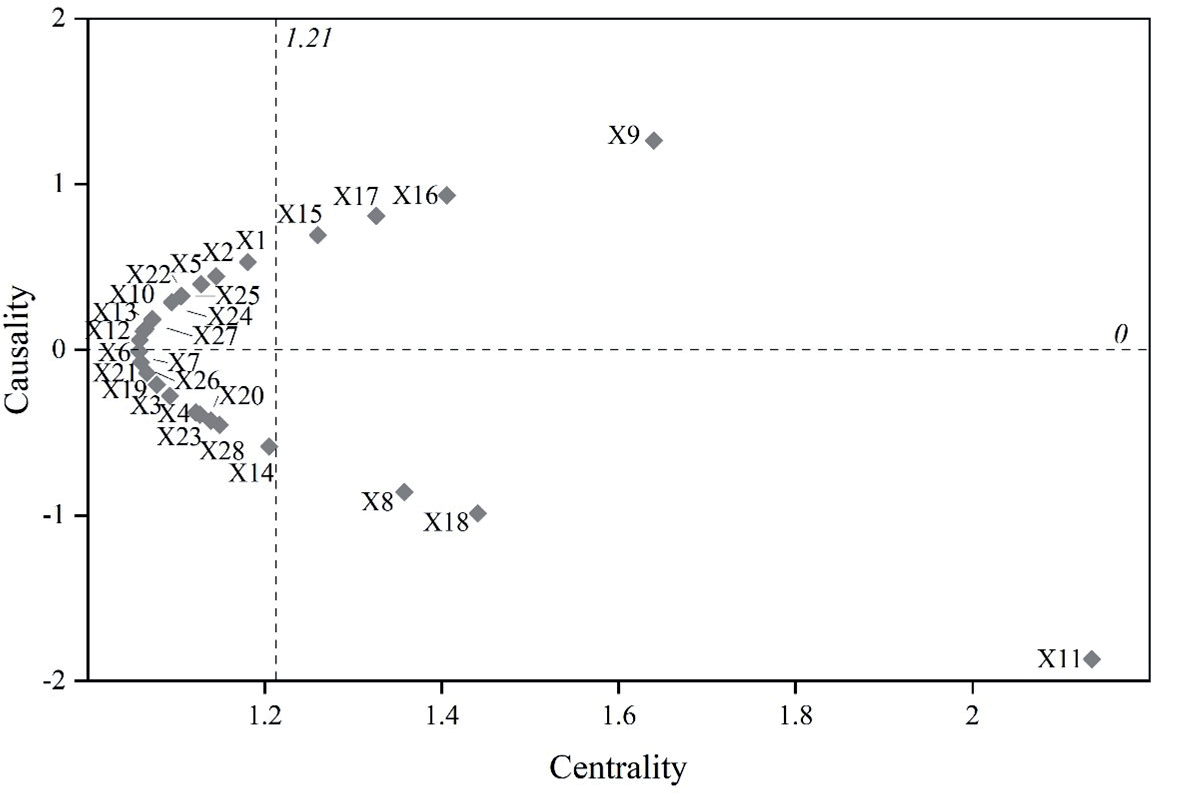
Furthermore, to show the attributes of the indexes more intuitively, the Statistical Product and Service Software Automatically (SPSSAU) tool (which is a website created by Beijing Qingsi Technology Co., Ltd.) is used to determine the degrees of centrality and causality of the indicators in the evaluation system, as shown in Fig. 2. The vertical line with a mean centrality of 1.21 and the horizontal line with causality of 0 divide all the evaluation indicators into four quadrants. When located in the first quadrant, the indicators have high degrees of centrality and causality; i.e., the combined degree of influence of the factors is high and attributed to the causality factor. When located in the second quadrant, the indicators have a low degree of centrality and a high degree of causality; i.e., the combined degree of influence of the factors is low and attributed to the causality factor. When located in the third quadrant, the indicators have low degrees of centrality and causality; i.e., the combined degree of influence of the factors is low and attributed to the causality factor. When located in quadrant 4, the indicators have a high degree of centrality and a low degree of causality; i.e., the factors have a high combined degree of influence and are attributed to the outcome factor.
Table 3.
Degrees of influencing, influenced, centrality and causality of evaluation indicators in the innovation ecosystem.
Based on the above, the following results can be achieved. (1) In terms of the evaluation of centrality degree, the indicators X11 (per capita disposable income of urban permanent residents), X9 (GDP per capita) and X18 (number of public transport vehicles per 10000 people) are among the top three indicators. These findings indicate that these three factors have a significant impact on the health of the innovation ecosystem in Wuhan and that they are the keys to addressing innovative construction. The following are the indicators used: X16 (number of users with fixed Internet broadband access), X8 (expenditure of new product development in large-scale industrial enterprises), X17 (road area per capita), X15 (average number of students per full-time college teacher), X14 (average number of students per 10,000 people) and X1 (number of regular higher educational institutions). Indicators such as X6 (number of R&D institutions), X7 (internal R&D expenditure of the whole society) and X26 (total volume of exports and imports) have small centrality values, which indicates that they have relatively little impact on the healthy development of the innovation ecosystem in Wuhan. (2) In terms of evaluating the degree of causality, factors such as X9, X16, X17 and X15 have a large influence on the other factors. Moreover, indicators such as X6, X12 (average wage of employed persons in nonprivate units) and X13 (number of books in public libraries) have the smallest degree of causality. In contrast, factors such as X11, X18 and X8 are strongly affected by other factors. Moreover, among the resulting factors, X7, X26 and X21 were the least affected by the other factors. In summary, according to the above two aspects of analysis, the centrality and causality of GDP per capita, the number of users with fixed Internet broadband access, and the road area per capita are high and have a large influence on urban health. Therefore, investment in innovation resources and the construction of an innovation environment are effective at improving the health of the innovation ecosystem in Wuhan.
Comprehensive Evaluation of Innovation Ecosystems Based on the DEMATEL-TOPSIS Approach
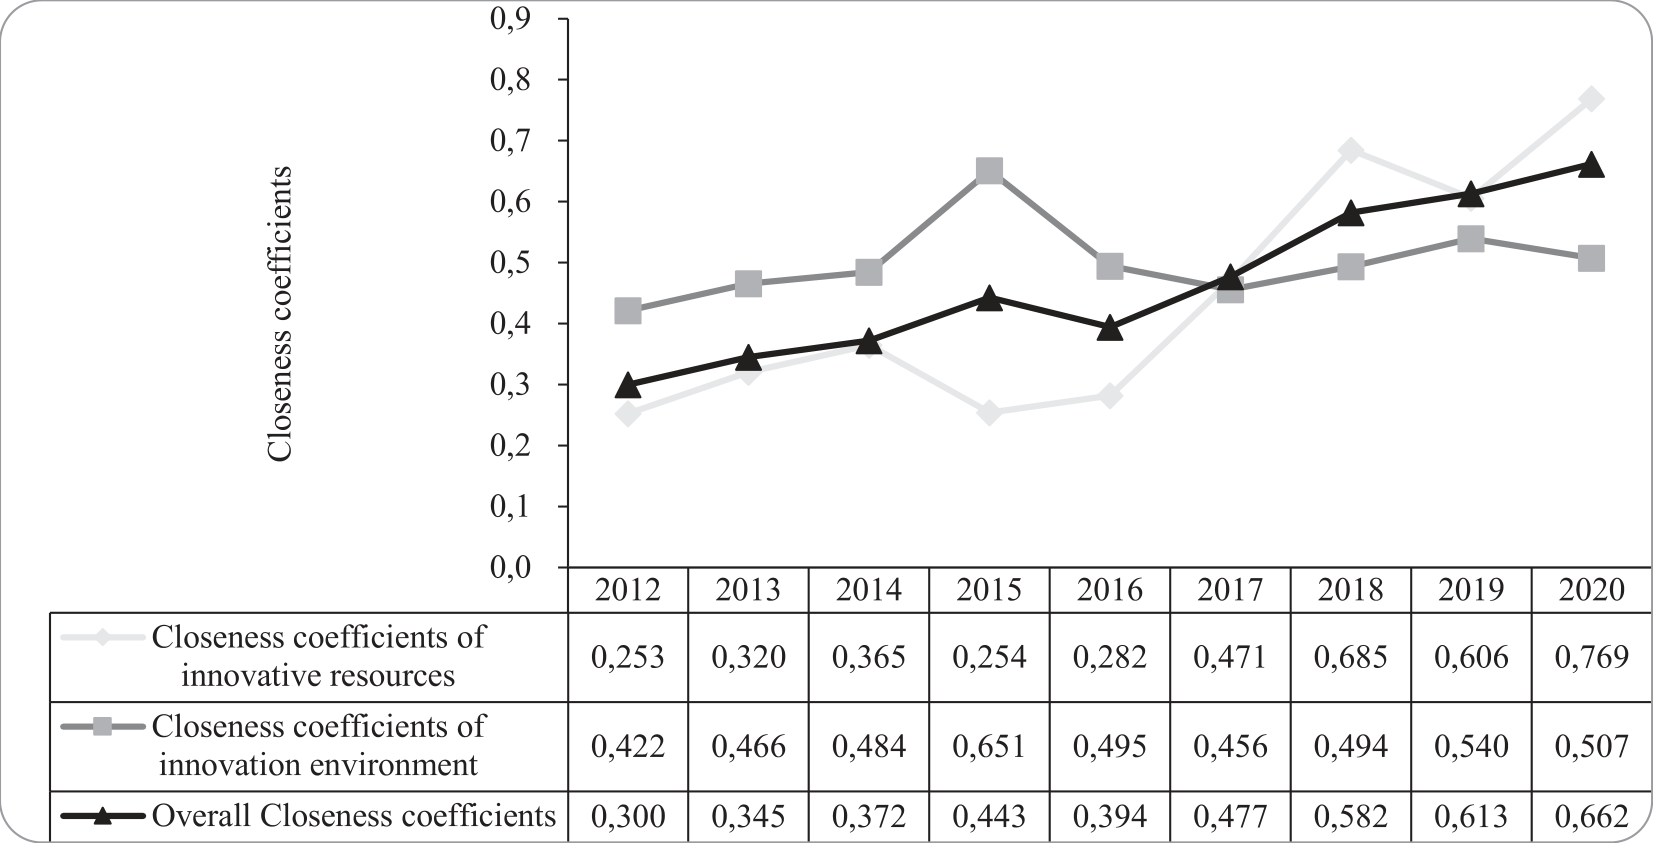
The positive and negative ideal distances, closeness coefficients, and importance rankings of the evaluation indicators are calculated with Eqs. (11)-(16), and the results are shown in Table 4. The overall trend of innovation ecosystem health in Wuhan is upward, and the closeness coefficient increased from 0.300 in 2012 to 0.662 in 2020. The ranking of the closeness coefficient in each year was S2020>S2019>S2018>S2016>S2017>S2015>S2 014>S2013>S2012. S2016 showed a small decline, which was mainly due to the obvious decline in statistics, such as the average number of school students per 10,000 people in the population and the per capita ownership of road space.
Considering the importance of the analysis above, further analysis was carried out to determine the closeness coefficients of the two main types of indicators that affect the health of Wuhan’s innovation ecosystem annually: innovation resource indicators and innovation environment indicators. A scatterplot was drawn (Fig. 3). Specifically, as shown in Fig. 3, (1) for innovation resources, the closeness coefficient in 2018 was 0.685 and further increased to 0.769 in 2020. On the one hand, from the perspective of the application of innovation results, various indicators show obvious growth. Representative indicators, such as expenditures on new product development by large-scale industrial enterprises, increased from 1.461 billion yuan in 2012 to 27.691 billion yuan in 2020. Moreover, this indicator exhibited a consistently high degree of centrality, and its integrated influence in assessing systemic importance was relatively large. On the other hand, from the perspective of the type of innovation producers, the number of colleges and universities and the number of students in Wuhan have always been at the forefront in China. Moreover, the number of full-time teachers in ordinary colleges and universities rose from 55,016 in 2012 to 61,599 in 2020, indicating steady year-on-year growth in the level of resource allocation for innovation.
(2) Regarding the innovation environment, the closeness coefficient fluctuates approximately 0.5, indicating a state of stability and slight growth. The reason is reflected primarily in the indicators with significant comprehensive impacts. By extension, (a) the per capita disposable income of permanent urban residents roughly doubled that of 2012 in 2020; (b) the changes in indicators, such as the road area per capita and number of public transport vehicles per 10000 people, which can be seen as elements of the infrastructure environment, in the past decade were relatively small; and (c) the average number of students per 10,000 people experienced an overall decline due to an insufficient amount of education investment to meet population growth.
Table 4.
Health level of Wuhan’s innovation ecosystem from 2012-2020.
The above analysis reveals that the health status of innovation resources significantly increases, while that of the innovation environment does not significantly improve. However, from a general view, in recent years, the health status of the innovation ecosystem in Wuhan has shown an upward trend due to the combined influence of innovation resources and the environment. Therefore, the smart construction of Wuhan should prioritize the development of an innovation environment, especially in terms of the economy, education and infrastructure, which have a particular focus on indicators with a significant influence. Simultaneously, the synergistic development of innovation resources and the innovation environment also enhanced the health and sustainability of the innovation ecosystem in Wuhan.
Discussion
The above results yield the key influencing factors on the development of Wuhan’s innovation ecosystem and indicate the lagging innovation environment. These findings assist the government to rationally allocate innovation resources and to explore characteristic paths toward achieving high-level smart city construction. Thus the following policy recommendations are proposed to improve the innovation ecosystem in Wuhan.
First, it is crucial to optimize the urban innovation environment. Wuhan has a concentration of innovation resources and innovation foundations with large population appeals and numerous colleges and universities. It is imperative to prioritize the urban innovation environment and infrastructure construction for sustainability. Simultaneously, the upgrading of urban network infrastructures facilitates the integration of intelligent systems into digital urban governance and service. The establishment of innovation entities such as incubators and the makerspaces of entrepreneurial mentors also helps optimize the urban innovation atmosphere.
Second, it is necessary to enhance endogenous dynamics to optimize innovation ecosystems. Ecosystems rely on diversity, symbiosis, and synergy, with endogenous dynamics that shape their development and evolution. As endogenous power stems from emerging and intelligent industries and urban innovation organizations, collaboration among universities, institutions, and high-tech enterprises offers basic advantages for Wuhan. This advantage is particularly valid in industrial gradient transfer and technology R&D collaboration, as industry-university-research cooperation helps rapidly transfer knowledge resources into innovative industrial resources in cities.
Third, it is essential to establish an innovation system characterized by high-level interaction. The innovation system in Wuhan is in the phase of integrating traditional industries with scientific and technological R&D. Interaction among innovation resources facilitates the convergence of high-end service industries, such as the knowledge-based service industry, with high-tech and media technologies to achieve intelligence. Therefore, the construction of innovation network organizations that prioritize new media, high-end services, and financial technologies is encouraged.
Fourth, it is essential to cultivate and retain innovative talent. Although Wuhan attracts substantial numbers of scholars annually, it faces the problem of the outflow of talent. Government-led policies and systems should actively foster the development of diverse innovations. Measures including innovation subsidies, innovation and entrepreneurship services and tax incentives promote the cultivation and capacity of innovative individuals. Policies including the settlement system and housing purchase system aid in retaining innovative talent. Additionally, a favorable atmosphere and infrastructure environment attract and nurture innovative talent.
Conclusions
In this paper, an index system and a method to evaluate the health of innovation ecosystems in smart cities is proposed. Three categories of factors are accounted for: resources, the environment and vitality. The combined DEMATEL-TOPSIS method was adopted to assess the health status of the innovation ecosystem in Wuhan from 2012-2020, and the key impact indicators were analyzed. The findings indicate that the health status of Wuhan’s innovation ecosystem is relatively good and has exhibited a consistent upward trend from 2012 to 2020. The key factors affecting the health of urban innovation ecosystems are per capita GDP, the number of users with fixed Internet broadband access, and road area per capita. Additionally, suggestions are provided to support the health development of the urban innovation ecosystem through significantly driving information innovation technologies. This study broadens the evaluation scope of traditional innovation ecosystems by taking a smart city as the research object and serves as a valuable supplement to the assessment of urban ecosystem health. In future studies, the types of indicators selected could be more diversified, and comparative studies among smart cities will be necessary.

