

Introduction
China, as the largest developing country in the world, has experienced rapid socio-economic development in recent years but faces severe air pollution challenges [1-3]. Air pollution not only affects public health and quality of life but also hinders sustainable socio-economic development [4-6]. According to statistics from the World Health Organization, nearly 7 million people worldwide die each year from diseases related to air pollution [7]. Among them, China is one of the countries with the highest number of deaths caused by outdoor air pollution, with approximately 2 million deaths annually attributed to air pollution [8]. Furthermore, air pollution leads to a series of environmental issues, including reduced crop yields, ecosystem degradation, and climate change [9-11]. As a result, controlling and mitigating air pollution to improve air quality has become a common goal and an urgent task for both the Chinese government and society [12].
This study focuses on 35 cities in the three northeastern provinces of China (Heilongjiang, Jilin, and Liaoning), analyzing and evaluating the changes in their air quality from January 2015 to March 2024 and forecasting air quality trends from April 2024 to April 2025. The goal is to scientifically assess the effectiveness of air pollution control measures and provide corresponding policy recommendations. The Northeast region, historically known as China’s old industrial base, is also one of the most important industrial areas in the world. Its industrial history dates back to the late Qing Dynasty when Japan established the puppet state of Manchukuo, utilizing the region’s rich resources and favorable geography to develop heavy industries such as steel, coal, machinery, and chemicals, making Northeast China one of the major industrial centers in Asia [13]. After the founding of the People’s Republic of China, the Northeast continued to provide the country with a vast amount of industrial goods and energy, earning it the title of “the eldest son of the Republic.” The industrialization level in the Northeast once led the nation and even surpassed that of many developed countries.
However, with advancements in technology and changes in market dynamics, old industrial bases around the world, including Northeast China (along with the Rust Belt in the United States, the Black Country in the United Kingdom, the Ruhr Area in Germany, and the Kanto region in Japan), have faced numerous challenges and difficulties [14]. On one hand, overexploitation and pollution have severely damaged the resources and environment of these regions, leading to ecological degradation and social issues. On the other hand, intensifying competition and shifting demand have diminished the traditional industries’ competitive advantages, resulting in overcapacity and declining profitability, which has caused economic downturns and unemployment [15, 16]. Thus, these old industrial bases require transformation and upgrading by adjusting industrial structures and reducing environmental pollution to achieve sustainable development.
Among these iconic old industrial regions, Northeast China stands out due to several unique factors. Firstly, compared to southern China, the Northeast’s heavy industry has been developing for a longer period, especially during the early years of the People’s Republic, when it was a key focus of national industrial development. This prolonged and intensive development has resulted in significant environmental pollution and damage [17, 18]. Secondly, Northeast China is a major resource base for the country, with extensive coal mining, oil extraction, and steel production. While these industries provided substantial resources for national construction during the early years, rapid industrialization and urbanization have led to severe air pollution in the region [19, 20]. Lastly, situated in northern China, the Northeast experiences a temperate continental climate with limited monsoonal influence. The annual average precipitation is around 500 mm, and the region endures longer and colder winters compared to other parts of the country. The extended heating season, coupled with low precipitation and a coal-dominated energy structure, exacerbates the challenges of air pollution control in Northeast China [21].
Since 2013, many parts of China have experienced severe smog problems. In response, the State Council issued the “Air Pollution Prevention and Control Action Plan”, which called for comprehensive governance efforts and an improved energy utilization structure [22]. Although there has been some improvement in air quality assessments in the three northeastern provinces, large-scale haze events continued to occur in Jilin and Heilongjiang after 2020 [23]. In the air quality rankings of 168 key cities published by China’s Ministry of Ecology and Environment, cities like Shenyang, Huludao, and Harbin consistently ranked among the bottom 20 [24].
In the existing literature, scholars have also explored the air quality issues in Northeast China. The current research primarily focuses on the following aspects:
First, the temporal and spatial distribution of air pollutants. A number of studies have analyzed the spatial and temporal distribution characteristics of air pollution in Northeast China using monitoring data. For example, Fang et al. investigated PM2.5 pollution in Northeast China from 2016 to 2020, analyzing its spatial distribution and transmission patterns. They found that PM2.5 pollution decreased significantly by 2018 but rebounded slightly by 2020 [25]. By analyzing data from 2013 to 2017, Chen et al. have explored the spatiotemporal distribution of air quality and the causes of severe pollution. Their findings indicate that the “Shenyang-Changchun-Harbin” urban belt suffers from the worst air pollution, especially in winter [26]. Focusing on PM2.5 and ozone concentrations from 2015 to 2020, Fan et al. studied the long-term air pollution trends in China. They have identified significant seasonal and regional variations, with northern China experiencing higher pollution levels during winter due to heating and industrial activities [27]. Du et al. have investigated air pollution transmission networks in northeastern China. They argued that air pollution in this area, with PM2.5 being a major contributor, spreads through a complex network with seasonal variations [28].
Second, source apportionment. Some studies have utilized source apportionment techniques to identify the major sources of pollution in the region. For example, Sun et al. studied ammonia and ammonium pollution in urban Harbin, showing that ammonium concentrations spike during the heating season, driven by biomass burning, while vehicle emissions dominate in the non-heating season [29]. Dong et al. have analyzed the chemical composition of PM2.5 and PM10 in a specific city in Northeastern China. They found that secondary aerosols were the largest source of PM [30]. Moreover, Ding et al. examined the seasonal characteristics of BC (black carbon), CO, and PM2.5 pollution during haze episodes in Benxi City, Northeastern China. They found that solid fuel contributions increased during haze events across all seasons. While BC wet scavenging rates were higher in long-range air masses, substantial BC transport persisted due to limited precipitation [31]. Wang et al. have examined the effects of COVID-19 lockdown measures on PM2.5 levels and their chemical components in Shenyang during January to May 2020. They identified six primary pollution sources, of which secondary sulfate and vehicle emissions were the two largest contributors to PM2.5 [32].
Lastly, the effectiveness of control measures and policies. Researchers have also evaluated the effectiveness of various pollution control measures and policies. For example, Yang et al. have examined the significant role of open-field biomass burning in contributing to PM2.5 levels during post-harvest seasons in Northeastern China. They have demonstrated the effectiveness of a 2018 burning ban, which reduced PM2.5 concentrations by up to 67% in some provinces, highlighting the impact of fire emissions on regional air quality [33]. Zhang et al. studied the impact of environmental regulations on haze pollution in China between 2006 and 2016. They found that command-control and economic-incentive regulations have nonlinear effects on haze, while voluntary regulations are not statistically significant. Specifically, the industrial structure coefficient is positive and significant in Northeast China, suggesting that the dominance of the secondary industry significantly contributes to increased haze pollution [34]. Based on the implementation of the Air Pollution Prevention and Control Action Plan (APPCAP) in 2013, Zhao et al. examined the improvements in air quality across China. They discovered noticeable pollutant reductions in Northeast China, particularly for PM2.5. Although the success of APPCAP in reducing particulate matter highlights the effectiveness of China’s air pollution control policies, coordinated efforts targeting both PM2.5 and O3 are increasingly necessary to address evolving air quality challenges [35].
While previous studies have provided valuable insights into air quality trends and pollutant sources in Northeast China, several key gaps remain. First, much of the existing research has focused on individual pollutants or short-term temporal analysis, overlooking comprehensive evaluations of multiple pollutants using integrated forecasting models. Second, few studies have assessed the effectiveness of air pollution control policies across multiple pollutants over an extended period. Moreover, seasonal and regional variations in air quality, especially during the winter heating season, are often underexplored. In light of these gaps, this paper builds upon the existing research and further investigates the air quality in the three northeastern provinces by using six major pollutants (PM2.5, PM10, SO2, NO2, O3, and CO) according to China’s official Air Quality Index (AQI) regulations [36, 37] and existing research [38, 39], to provide a holistic assessment of air quality and its forecasted trends, aiming to make the following marginal contributions:
First, this paper makes several significant contributions to both policy and academic discourse. It provides a systematic evaluation of the air quality in an under-researched region of China that is critical to the country’s industrial and energy sectors. The findings offer insights into the effectiveness of existing air pollution control policies and their long-term impacts, which can inform future policymaking. Furthermore, by focusing on multiple pollutants and applying advanced forecasting models, this study presents a robust framework that other scholars can use to assess air quality in similar industrialized regions.
Second, the novelty of this paper lies in its methodological approach. We optimize the traditional TOPSIS method by incorporating Set Pair Analysis (SPA) to improve the accuracy of air quality assessments. Additionally, the application of the Prophet model for forecasting represents an innovative approach to handling missing data and predicting future trends based on historical patterns [40]. This combination of methods allows for more precise and reliable evaluations, making this study one of the first to apply such advanced techniques to the specific context of Northeast China.
Lastly, although China has introduced several national-level policies targeting air pollution, such as the Air Pollution Prevention and Control Action Plan (2013), there remains a policy void in addressing the unique challenges faced by Northeast China. The region’s heavy reliance on coal for winter heating and its outdated industrial infrastructure make it particularly vulnerable to air pollution spikes during the winter months. This paper highlights the need for region-specific policies that address these unique factors, such as promoting cleaner energy alternatives and strengthening seasonal pollution control measures.
The structure of the remaining sections is as follows: Section 2, Materials and Methods, introduces the data used in this paper and constructs the Set Pair Analysis-TOPSIS evaluation model and the Prophet forecasting model; Section 3 presents the air quality evaluation results for 35 cities in Northeast China from January 2015 to March 2024, along with the forecast of air quality for these cities from April 2024 to April 2025 based on the aforementioned data and models. Then, these results are discussed in the context of air pollution control policies implemented in the Northeast region during the study period, analyzing the actual effectiveness of these policies. Section 4 concludes the paper and outlines directions for future research.
Materials and Methods
This paper improves upon the traditional air quality evaluation system by selecting six pollutant indicators – monthly averages of PM2.5, PM10, SO2, NO2, O3, and CO – as the metrics for evaluating urban air quality. The Technique for Order Preference by Similarity to Ideal Solution (TOPSIS) method was enhanced using the Set Pair Analysis approach [41, 42], where the connection vector distance replaces the Euclidean distance traditionally used in TOPSIS [43, 44]. This allows for the calculation of the proximity of each sample to the ideal solution, which serves as the evaluation value for air quality. Subsequently, the Prophet model was employed to forecast the air quality of 35 cities in Northeast China, providing a depiction of air quality conditions over the next year based on current trends.
Original Sample Data
This paper selects the monthly average values of six pollutants as the basis for evaluating urban air quality. The number of samples in the evaluation model is denoted as n, and the value of the jth indicator for the ith sample is represented as eij(i = 1, 2, ..., n; j = 1, 2, ..., 6). The specific meanings of each indicator are shown in the Table 1.
Set Pair Analysis-TOPSIS Method (SPA-TOPSIS)
The Technique for Order Preference by Similarity to Ideal Solution (TOPSIS) is a multi-criteria decision-making method used for sample evaluation based on multiple features. In this paper, we apply this method to evaluate the air quality of 35 cities in Northeast China. The evaluation involves six sample indicators. For each indicator, the optimal and worst values from the sample are selected, and the ideal solution is constructed from the optimal values, while the worst values are used to construct a negative ideal solution. Due to the limitations of Euclidean distance in traditional TOPSIS [45, 46], which cannot fully reflect the positional relationships between solutions, there is a possibility that a solution might be close to both the ideal and the negative ideal solutions. To address this, we optimize TOPSIS using the Set Pair Analysis (SPA) approach. Each sample is paired with the ideal and negative ideal solutions, and the relationships between them are transformed into “identity”, “difference”, and “opposition” relationships. This results in a connection vector representing the relationship from which the connection vector distance is calculated. This replaces the Euclidean distance and effectively resolves the aforementioned problem. For each sample, we calculate its connection vector distance from both the ideal and negative ideal solutions. The closer the sample is to the ideal solution and the farther it is from the negative ideal solution, the higher its evaluation score.
Step 1: Compute the Mean Value of Each Indicator
For each indicator j, calculate the sample mean and construct the vector Xj = {x1j, x2j, …, xnj}, where xij is calculated as shown in Equation (1):
Step 2: Calculate Cosine Similarity
Calculate the cosine similarity between Xj and the vector Ej = {e1j, e2j, …, enj} as CSj(j = 1, 2, ..., 6) using Equation (2), and then normalize CSj according to Equation (3) to obtain the weights for the six indicators Wj(j = 1, 2, ..., 6):
where Xj ∙ Ej represents the inner product of the vectors.
Step 3: Determine Ideal and Negative Ideal Solutions
Based on the data eij(i = 1, 2, ..., n; j = 1, 2, ..., 6), determine the ideal solution S+ = {s1+, s2+, …, s6+} and the negative ideal solution S– = {s1–, s2–, …, s6–}, where:
Pollutant indicators are negative factors, meaning that higher values are detrimental to the evaluation. According to SPA theory, the ideal solution S+ and the negative ideal solution S– are considered to be in opposition to the system.
Table 1.
Meaning of Indicators in the Original Data.
Step 4: Calculate the Connection Degree μ+ between Sample Ai and Ideal Solution S+
The sample Ai and ideal solution S+ form a set pair H+ = (Ai, S+). The connection degree μ+ is calculated using Equations (6) and (7):
Where ai+ represents the identity degree, bi+ represents the difference degree, and ci+ represents the opposition degree between sample Ai and the ideal solution S+. The vector (ai+, bi+, ci+) is the connection vector for Ai and S+, denoted as μi+ = (ai+, bi+, ci+). When eij = sj–, aij+ = bi+ = 0, and cij+ = 1; when eij ∈ [sj+, sj–),
Step 5: Calculate the Connection Degree μi– between Sample Ai and Negative Ideal Solution S–
The sample Ai and negative ideal solution S– form a set pair H– = (Ai, S–), and the connection degree μi– is calculated using Equations (8) and (9):
Here, ai– represents the identity degree between scheme Ai and the negative ideal solution S–, bi– represents the difference degree, and ci– represents the opposition degree. Together, these form the connection vector (ai–, bi–, ci–) between scheme Ai and the negative ideal solution S–, denoted as μi– = (ai–, bi–, ci–). When eij = sj+, aij– = bi– = 0 and cij– = 1; when eij ∈ (sj–, sj+],
Step 6: Calculate the Connection Vector Distance between Sample Ai and Ideal Solution S+
The connection vector for the ideal solution S+ is μ+ = (1,0,0), and the corresponding connection vector for sample Ai is μi+ = (ai+, bi+, ci+). The connection vector distance between Ai and S+ is calculated using Equation (10):
Step 7: Calculate the Connection Vector Distance between Sample Ai and Negative Ideal Solution S–
The connection vector for the negative ideal solution S– is μ– = (1,0,0), and the corresponding connection vector for sample Ai is μi– = (ai–, bi–, ci–). The connection vector distance between Ai and S– is calculated using equation (11):
Step 8: Calculate the Relative Closeness Ci+ between Sample Ai and Ideal Solution S+
The relative closeness Ci+ is calculated using Equation (12):
Here, Ci+ is the evaluation value of the sample, where 0<Ci+<1. The closer Ci+ is to 1, the closer sample Ai is to the ideal solution and the higher its evaluation value. In practical applications, Ci+ = 1 is rarely observed.
Prophet Model
Prophet is a time series forecasting model developed by Meta (formerly the Facebook company), designed to analyze various time series features, such as long-term trends, seasonal cycles, and holiday effects. It processes effective data and performs forecasting by fitting the analyzed features. The main advantage of the Prophet model lies in its robust performance in handling missing values, trend shifts, and outliers, making it suitable for robust forecasting [47]. In this paper, the daily average values of six air pollutants from January 2015 to March 2024 were preprocessed to form the time series p(t), and the Prophet model was then used to predict future data. The structure of the Prophet model is shown in Equation (13):
Where g(t) represents the trend component, which fits the trend variations of the time series; s(t) is the seasonal or cyclical component, fitting periodic variations (usually on a weekly or yearly basis); h(t) accounts for the impact of holidays on the time series; and εt is the error term, representing factors not considered by the model.
The trend component g(t) is the core of the Prophet model, incorporating different assumptions and smoothness parameters to fit the non-periodic changes in the time series. The model selects change points from the data to detect trend shifts. There are two key functions for the trend: one based on a logistic regression function and the other based on a piecewise linear function. In this paper, the piecewise linear function is adopted, and its calculation is shown in equation (14):
Where r represents the base growth rate, and m is the base offset parameter. Change points are introduced into the model to account for trend shifts, and both the growth rate and offset parameter change at these points. Suppose there are Q change points, distributed at time points t = qy (y = 1, …, Q). δ = {δ1, δ2, …, δQ} is the vector of growth rate changes, where δy represents the change in the growth rate at the change point t = δy. Therefore, the growth rate at time t is the base growth rate plus all changes, i.e., r + ∑y:t>qy)δy. The vector d(t) ∈ {0,1}Q is defined as:
Thus, the growth rate at time t can be expressed as r + d(t)Tδ. While the growth rate changes, the offset parameter must also be adjusted to ensure the continuity of the function. γ = {γ1, γ2, …, γQ} is the vector of offset parameter changes, where γj = –qy × δy. Change points can be manually specified or automatically selected. In this paper, the automatic selection of change points is achieved by setting a sparse prior on δ, δy ~ Laplace(0,τ), in Equation (14).
In the Prophet model, the seasonal component s(t) is modeled using the Fourier series, as shown in Equation (16):
Where T is the length of the time series period, with T = 365.25 representing an annual cycle and T = 7 representing a weekly cycle. The parameters a1, b1, …, aN, bN are estimated, and increasing the number of terms N can improve the fitting accuracy, though it may also increase the risk of overfitting. Typically, for an annual cycle, N = 10, and for a weekly cycle, N = 3. In this paper, the holiday component h(t) is not considered in the analysis of the time series.
Results and Discussion
This study is based on official air pollutant monitoring data for 35 cities in the three northeastern provinces of China, published by the China National Environmental Monitoring Center and the China Environmental Protection Ministry Data Center, covering the period from January 2015 to March 2024. The dataset includes daily concentration data for six major air pollutants: PM2.5, PM10, SO2, NO2, O3, and CO. Using the daily data, we calculated the monthly average concentrations of these six pollutants for each city during the study period. Based on the official air pollutant statistics and the evaluation method described earlier.
We calculated the air quality assessment scores for each city between January 2015 and March 2024 (for specific evaluation results, please refer to Tables A1 through A10 in the Appendix). On this basis, further predictions were made regarding the air quality of the aforementioned 35 cities for the period from April 2024 to April 2025 (for specific prediction results, please refer to Table A11 in the Appendix).
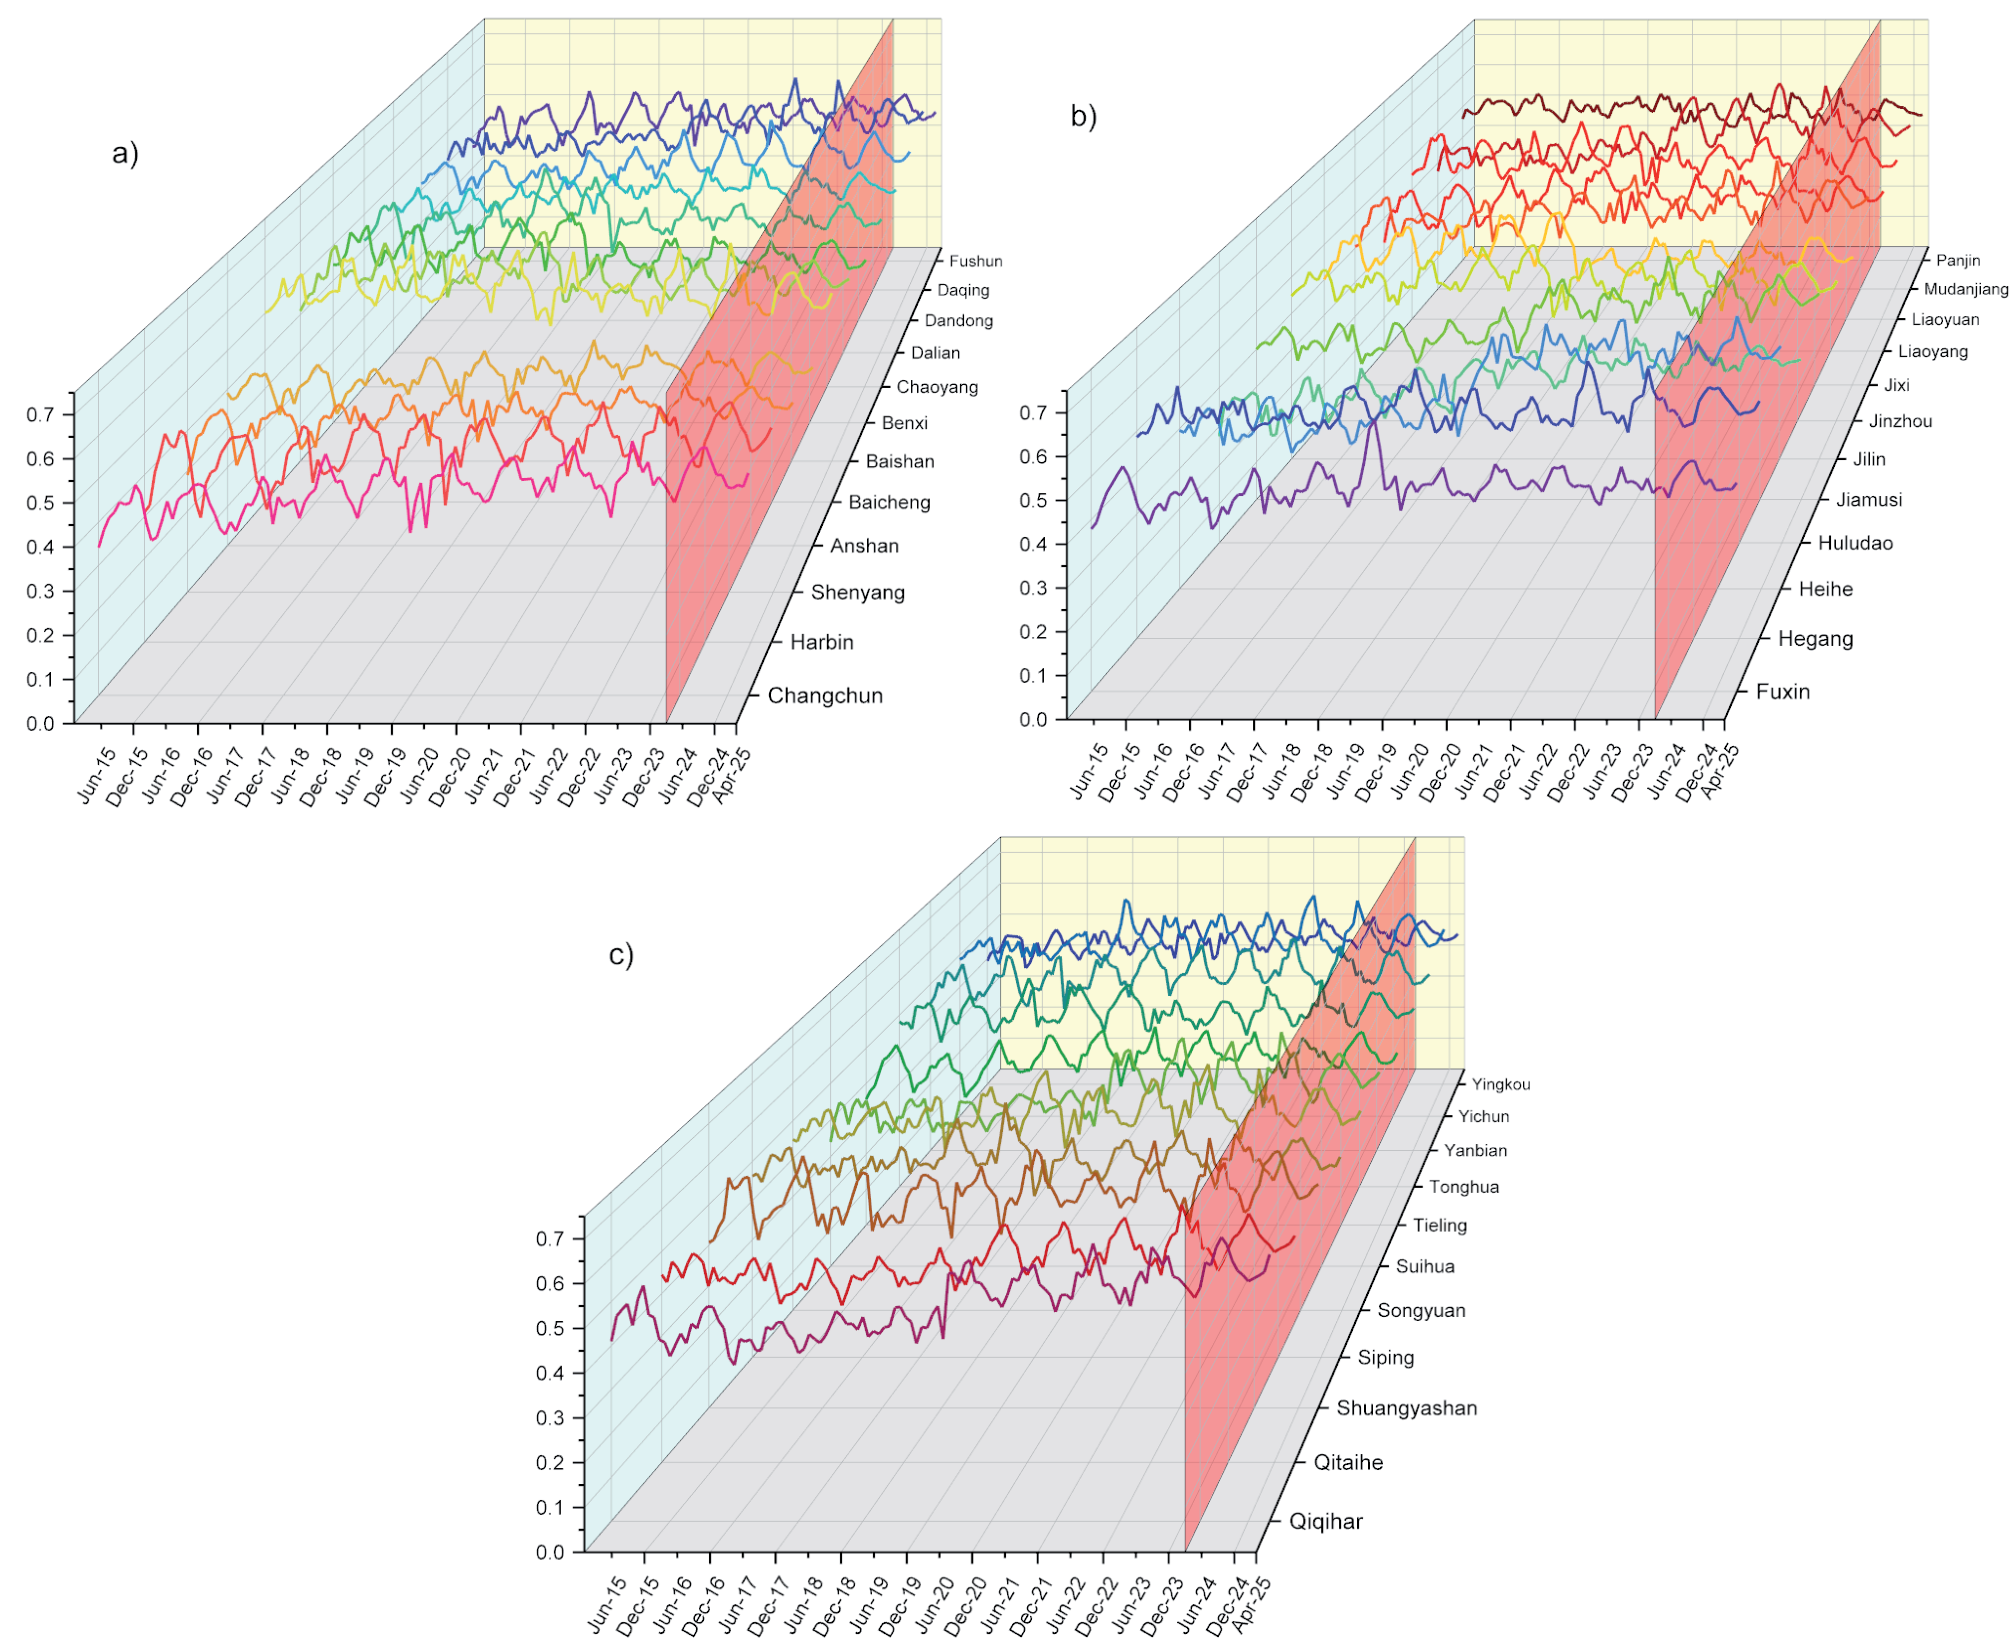
Fig. 1. summarizes the aforementioned air quality assessment scores and predicted air quality values.
Based on the evaluation results, it was found that, after years of comprehensive control efforts, air quality in 32 out of 35 cities improved to varying degrees by the end of the observation period, except for Baicheng, Benxi, and Panjin. Notably, the air quality in the capital cities of the three northeastern provinces showed significant improvement. In Harbin, the air quality index improved from 0.3107 at the beginning of the observation period to 0.4798 at the end, reflecting a 54.43% improvement. Shenyang’s air quality improved from 0.2898 to 0.4380, marking a 51.14% improvement. Although Changchun’s improvement was relatively low, it still reached 40.64%, improving from 0.3408 to 0.4793. For the forecast period from April 2024 to April 2025, air quality across the cities tends to stabilize, with significantly reduced fluctuations compared to previous periods and noticeable improvements in air quality.
Based on the evaluation and forecast results, the study found significant differences in air quality improvement among the cities in the three northeastern provinces, with clear seasonal variations in air quality in the region. Specifically:
Significant Improvements
Most cities in the Northeast region saw significant improvements in air quality. As noted, the capital cities of Harbin, Shenyang, and Changchun exhibited substantial improvements during the observation period. Other cities, such as Huludao (improving from 0.2746 to 0.4422), Suihua (from 0.3394 to 0.5126), and Heihe (from 0.3956 to 0.5806), also showed improvement rates exceeding 45%. According to the forecast data, all cities’ air quality evaluation results remained above 0.4, reflecting a significant improvement compared to the beginning of the study period (January 2015).
In the case of the three capital cities, they were among the most polluted in Northeast China at the beginning of the observation period but had shown clear improvements in air quality by the end. These cities are major economic and industrial centers in their respective provinces, concentrating large populations and industrial resources. According to the seventh national census, the populations of Harbin and Changchun account for more than 30% of their respective provinces, while Shenyang has a population of 9.03 million, representing 21.2% of Liaoning’s total population [48]. In the Northeast, population concentration has increased the demand for winter heating, and coal, as an affordable and accessible energy source, has become the primary heating option. The large-scale burning of coal and relatively outdated treatment technologies have led to a decline in air quality [49]. Additionally, these cities’ secondary industries, particularly high-energy-consuming and highly polluting sectors such as machinery processing, steel, and equipment manufacturing, remain prominent [50]. In the early stages of China’s reform and opening up, the pace of equipment upgrades in these industries was relatively slow, limiting improvements in air pollutant treatment capacity and indirectly contributing to poor air quality.
Fig. 1.
Assessment scores (from January 2015 to March 2024) and forecast results (from April 2024 to April 2025) of air quality for 35 cities in the three northeastern provinces: a) Changchun, Harbin, Shenyang, Anshan, Baicheng, Baishan, Benxi, Chaoyang, Dalian, Dandong, Daqing, and Fushun; b) Fuxin, Hegang, Heihe, Huludao, Jiamusi, Jilin, Jinzhou, Jixi, Liaoyang, Liaoyuan, Mudanjiang, and Panjin; c) Qiqihar, Qitaihe, Shuangyashan, Siping, Songyuan, Suihua, Tieling, Tonghua, Yanbian, Yichun, and Yingkou.
Since 2015, China has significantly increased its focus on environmental quality, and the three northeastern provinces have accelerated efforts to improve air quality. Heilongjiang Province introduced relevant environmental laws in 2016, such as the “Regulations on Air Pollution Prevention and Control in Heilongjiang Province” and the “Heilongjiang Province Special Action Plan for Air Pollution Prevention and Control (2016-2018)”, and these have been continuously revised in subsequent sessions of the People’s Congress based on technological developments [51]. Jilin Province promoted wind power projects and encouraged the use of cleaner, more efficient energy, providing financial and personnel support for targeted pollution control [52]. Liaoning Province established mechanisms for rectifying heavily polluted areas, simultaneously tackling coal, vehicle emissions, and straw burning, adopting targeted measures, and strictly managing industries such as steel and coal power with ultra-low emission transformations, significantly reducing their impact on air quality. Policies like the “Measures for the Evaluation and Reward of the Elimination of Small Coal-Fired Boilers in Liaoning Province” were introduced [53]. Guided by these policies, governments at all levels in the three northeastern provinces have paid increasing attention to air pollution issues and made significant efforts to address them, leading to notable improvements in urban air quality.
Discrepancies in Air Quality Improvements
Beyond the capital cities, Huludao, Suihua, and Heihe also showed significant air quality improvements during the observation period. Huludao improved from 0.2746 to 0.4422, an increase of 61.03%, ranking first among the 35 cities; Suihua and Heihe improved by 51.03% (from 0.3394 to 0.5126) and 46.76% (from 0.3956 to 0.5806), respectively. The reasons for these improvements are due to a series of comprehensive governance measures that have effectively enhanced air quality. These measures include strengthened policies and regulations, optimization of industrial and energy structures, control of industrial and coal pollution, mitigation of vehicle and dust pollution, and scientific responses to severe pollution events. Specifically:
Huludao: The city government placed high priority on air quality, investing in particulate matter and volatile organic compounds (VOCs) monitoring stations to enhance environmental regulation capacity. Several special actions were undertaken, including law enforcement inspections of 281 industrial enterprises, upgrading inefficient pollution control facilities, and regulating VOC emissions. To address air pollution caused by coal heating, the city implemented “small-to-large” heating conversions in major urban areas before each winter, achieving over 95% clean heating and phasing out coal-fired boilers. Additionally, the city aggressively eliminated high-emission vehicles and conducted “city washing” campaigns to tackle dust pollution [54].
Suihua: The city government actively adjusted the industrial structure, enforcing strict environmental access requirements, phasing out outdated capacity, and promoting the upgrading of traditional industrial clusters while fostering green industries. The city also accelerated the consumption of non-fossil energy, strictly controlled total coal consumption, phased out coal-fired boilers, and advanced clean fuel alternatives for industrial furnaces. The government enhanced atmospheric monitoring and established regional joint prevention and control mechanisms, promoting source pollution control, strengthening straw utilization and burning bans, and addressing VOCs through comprehensive treatment measures for key industries [55].
Heihe: The city continued efforts to control coal pollution by upgrading aging heating pipelines and implementing coal-fired boiler transformation projects. The city targeted the Heihe Thermal Power Company for ultra-low emission retrofitting. Dust pollution control was also a key focus, with detailed implementation of dust control measures on construction sites and increased mechanized street cleaning. For vehicle emissions, the city strengthened oversight of vehicle emission testing facilities and conducted roadside inspections and remote sensing monitoring [56].
Conversely, air quality improvements were poor in Baicheng, Benxi, and Panjin, with air quality evaluation scores showing declines compared to the beginning of the observation period. The reasons include unfavorable meteorological conditions in these cities and insufficient efforts to control industrial pollution, vehicle emissions, and dust pollution, leading to a relative deterioration in air quality. Specifically:
Baicheng: Located in a region prone to severe drought, Baicheng frequently experiences spring, summer, and autumn droughts, with uneven seasonal distribution of precipitation, making it difficult for pollutants in the air to effectively disperse or settle. Additionally, Baicheng’s industrial pollution control has been insufficient. Despite efforts by the municipal government, some enterprises continue to exceed emissions standards, particularly in the chemical and metallurgical industries. The city’s significant increase in the number of vehicles during the observation period also contributed to air pollution, with vehicle emissions becoming a major source of pollution. Moreover, insufficient control of dust from construction sites and roads has led to persistently high O3 concentrations [57].
Benxi: The city’s industrial structure has long been dominated by heavy industry, with high-pollution sectors such as steel and chemicals occupying a large proportion of the economy. The difficulty in adjusting the industrial structure, combined with continued reliance on coal as the primary energy source for the secondary industry, has resulted in high emissions of SO2 and NOx [58]. The rapid increase in the number of vehicles and weak enforcement of vehicle emission standards, coupled with frequent occurrences of severe pollution weather and insufficient response measures, have also contributed to the city’s difficulty in dispersing pollutants under unfavorable meteorological conditions.
Panjin: The city is significantly affected by dust storms, which frequently lower air quality. Additionally, Panjin’s petrochemical industry is well-developed, but some enterprises have inadequate pollution control facilities, leading to frequent incidents of emissions exceeding standards. Similar to Baicheng, vehicle emissions and dust pollution are major concerns, with persistently high concentrations of PM2.5 and PM10 in the atmosphere [59].
Significantly Influenced by Seasonal Factors
Based on the evaluation results from January 2015 to March 2024, air quality in these cities typically reaches its best levels in August and September each year, followed by a decline to its lowest point in January and February of the following year. This is primarily due to the widespread heating during the winter months. The heating period in the three northeastern provinces generally lasts from October to April, and in some high-latitude areas, it begins as early as September. During the heating period, large amounts of coal and other fossil fuels are burned, leading to a rapid increase in atmospheric pollutants, which severely impacts air quality. Moreover, after mid-September, rice harvesting begins in this region, and before the government implemented regulations prohibiting in-field burning of straw, residents would often burn large amounts of straw in a short period, causing a sharp rise in particulate matter, further exacerbating local air pollution [60]. Coupled with weaker winds and reduced precipitation during the winter, the large amounts of pollutants produced are not easily dispersed in the short term, making air quality particularly poor in January and February each year.
In contrast, during the summer, the use of coal and fossil fuels in Northeast China decreases significantly. Combined with relatively abundant rainfall and the influence of summer monsoons, the accumulation of particulate matter in the air is greatly reduced [61]. Additionally, higher temperatures and lower atmospheric pressure during the summer promote air circulation, which significantly improves the region’s air quality, typically reaching its best levels in August and September each year.
Concerning Forecast Values
First, the overall air quality in the three northeastern provinces is expected to continue showing clear seasonal fluctuations during the period from April 2024 to April 2025. Air quality in most cities will be relatively better in the spring and summer months (April to September), while it is expected to decline during the autumn and winter months (October to March). This seasonal variation is consistent with the climatic conditions and historical trends previously discussed. For example, in the provincial capital city of Changchun, air quality is predicted to gradually improve from May to August 2024, peaking at 0.5735 in August 2024 before beginning to decline in October, reaching a low of 0.4784 in January 2025. Similar seasonal fluctuations have been observed in cities like Harbin and Shenyang.
Second, according to the overall forecast data, cities located in the northern part of the region, such as Hegang, Qiqihar, and Heihe, are expected to have relatively better air quality. For instance, Hegang and Qiqihar’s average air quality evaluation scores between April 2024 and April 2025 are predicted to be 0.5716 and 0.5869, respectively, while Heihe is expected to have even better air quality, with a score of 0.6810 in August 2024—the highest value among all cities during this period. Geographically, Heihe’s border location, lower population density, minimal industrial activity, and favorable natural environment contribute to its consistently high air quality. In contrast, industrial cities such as Anshan and Benxi are expected to have poorer air quality, with several months during the forecast period showing evaluation scores below 0.45. Their lowest values in December 2024 are expected to hover around 0.44. This indicates that industrial cities in the region may struggle to reduce air pollution in the short term through industrial restructuring, while the use of traditional energy sources like coal for winter heating further exacerbates pollution.
Finally, based on the forecast air quality evaluation data for the upcoming year, the fluctuation in air quality across the three northeastern provinces is expected to be relatively small. This suggests that while there is room for further improvement in air quality, the scope for significant improvement is limited without additional control measures. Therefore, promoting the use of clean energy, strengthening industrial pollution control, and advancing green transportation initiatives could help more cities in the region achieve sustained improvements in air quality.
Conclusions
This study optimizes the traditional TOPSIS method using Set Pair Analysis, establishing a comprehensive evaluation system that includes six major pollutants – PM2.5, PM10, SO2, NO2, O3, and CO – to assess the air pollution status of cities in the three northeastern provinces from January 2015 to March 2024. Additionally, the Prophet model was employed to forecast air quality for the upcoming year. The results indicate that, overall, the air quality in Northeast China has significantly improved during the observation period, particularly in the provincial capital cities of Harbin, Changchun, and Shenyang, where pollutant concentrations have substantially decreased, reflecting the effectiveness of air pollution control policies in these areas. However, there are clear spatial disparities in air quality improvement, and the degree of improvement varies across different provinces and cities. Some cities still face severe air pollution problems during the winter heating period. Based on the above analysis, the following key conclusions are drawn:
First, air quality in the three northeastern provinces showed a trend of improvement amidst fluctuations from 2015 to 2024. This trend is largely attributed to national and local efforts in industrial emission reduction, energy structure optimization, and clean energy substitution in recent years. However, seasonal pollution rebound during the winter heating period remains a prominent issue in many cities, especially in Baicheng, Benxi, and Panjin, where air quality remains poor during this period.
Second, the extent of air quality improvement varies significantly between cities. Provincial capitals such as Harbin, Changchun, and Shenyang have seen more significant progress due to strong policy support, while industrial cities like Anshan and Benxi have experienced more challenges in improving air quality due to their reliance on coal-heavy energy structures and single-industry economies, which make pollution control more difficult. Geographic and climatic factors have also exacerbated pollution issues in these cities, particularly in the winter when pollutants are less likely to disperse.
Lastly, the forecast results from the Prophet model suggest that without further control measures, the scope for air quality improvement over the next year is limited. The concentrations of major air pollutants are expected to remain significantly affected by climatic conditions and the structure of energy consumption. While existing control measures have yielded positive short-term results, achieving sustained air quality improvement will require more systematic and comprehensive strategies.
Based on the findings of this study, the following policy recommendations are proposed:
Optimize Energy Structure: Given the high reliance on coal, especially during the winter heating period, efforts should be intensified to accelerate the shift toward cleaner energy sources. Policies should promote the use of natural gas, geothermal energy, wind, and solar energy, particularly in urban heating systems. Increased financial incentives and subsidies should be provided to encourage both local governments and industries to adopt cleaner technologies, which will reduce pollution levels significantly.
Enhance Regional Cooperation on Pollution Control: Since air pollution in northeastern China has strong regional characteristics, a coordinated joint prevention and control mechanism across the provinces should be implemented. This would include real-time data sharing, joint law enforcement, and coordinated responses to transboundary pollution issues, particularly among neighboring cities. Strengthened monitoring of emissions from key industries is crucial to ensure compliance with national pollution standards.
Upgrade Industrial Pollution Control Technologies: Northeastern China’s industrial base should prioritize technological upgrades in sectors that are major pollution contributors, such as steel, chemicals, and energy. Investing in cleaner, more efficient technologies will help reduce emissions. Additionally, strengthening air quality monitoring through advanced systems will improve the region’s capacity to detect and address pollution issues swiftly and more effectively.
Strengthen Seasonal Pollution Management: Policies should specifically target the winter heating season when coal usage spikes. Increasing investment in retrofitting heating systems and transitioning away from coal toward renewable energy alternatives will mitigate seasonal pollution peaks. Local governments should implement stricter controls on emissions from both industrial and residential sources during this period.
There are still several limitations to consider. First, this paper does not account for the effects of climate change on air quality, which could impact pollution levels. Second, we focus on six major pollutants, excluding others like VOCs, which are becoming increasingly important. Lastly, while the Prophet model provides a short-term forecast, it does not consider potential future policy changes that could alter air quality trends.
Despite these limitations, this paper offers a novel methodological approach using improved TOPSIS, SPA, and the Prophet model, which can be adapted by scholars to assess air quality in other regions. It also identifies gaps in current policies, helping researchers to focus on policy effectiveness and interventions.

