

Introduction
Black soil in cold climates is rich in organic matter and loose, making it ideal for farming. There are three black soil plains in the northern hemisphere of the world: the Mississippi Plain in North America, the Ukrainian Plain in Europe, and the Northeast Plain in Asia. Especially the black soil in Northeast China, commonly known as “granary”. The main crops are soybeans, corn, and rice. The black soil is called “giant panda in cultivated land” (giant panda is China’s national treasure). With the high input of chemical fertilizers and fungicides, the lag of regulations and standards, the low efficiency of monitoring and management, and the weak awareness of people’s environmental protection, potentially toxic elements (PTEs) are released into the soil [1-3]. The problem of Potentially toxic elements in soils has attracted extensive attention from scholars and policymakers at home and abroad [4-6]. Recently, the ecological and health problems of soil Potentially toxic elements pollution have become prominent.
Awake et al. (2021) [7] assessed the health risks of potentially harmful elements in vegetables grown on untreated and treated wastewater irrigated soil in Albaminqi, Ethiopia. Studies have shown that the values of Pb and Cd in waste water irrigated vegetables are greater than unity, which may lead to non-carcinogenic diseases in adults and children under short-term/lifelong exposure. Soghra et al. (2021) [8] investigated a large number of nutrients, potentially harmful elements, and polycyclic aromatic hydrocarbons (PAHs) in agricultural soils and vegetables in Ahvaz metropolis. The calculated potentially harmful element enrichment factors, pollution factors, and ecological risks show that agricultural soils are moderately polluted by Cd and P. Ali et al. (2021); Kianpoor et al. (2021) [9] conducted Potentially toxic elements pollution and health risk assessment on the soil of Khamees-Mushait municipal solid waste dump in Saudi Arabia. The pollution of Co, Ni, Pb, Cu, Cr, Mn, and Zn is serious in different zones of the study area. Tao et al. (2021) [10] studied the geological load and health risk of Potentially toxic elements absorbed by tea from soil. Under an acidic environment for the growth of tea, weathering pedogenic processes were shown to be the primary source for releasing Potentially toxic elements into the soil. More than 75% of soil Cd, Hg, Pb, and Zn exceeded background levels. In spite of this, the amount of Potentially toxic elements in tea samples was below the limits set by China, the WHO, and the EU.
The above studies were conducted in other countries and regions. Although they have a certain guiding role for this study, targeted research is still needed to truly grasp the ecological and health risks of Potentially toxic elements in farmland soil in the black soil region of Northeast China.
Song et al. (2018) [11] took Hailun as an example to research the spatial distribution pattern and influencing factors of Potentially toxic elements in a typical cold black soil area. Liu et al. (2020) [12] conducted a geochemical evaluation of land quality in Changfa Town, Hailun City, and put forward development suggestions. Chen et al. (2015) [13] studied the characteristics of Potentially toxic element contents in farmland soil in Hailun City. Chen et al. (2012) [14] conducted a pollution assessment of Potentially toxic elements in farmland soil in Hailun City. These studies have mainly focused on the geochemical characteristics and spatial distribution patterns of Potentially toxic elements without assessing their ecological and health risks. From the perspective of environmental protection and human health, this work is particularly important.
Materials and Methods
Study Area, Sampling, and Analysis
Helen City is located in the central part of Heilongjiang Province, China (46°58′-47 °52′E, 126°14′- 127°45′N), covering an area of 4551km, with a distance of 150 km from northeast to southwest and 78 km from north to south. Hailun City is located in the middle of Heilongjiang Province, with an area of 4667 km2. It is in the center of the black soil region of northeast China. It belongs to the northern temperate zone with a continental monsoon climate. Winter is cold with a northwest wind, but summer is hot with heavy rainfall. The annual average temperature and precipitation are about 1.5º and 550 mm. The terrain of the area is gently undulating. Soil is formed from the quaternary loess-like parent material. The main soil types in the area are black soil and meadow soil. The main crops are soybeans, maize, and rice. In the last three decades, the consumption of chemical fertilizers was 106275, 122950, and 15680 tons in 2007, 2010, and 2017. The increasing use of chemical fertilizers could affect soil quality.
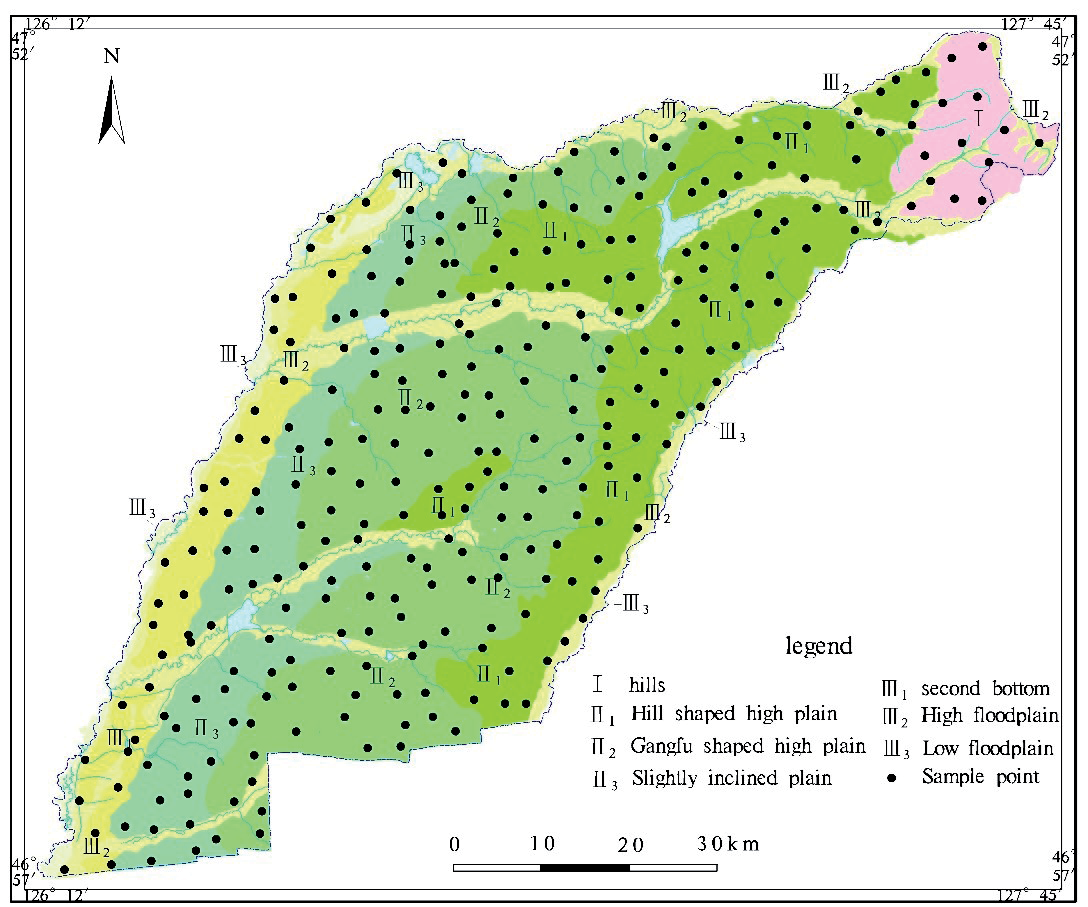
298 surface soil samples were collected in the black soil farming area of Hailun City, and the sample distribution is shown in (Fig. 1).
The sample test is carried out by the Harbin Natural Resources Comprehensive Survey Center in accordance with the relevant technical requirements (CGS, 2005). The accuracy and precision of elemental analysis meet the requirements of the National Geochemistry Survey of Land Quality Project (NGSLQP) (CGS, 2014). The analysis methods and detection limits are shown in the table (Table 1.).
Evaluation Method
The geoaccumulation index method (Igeo) proposed by German scientists is used to evaluate the pollution level of soil for Potentially toxic elements [15]. The background value of soil Potentially toxic elements in soil is calculated from the data of the National Geochemistry Survey of Land Quality Project (NGSLQP). The classification of Potentially toxic elements in pollution is shown in Table 2. [16, 17].
Table 2.
Igeo index level and pollution degree.
The ecological risk of soil Potentially toxic elements in the study area is evaluated by the Hakanson potential ecological hazard index method [18]. The ecological hazard classification of single Potentially Toxic Elements Potential Ecological Hazard Index Eri and total potential for the Potentially Toxic Elements Ecological Hazard Index RI is shown in Table 3. [19-21].
The human health risk of soil Potentially toxic elements is evaluated by the health risk assessment model published by the US EPA [22-24]. The exposure parameters are shown in Table 4. [25-28] Exposure pathway reference measures and carcinogenic slope factors are shown in Table 5. [29-31].
Results and Discussion
Distribution Characteristics of Potentially Toxic Elements in Soil
The contents of Potentially toxic elements in the soil of the study area (Table 6.) are higher than those in the soil of Hailun City, indicating that Potentially toxic elements accumulate in the soil to a certain extent. The range of Cd content is 0.05~1.83 mg/kg, and the average value is 0.13 mg/kg, which is 1.86 times of the background value; The average value of Cr is 63.93 mg/kg, which is 1.51 times of the background value; and Zn, Hg, Ni, Pb, Cu, and As are about 1.10~1.33 times of the background value. On the whole, Cd accumulation in soil is the most obvious effect, followed by Cr, and the order is Cd >Cr> Hg>Cu> Zn>Pb>Ni>As. Based on the coefficient o variation (CV), the value ranges of 0.07-0.77. Hg and Cd, reaching 0.77 and 0.76, are significantly more variable than other elements. The CV of other elements is between 0.07~0.16. In soil, the larger the coefficient of variation, the less even the distribution of elements is.
Table 1.
Analysis method and detection limit (mg·kg-1).
Table 3.
Single and overall potential ecological hazard assessment indicators.
Table 4.
Exposure assessment parameter reference value.
Table 5.
Potentially toxic elements reference measurements and carcinogenic slope. factor.
The pH value of soil ranged from 4.55 to 7.96 in the study area. The distribution characteristics of different Potentially toxic elements are shown in Fig. 2. Cd, As, Cu, Pb, Cr, Ni, Hg, and Zn did not exceed the screening value of the soil pollution risk of agricultural land [32].
Analysis of Potentially Toxic Element Pollution Degree
Taking Helen’s soil background value as the evaluation standard, the geoaccumulation index of soil Potentially toxic elements pollution degree in the study area is evaluated (Table 7.). The average value of the Potentially Toxic Elements Pollution Index from high to low is Cd>Cr>Cu>Zn>Hg>Pb>Ni>As. Cd and Cr are at the light pollution level, and Cu, Zn, Hg, Pb, Ni, and As are at the pollution-free level. However, from the perspective of individual pollution points, soil Cd pollution is the most serious, one point reaches heavy to extremely heavy pollution, there are 4 medium pollution points and 238 light pollution points, accounting for 79.87%; Hg has 1 heavy pollution, 1 medium to heavy pollution point, 5 medium pollution points, and 52 light pollution points, accounting for 17.45%. There are 172 light pollution points in Cr, accounting for 57.72%. There are different amounts of light pollution in Cu, Zn, Pb, Ni, and As.
Table 6.
Statistic values of Potentially toxic elements content in the surface soil of Hailun City.
Potential Ecological Risk Assessment
The risk degree of potential ecological hazards in the soil is evaluated by taking the soil background value of Hailun City as the reference (Table 8). In terms of the ecological risks posed by individual Potentially toxic elements, the risk index of Cd ranges from 19.32 to 751.64, with slight, medium, strong, and extremely strong ecological risks, accounting for 41.28%, 54.7%, 3.69%, and 0.33%, respectively. Risk index of Hg ranges from 21.68 to 655.48, with slight to extremely strong ecological risks, accounting for 20.47%, 72.82%, 5.7%, 0.67%, and 0.33%, respectively. Cr, Ni, Pb, As, Cu, and Zn is a slight ecological risk with the index less than 40. Therefore, Hg and Cd are the primary Potentially toxic elements, and other elements are at a slight level. Hg is the element with the most serious ecological risk.
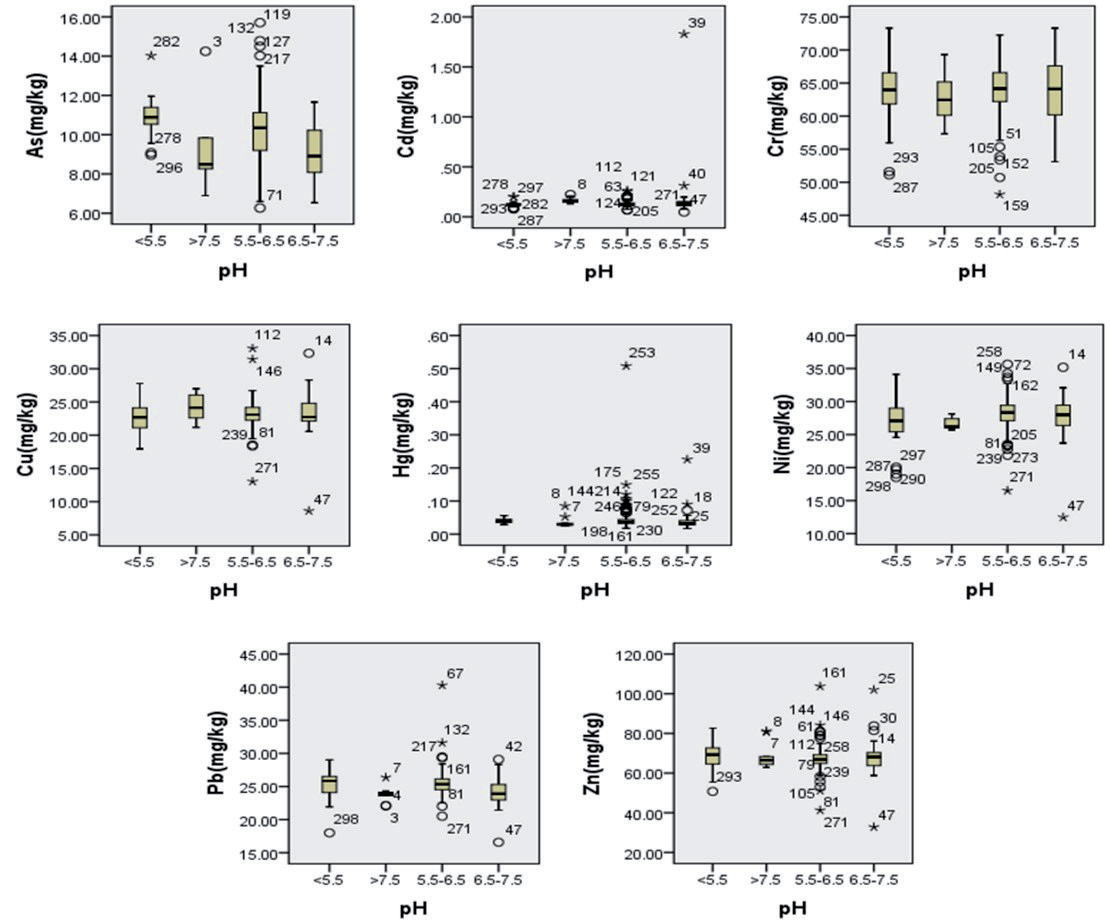
Table 7.
Classification of Potentially toxic elements in soil based on Igeo.
Table 8.
Potential ecological risk coefficient of Potentially toxic elements in soil.
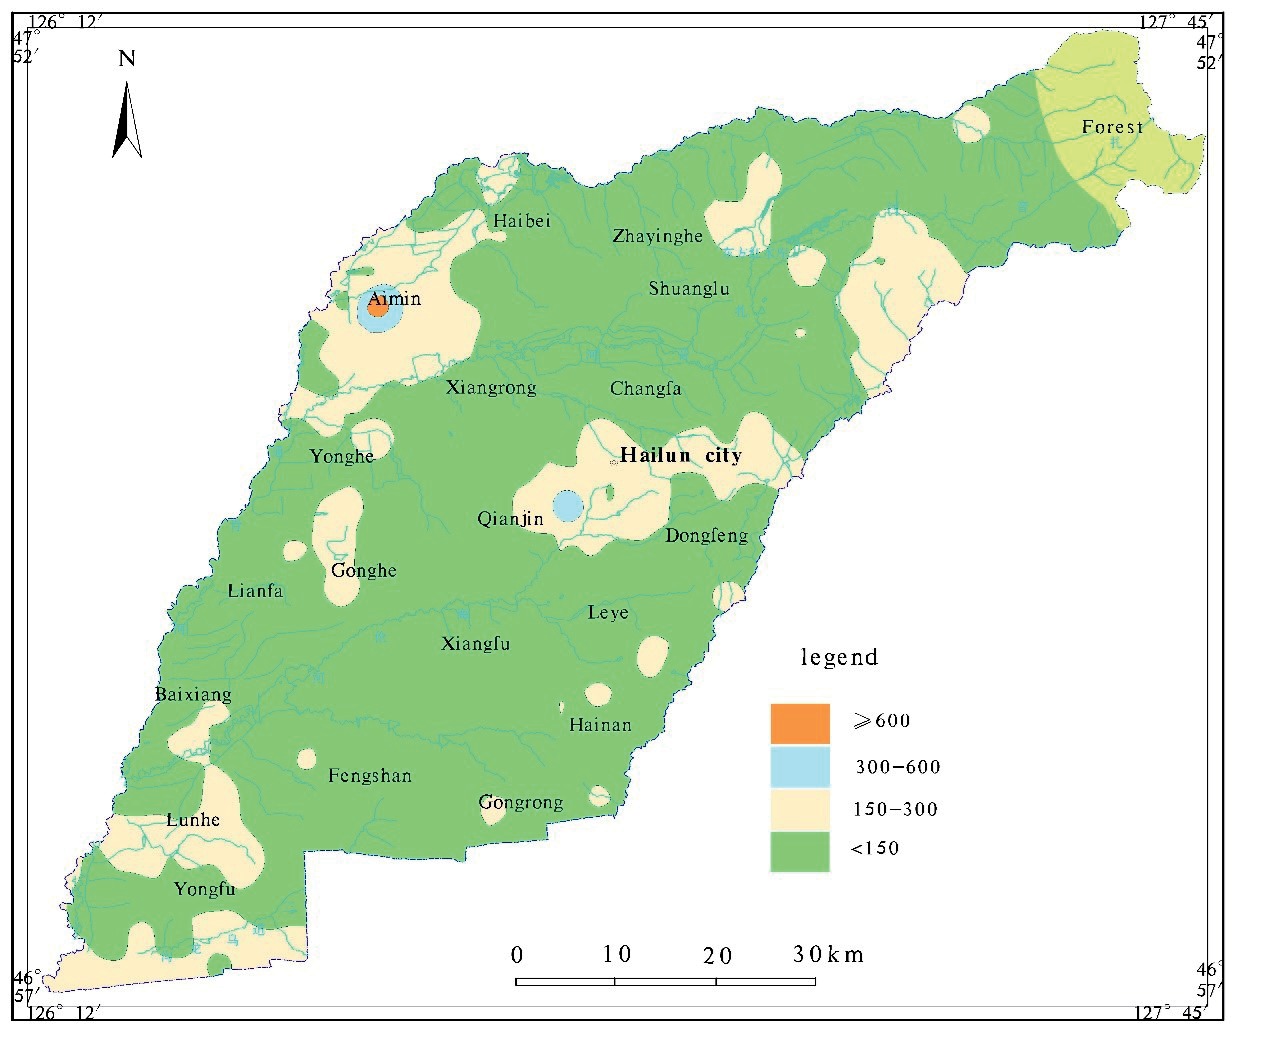
The range of the RI of Potentially toxic elements in Hailun is 61.08~445.75, with slight, medium, and very strong ecological risks accounting for 77.51%, 21.81%, and 0.67% respectively. The spatial pattern of RI (Fig. 3.) shows that Aimin township has the highest ecological risk, and the soil has a strong ecological risk. The investigation found that the animal husbandry in the region is mainly raising pigs, cattle, and sheep, and the soil is polluted by Hg and Cd Potentially toxic elements. There is a medium risk in the east of Qianjin town. In other areas, pigs, cattle, and sheep are not mainly raised. The ecological risk is low and shows a slight intensity.
Human Health Risk Assessment
Potentially Toxic Element Exposure Assessment
The results (Table 9. and Table 10.) show that the average daily exposure to non-carcinogenic elements is as follows: ADDing > ADDderm >ADDinh, in which, oral intake is the main factor. Compared to adults, children’s average daily exposure to oral intake, skin contact, and respiratory inhalation is higher. The order of average daily intake of Potentially toxic elements is Zn>Cr>Ni> Pb>Cu>As>Cd>Hg. The average daily exposure to carcinogenic elements is as follows: ADDing>ADDderm >ADDinh, in which oral intake is the main factor as well. The order of average daily intake of Potentially toxic elements is: Cr>Ni>As>Cd.
Health Risk Assessment
Eight Potentially toxic elements were assessed as non-carcinogenic indexes and four as carcinogenic indexes in the study area. Results are listed in the following tables (Tables 11. and 12.).
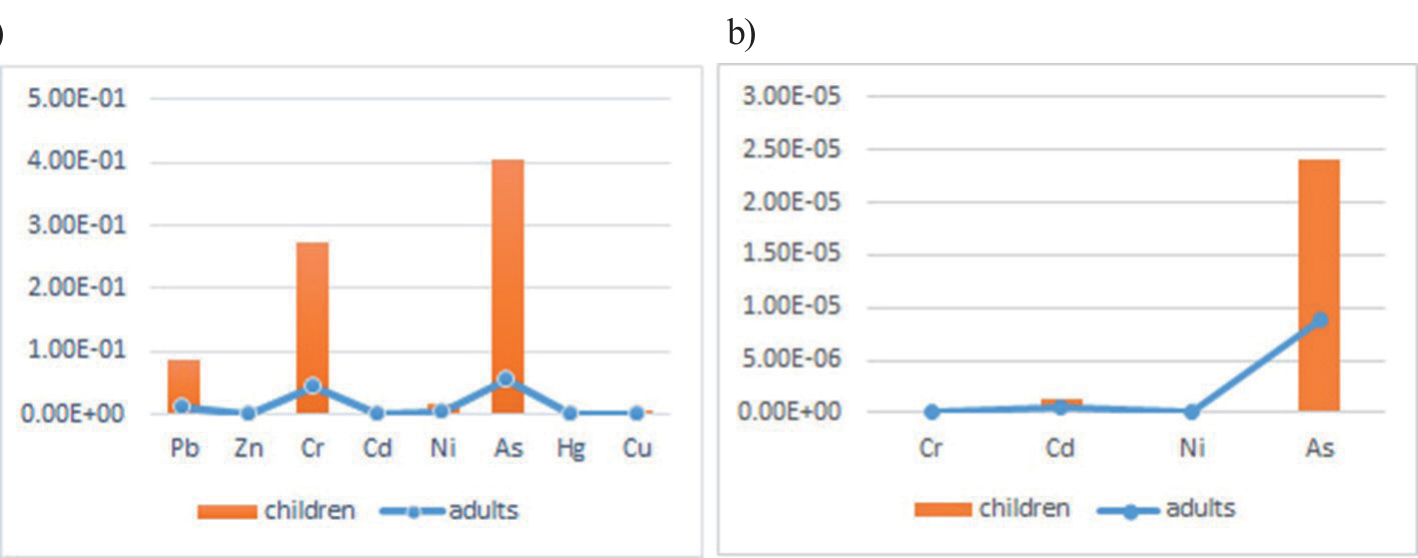
Non-carcinogenic health risk assessment has the following rules: HQing>HQderm>HQinh. Oral intake is the main factor in non-carcinogenic health risks. The non-carcinogenic health risks of Potentially toxic elements are as follows: Cd<Hg<Zn<Cu<Ni<Pb<Cr<As, with the average value of HQ for adults being 0.118 and for children being 0.795; the maximum HQ value for adults is 0.171 and for children is 1.16. According to this study, single Potentially toxic elements have no noncarcinogenic risk to adult health, whereas there is a large noncarcinogenic risk to children, so prevention should be stressed. (Fig. 4, Fig. 5(a)).
The health risk assessment of carcinogenesis has the following rules: CRing>CRderm>CRinh. The risk is linked to the exposure route. The carcinogenic risk of different Potentially toxic elements is as follows: As>Cd>Cr>Ni. As is the highest carcinogenic risk element. The average value of the CR for adults is 9.54E-06, and the maximum value is 2.06E-05. The average value of the CR for children is 2.56E-05, and the maximum value is 5.57E-05. The CR of all Potentially toxic elements is between 10-6 and 10-4. The carcinogenic risk caused by Potentially toxic elements in Hailun soil is within the acceptable range, but the carcinogenic risk index exceeds the value of 10-6 proposed by the US. EPA. In terms of hazard degree, children have a higher risk of carcinogenesis than adults (Fig. 5(b)). Prevention should be strengthened.
Table 9.
Average daily exposure to Potentially toxic elements in soil; non-carcinogenic risk assessment.
Table 10.
Average daily exposure to Potentially toxic elements in soil; carcinogenic risk assessment.
Table 11.
Non-carcinogenic health risk index of Potentially toxic elements in the soil in Hailun.
Discussion
The background values of heavy metal elements As, Cd, Cr, Cu, Hg, Ni, and Zn in the soil of Helen City are 9.14 mg/kg, 0.07 mg/kg, 42.46 mg/kg, 17.78 mg/kg, 0.03 mg/kg, 23.65 mg/kg, 20.23 mg/kg, and 52.05 mg/kg, respectively. The content of Potentially toxic elements in the soil of Hailun city is higher than the background value of Hailun city (Table 6.). The accumulation effect of Cd in the soil is the most obvious, followed by Cr, in the order of Cd>Cr>Hg>Cu>Zn>Pb>Ni>As, reaching 1.10-1.86 times of the soil background value, respectively, indicating that Potentially toxic elements accumulate in the soil to a certain extent. In 2008, the content of Cd in the soil of Hailun city was significantly lower than the background value; Cr, Zn, and Hg were higher than the background value and the values of other elements were similar to the background value [14]. It shows that compared with ten years ago, the pollution of soil with Potentially toxic elements has an aggravating trend, especially as the content of Cd increases the most, followed by the increase of Cu, Pb, Ni, and As, and there is basically no change in Cr, Zn, and Hg. The survey found that agricultural activities, aquaculture, sewage irrigation, automobile exhaust emission, and traffic dust are the main factors
Table 12.
Carcinogenic health risk index of Potentially toxic elements in the soil in Hailun.
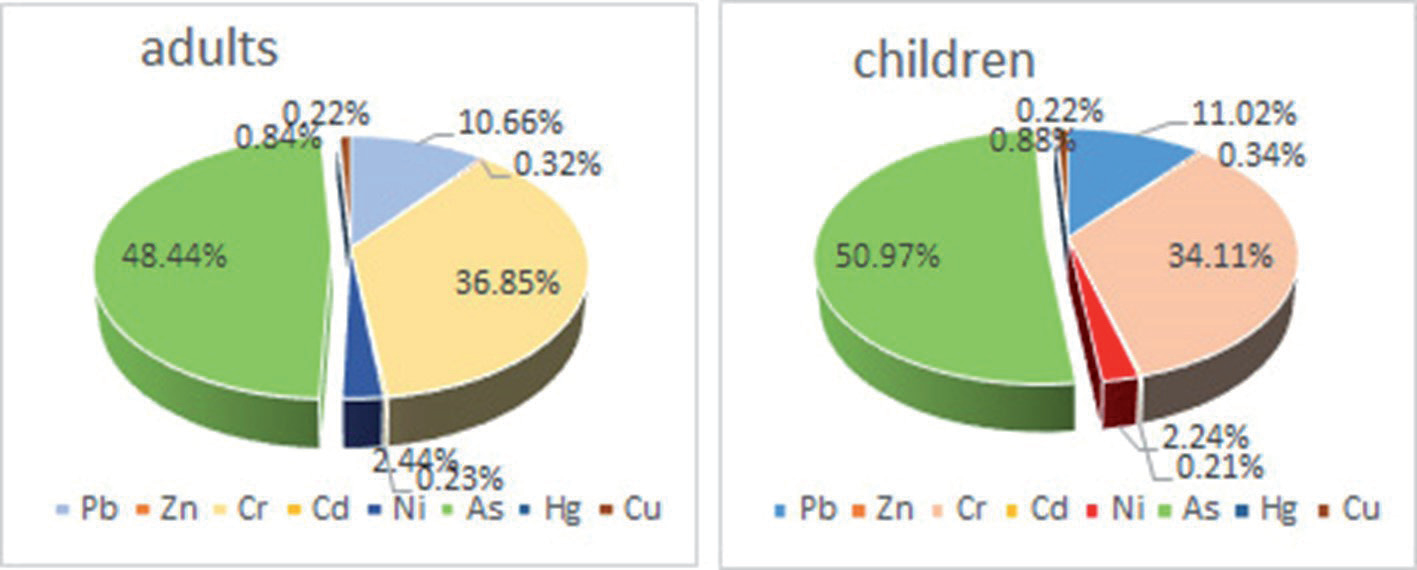
Fig. 5.
Comparison of non-carcinogenic and carcinogenic Potentially toxic elements in adults and children.
a) causing soil Potentially toxic element pollution [33, 34]. The pollution of Cd mainly comes from the use of pesticides, fertilizers, and plastic films. Years of use of pesticides containing Cd, Pb, Hg, As, etc., unreasonable use of fertilizers, and extensive use of plastic greenhouses and films lead to the accumulation of heavy metals in the soil. This phenomenon has been found for the first time in this region. It needs to be paid great attention to whether there is a significant increase in Cd in soil due to the large use of pesticides and chemical fertilizers in agricultural production in other parts of China and around the world.
The study finds that the content of Potentially toxic elements in the soil of Hailun City (Table 6.) is higher than the background value, indicating that most Potentially toxic elements accumulate in the soil. Compared with ten years ago [14], soil Potentially toxic elements pollution has an aggravating trend, especially the content of Cd changes the most. In 2008, the content of Cd in Hailun city was significantly lower than the background value, while at present, the content of Cd is significantly higher than the background value. The variation coefficient ranges from 0.07 to 0.77. Both Hg and Cd are considerably higher than other Potentially toxic elements, but the variation rule is the same as it was ten years ago. At the same time, the survey found that farming activities, aquaculture, sewage irrigation, traffic dust, and automobile exhaust emissions are the main factors causing soil Potentially toxic elements pollution.
The potential ecological risk assessment shows that the distribution range of the total RI of Potentially toxic elements in the study area is 61.08~445.75, with slight, medium, and strong ecological risks accounting for 77.52%, 21.8%, and 0.67%, respectively. The impact factors are Cd and Hg. Cd has slight, medium, strong, and extremely strong ecological risks, while Hg has slight, medium, strong, very strong, and extremely strong ecological risks. Other Potentially toxic elements have slight ecological risks. Mirzaei et al. (2020) [35] found that Cd has the greatest ecological risk in Chaharmahal and Bakhtiari provinces of Iran,.Nihal et al. (2021) [36] found Zn and Mn have low ecological risk in Ramsar area, Assam state, India. As to our study, the ecological risk level of Hailun City is very strong, which needs more attention. In addition, it is necessary to strengthen the early warning mechanism for other areas with slight, medium, and strong ecological risks, where the risks should be identified as soon as possible. Furthermore, we need effective measures to control soil pollution [37].
Potentially toxic elements in the farmland soil of Hailun City have no carcinogenic or non-carcinogenic hazards to adults. The average value of the CR for adults and children is 9.54E-06 and 2.56E-05, respectively, and the maximum value is 2.06E-05 and 5.57E-05, respectively. Both of them are between 10-6 and 10-4. As a result, the carcinogenic risk of Potentially toxic elements is generally acceptable and does not cause significant harm to the health of the local population. However, they all exceed the soil treatment benchmark value of 10-6 proposed by the US EPA, and prevention should be strengthened. The average value of the HQ of Potentially toxic elements for children is 0.795, with a maximum value of 1.16, indicating that Potentially toxic elements in soil in this area have a great non-carcinogenic health risk for children, so prevention should be strengthened. In the human health risk assessment of Potentially toxic element pollution in urban soil in southern India, Adimalla et al. (2020) [38] believe that Potentially toxic elements have a carcinogenic risk and a non carcinogenic risk to humans. The Potentially toxic elements with non carcinogenic risk come from Cr and Pb, and the carcinogenic risk comes from Cr control. Zhang et al. (2021) [39] Assessed the health risk of Potentially toxic elements in the soil of the Shihe River Basin in China and found that chromium from natural sources has a carcinogenic risk value for children, while the carcinogenic risk for adults and non carcinogenic risk for adults and children are at an acceptable level. Shen et al. (2021) [40] evaluated the health risk of Potentially toxic elements in the soil of the Yellow River irrigation area in China and considered that 0.64% and 9.32% of the total area of the Yellow River irrigation area constitute high HQ areas for children and adults, respectively. In particular, the regions of 0.68% and 1.12% were identified as high HQ regions of As and Cr, and the critical probability was 0.9. The research of domestic and foreign scholars shows that the health risks of Potentially toxic elements are different in different countries and regions, especially in areas with high risks. We should strengthen the prevention of the health risks of Potentially toxic elements [41, 42].
Conclusions
The Potentially toxic elements As, Cd, Cr, Cu, Hg, Ni, Zn, and Pb in Hailun soil were higher than the background value. Cd was the most prominent element, with an average content of 0.13 mg/kg, which was 1.86 times of the background value, and the quantity increased significantly. The average content of Cr is 63.93 mg/kg, which is 1.51 times of the background value. The CV of Cd is also high, at 0.76. It is seriously affected by the centralized development of animal husbandry, showing the current situation of uneven pollution. There are Cd and Hg pollution and ecological risks in the soil. The Cd ecological risk index is 19.32~751.64, with a slight, medium, strong, and extremely strong level of ecological risks. Hg takes second place, and the risk index is 21.68~655.48, with a slight to extremely strong level of ecological risk; Cr, Ni, Pb, Zn, As, and Cu are generally in a pollution-free state with no obvious harm. The soil Potentially toxic elements pollution, ecological risk, and health risk in Hailun City are generally low, and most of them are in the state of no pollution and no obvious harm, so they can be used safely. However, the excessive phenomenon of Hg, Cd, As, Cr, and other individual elements in individual indicators should be given more attention, and prevention strategies should be strengthened. Children are more vulnerable to the health threat of Potentially toxic elements, and oral intake is the main route of exposure risk from soil. Human health risks are more likely to be caused by As and Cr.

