

Introduction
Foreign trade and foreign direct investment (FDI) have been the important driving force for Chinese economic development in the context of economic globalization. According to the Ministry of Commerce of the People’s Republic of China, the scale of foreign capital utilization reached 135 billion US dollars in 2018, which was 3% higher than that in 2017. The global FDI inflow went down in these two consecutive years, whereas China’s FDI inflow exhibited a countertrend. The total foreign trade value for China was 4.62 trillion US dollars in 2018, which hit a record high, with an annual growth rate of 12.6%. However, China’s increasingly serious air pollution is associated with its opening up and rapid economic development. This has attracted widespread attention. A large amount of fossil energy is consumed in energy-intensive industries, which produces massive pollutants. The air pollutant emissions are environmentally unaffordable for China, as they result in frequent multi-area pollution on a large scale when coupled with adverse meteorological conditions. The interplay of air pollution between areas has become increasingly prominent. In recent years, the Chinese government has regarded air pollution prevention as an issue related to people’s livelihood that needs to be addressed urgently. At this important stage of China’s openness, how to coordinate economic development, foreign trade, FDI, and air pollution in the process of economic globalization has been a major issue. In this regard, this study mainly examined the impact of China’s FDI and foreign trade on its air pollutants so as to formulate pollution control policies for China, which is of great significance.
Grossman and Krueger [1] proposed the “Environmental Kuznets Curve (EKC)” hypothesis, which states that an “inverse U-shape” curve relationship exists between economic growth and environment. Some scholars later conducted empirical research to test whether or not the EKC exists. For instance, an inverse-U-shaped relationship was verified through econometric analysis [2-4], whereas different relationships, such as “U,” “N,” and “inverse-N” shapes, were also found by McPherson and Nieswiadomy [5], Huang [6], and Liu and Lin [7]. In the previous literature, industrialization, energy intensity, foreign trade, and FDI were considered to be the potential factors that affect air pollutant emissions [8-10].
Generally, due to the different research objectives and methods, there is no consensus on the impact of FDI on the environment. Many studies explored the effects of foreign trade and FDI on carbon emissions [11-14]. As for the effects on air pollutants, the representative literature is as follows. With per capita emissions of SO2 and soot as environmental indicators, Liu et al. [15] adopted the first-difference and orthogonal-deviation Generalized Method of Moments (GMM) to estimate the impact of FDI on pollutants. The results showed that FDI curbed the emissions of SO2 and soot in China. Sapkota and Bastola [16] used fixed- and random-effect models and time series data for 14 Latin American countries from 1980 to 2010 to study the impact of FDI. They came to a similar conclusion that FDI curbed pollutant emissions. To study the relationship between Chinese economic activities and PM2.5 emissions, Zhu et al. [17] used the Vector Error Correction Model (VECM) and panel data of 73 key cities in China from 2013 to 2017. The results indicated that FDI aggravated China’s air pollution in the long term. The impact of foreign trade on the environment is significantly controversial in the area of energy economics [18, 19]. One kind of opinion maintains that foreign trade is helpful for reducing air pollutants, and the other is the opposite. For example, Kohler [20] used the Granger causality test to examine the impact of foreign trade, and found that the trade openness in South Africa reduced emissions. However, many studies found that foreign trade increased emissions. For instance, Hakimi and Hamdi [21] used the VECM to discuss the impact of foreign trade on the environmental quality of Tunisia and Morocco, and found that the import and export worsened the environment. Lin [22] used a dynamic panel model to explore the different effects of foreign trade on CO2, NOx and aerosol concentration, showing that foreign trade had an overall negative impact on China’s environment. Xu et al. [23] used the econometric method to examine the effects of foreign trade on air pollutants and found that foreign trade promoted the pollutants.
It is noteworthy that the spatial clustering of air pollutants can produce cross-regional diffusion and migration to a certain extent, which has a strong spatial correlation. However, the traditional analysis applying panel data ignores the spatial correlation, which leads to partial and even biased estimates. Thus, some studies explored the spatial agglomeration and spillover of air pollutants using spatial econometric models [24, 25]. For example, Based on Chinese provincial panel data during 2001-2012, Huang et al. [26] explored the pattern of pollutant agglomeration and used the spatial Durbin model (SDM) to study the regional spillover effects of FDI on pollutants. Liu et al. [27] explored the spatial agglomeration effect of FDI on SO2, wastewater and waste soot and dust, using data from 285 cities in China from 2003 to 2014. Jiang et al. [28] used the SDM to consider the spatial spillover effect, and discussed the influence of variables such as FDI and tertiary industry in the local and adjacent areas on air pollutants. In addition, using the spatial econometric method, Li et al. [29] studied the spillover effects of industrialization and urbanization on pollutants in 53 Chinese cities during 2009-2014. However, the current literature only used FDI as the indicator to measure the degree of Chinese economic openness, and focused on the spillover effect of FDI on the emissions of air pollutants, ignoring foreign trade as a key indicator for economic openness.
In summary, the existing literature still has the following deficiencies. First, most studies only considered a single pollutant, such as NOx or SO2, and used only a single spatial matrix, such as the adjacent spatial weight matrix (SWM), for analysis. Second, the traditional panel data analysis ignored the differences in spatial correlation among areas. Third, some literature focused on the spillover effect of FDI, whereas these studies ignored foreign trade as the important economic openness indicator and failed to consider the spillover effect of both foreign trade and FDI on air pollutants.
Accordingly, this study focused on three aspects for improvement. First, this study covered three kinds of major air pollutants (PM2.5, SO2, and NOx) as research objects. Second, this study adopted three kinds of spatial weight matrices (SWMs), namely the adjacent SWM, inverse distance SWM, and economic distance SWM, to analyze the key factors affecting the air pollutant emissions in 30 provinces of China during 2005-2016; specially, the economic distance SWM was innovatively introduced into this study, with the economic level and geographical distance taken into account. This could better reveal the effects of foreign trade and FDI on air pollutant emissions, compared with the adjacent SWM or inverse distance SWM. Third, this study explored the air pollutant emission spatial agglomeration and spillover effects and accurately grasped the regional differences in the impact of FDI and foreign trade. In this sense, this study provides the scientific basis and experience support to achieve the goal of a win-win with respect to reducing air pollutant emissions and boosting economic openness in view of regional diversity.
Methodology
Spatial Correlation Method
Global Spatial Correlation
The global Moran’s I index is an important indicator reflecting the global spatial correlation. The index is calculated by Eq. (1).
Where wij denotes the element in the SWM; n denotes the number of regions; xi and xj represent the observed values of air pollutants in regions i and j, respectively; and x̅ represents the average of observed values. The index value is between -1 and 1. A positive index indicates air pollutant emissions have a positive spatial correlation in spatial distribution. Conversely, it implies a negative correlation. A zero index reflects no spatial correlation, indicating that the observed values are randomly distributed independently.
Local Spatial Correlation
Anselin [30] put forward the local Moran’s I index to test whether there are similar or different clusters of observations in local areas. The index is expressed as Eq. (2).
Where wij, n, xi, xj, and x̅ have the same denotation as Eq. (1). The positive index means that high (low) observations are surrounded by high (low) observations. Otherwise, it means that high (low) observations are surrounded by low (high) observations.
The SWM Method
The SWM method is used to describe the relative position relationship of spatial observation and measure the spatial dependence. Different SWM methods result in different spatial correlations and test results. The most commonly used methods are the adjacency SWM method which is based on geographic location and inverse distance SWM which is based on the principle of geographical distance [31]. The two models are expressed as Eqs. (3) and (4), respectively.
Where dij represents the reciprocal of distance based on the longitude and latitude from the province i’s capital to the province j’s capital. Due to the different geographical locations and economic development levels of different provinces, this study used an economic distance SWM, expressed as Eq. (5).
Where
The Spatial Econometric Method
The spatial econometric models mainly include the spatial lag model (SLM), spatial error model (SEM), and SDM according to Elhorst [32], which are shown as Eqs. (6)-(8), respectively. The SLM considers the spatial lag correlation of dependent variables. The SEM introduces the spatial effect into disturbance error term and reveals the spatial heterogeneity. The SDM considers the lag terms of explanatory and dependent variables. The SLM, SEM, and SDM can usually be expressed as:
For the selection of these spatial models, the likelihood ratio (LR) test and Wald test can be used in the following two null hypotheses. H0: δ = 0 and H0: δ + ρβ = 0. The first null hypothesis tests whether or not the SDM can be simplified to the SLM. The second null hypothesis tests whether or not the SDM can be simplified to the SEM [33]. The SDM should be used because both hypotheses are rejected.
The cubic term of GDP per capita is introduced into the base regression to examine whether more possible shapes of the EKC exist. In selecting other influencing factors, this study set FDI and foreign trade openness as the main variables. Since the SDM can better estimate the spillover effects of different observers and obtain unbiased coefficient estimates, this study adopted the more generalized SDM to explore the spatial correlation between the variables and air pollutant emissions. The specific spatial econometric model is expressed as Eq. (9),
(9)
Where AP stands for the air pollutants, including NOx, PM2.5, and SO2; W represents the SWM of N×N, FDI represents FDI dependent degree; TR denotes foreign trade dependent degree; and X represents other control variables, including the industrialization level, research and development (R&D) intensity, energy efficiency, and traffic intensity. The specific description of these variables is shown in Table 1. The subscripts i and t represent the province and year, respectively; ρis a spatial autoregressive coefficient, and εit represents a random error vector; β and θ are unknown parameter vectors.
Regarding the regression results of the SDM method, LeSage and Pace [34] observed that the coefficients of the spatial and non-spatial lag terms of explanatory variables in the SDM cannot reflect the full effects of the explanatory variables due to spatial correlation. For the comprehensive analysis of the explanatory variables, it is necessary to divide the impacts of explanatory variables on dependent variables into the direct effect and indirect (spillover) effect, which can provide more valuable explanations for the model. The panel SDM can be transformed into the following form as shown in Eqs. (10)-(14), based on the method proposed by Elhorst [31].
Where Sr(W)ii represents the diagonal elements. The direct effect is the average value of dominant diagonal elements, representing the effect of the region i’s independent variable on its dependent variable. Sr(W)ij is the non-diagonal element. The spatial spillover effect is the average of either row or column sums of non-diagonal elements. It refers to the effect of the region j’s independent variables on region i’s dependent variables.
Data Sources
As for data sources, this study used Chinese provincial panel data from 2005 to 2021. The variable definitions are shown in Table 1. The FDI dependent degree and foreign trade dependent degree are set up to measure the actual level of China’s economic openness, and they are expressed by the ratio of FDI, and import and export values to GDP, respectively. Industrialization level and R&D intensity indicators are measured by the ratio of secondary industry output value and investment in R&D to GDP, respectively. The SO2, NOx, PM2.5 emission data come from China Statistical Yearbook, China environment protection database, and emission inventory database from Tsinghua University and obtained through the emission factor method [35- 37]. The data for GDP, import value, export value, FDI, secondary industry output value, investment in R&D, the number of civil vehicles, and road mileage are from the China Compendium of Statistics, China Statistical Yearbook, China Transportation Yearbook, and China Science and Technology Statistical Yearbook, as well as provincial statistical yearbook. In order to eliminate the influences of exchange rate and inflation change on these values, the currency variables are converted based on the 2005 constant price. It is noted that the data for Hong Kong, Macao, Taiwan, and Tibet is incomplete. For the sake of data integrity, these regions are not included in this study.
Empirical Results and Discussion
Spatial Correlation Analysis
The Moran’s I index of SO2, NOx, and PM2.5, with three spatial weight matrices is positive significantly at the level of 5%, which indicates that these air pollutant emissions have a positive spatial correlation.
Table 1.
Definition of the variables used in this study.
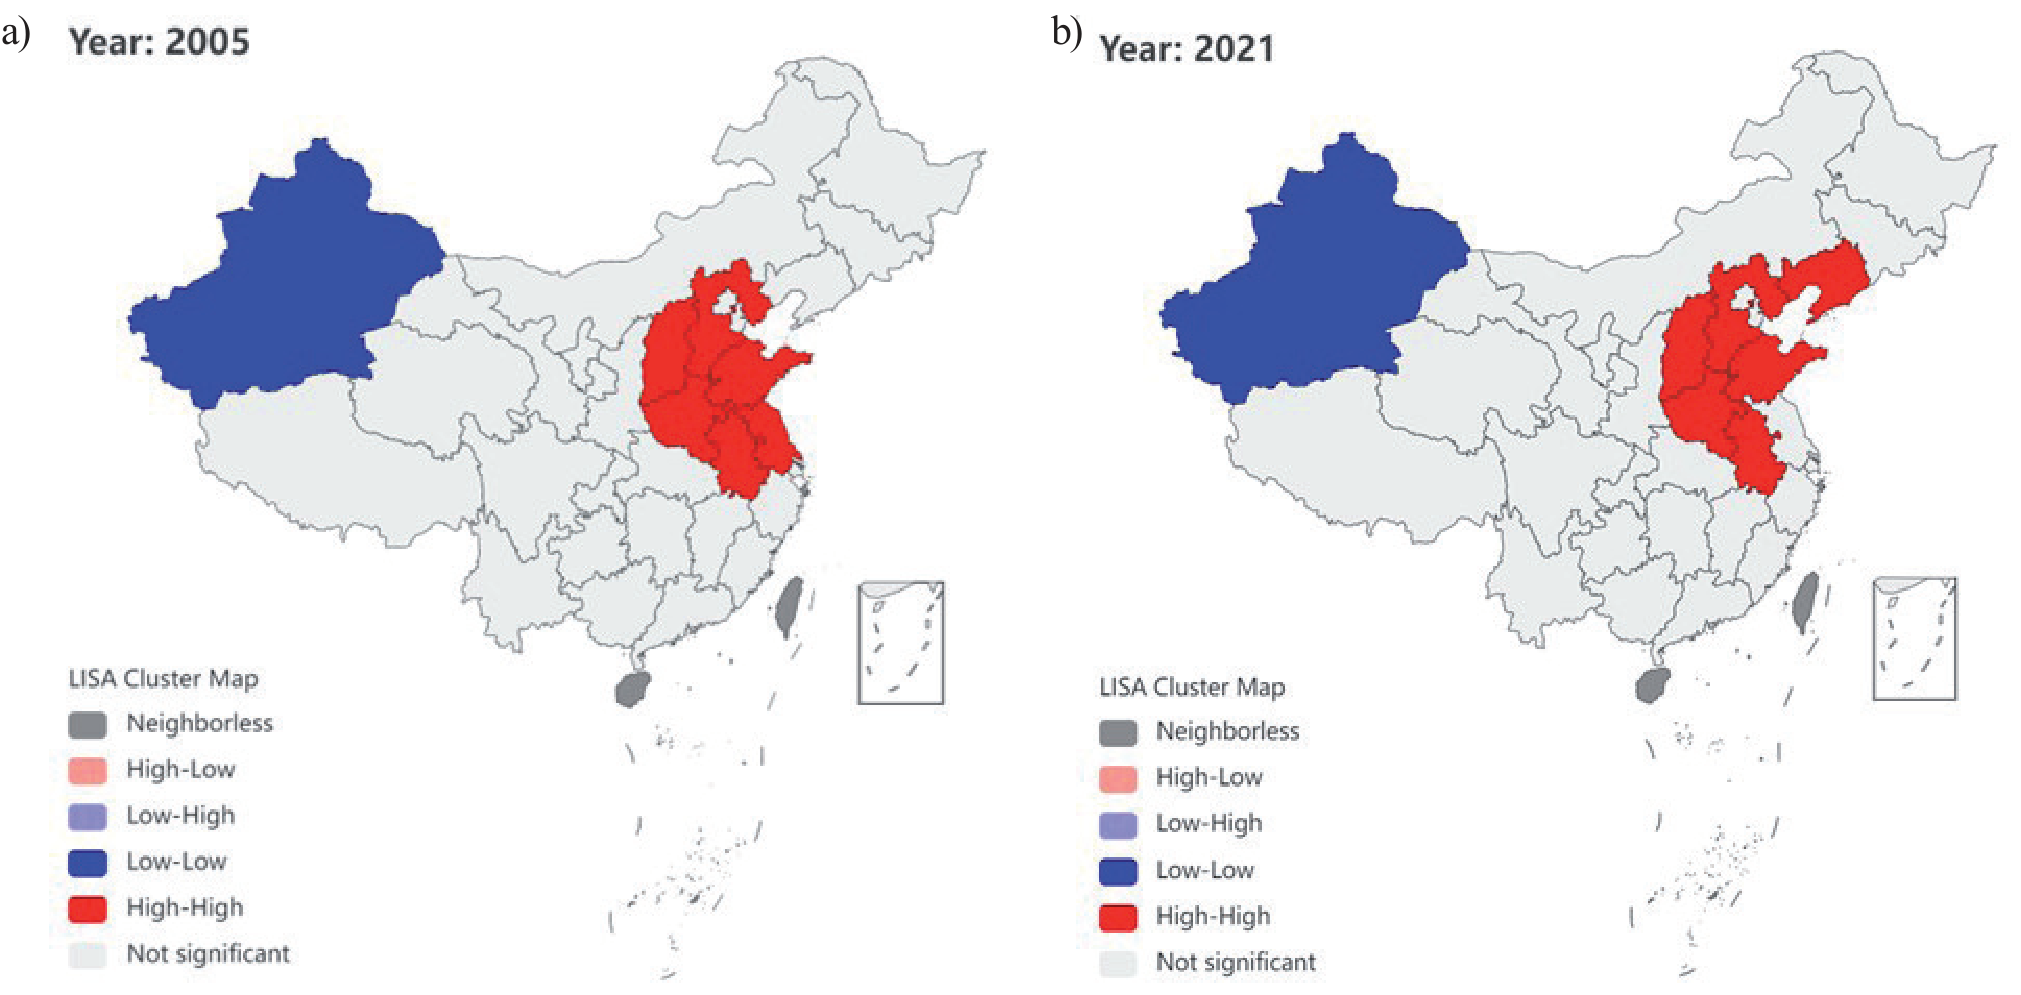
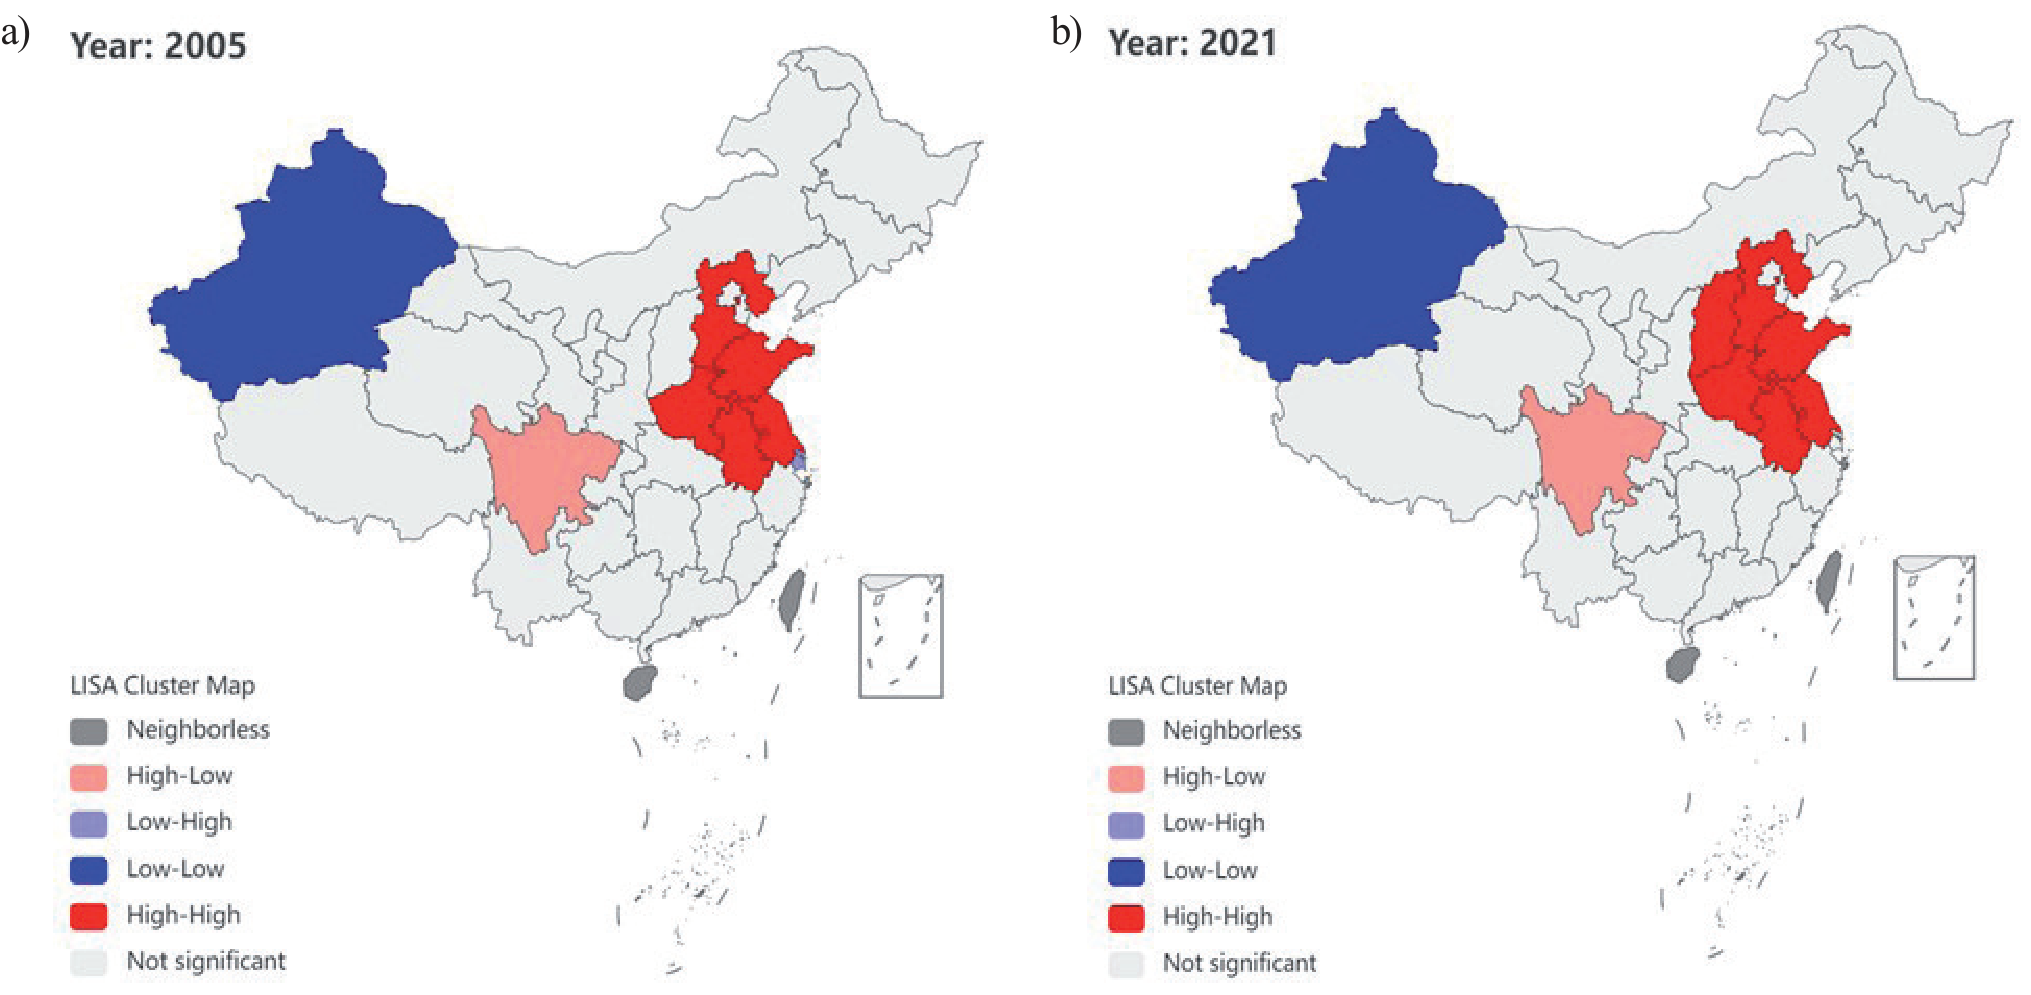
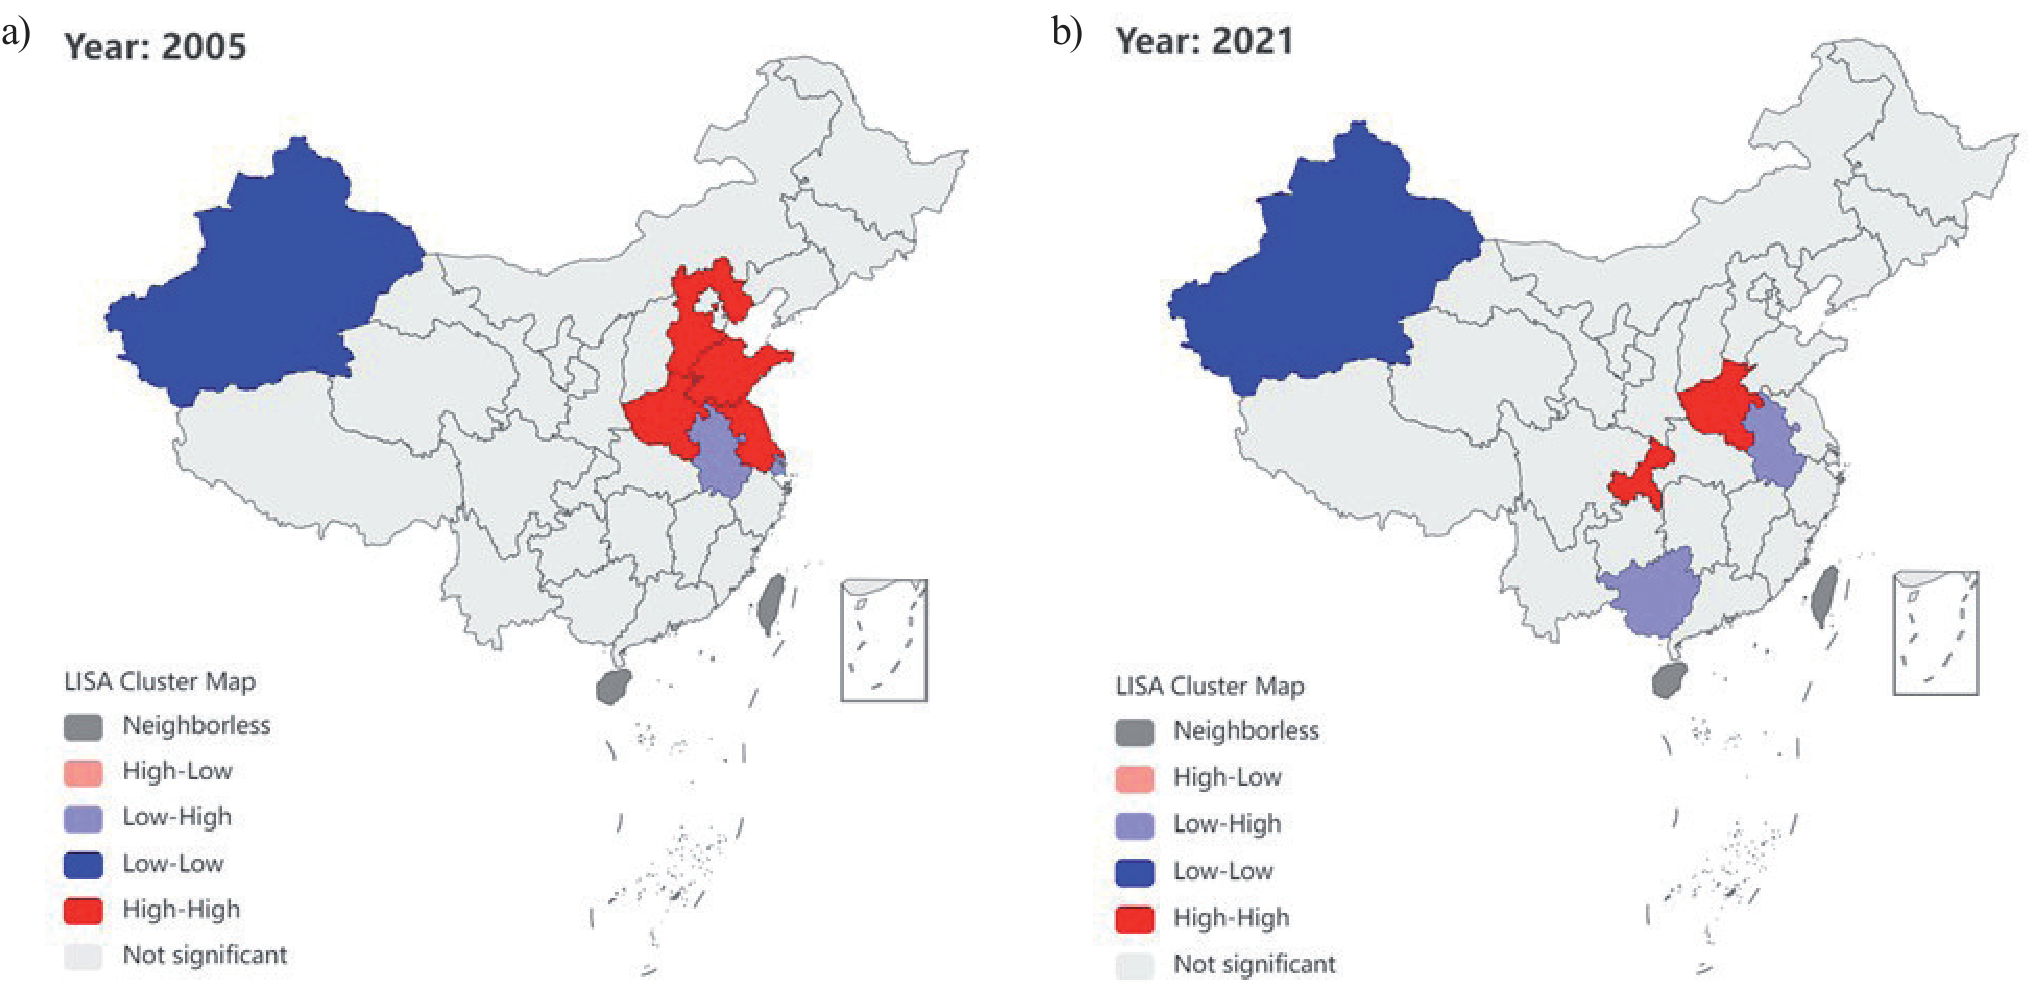
The GeoDA software was used to draw the local spatial association (LISA) clustering map and conduct local spatial correlation analysis of SO2, PM2.5, and NOx. Due to limited space, only the LISA clustering maps for 2005 and 2021 were drawn, as shown in Fig. 1-3.
Fig. 1-2 indicate that the emissions ofPM2.5 and NOx in Hebei, Henan, Shandong and Anhui present H – H agglomeration. This indicates that the agglomeration of PM2.5 and NOx is higher in these provinces, which makes the spatial correlation of PM2.5 and NOx pollution stronger among the regions. In 2005 and 2021, Sichuan had higher NOx emissions and was surrounded by provinces with relatively low NOx emissions, which presented as an H – H agglomeration with the surrounding areas. From the perspective of the industrial structure, Hebei, Henan, Shandong, Anhui, and Sichuan are all traditional industrial provinces with high levels of pollution-intensive industrial agglomeration. Industrial production consumes a lot of fossil energy, leading to a large amount of air pollutant emissions. The PM2.5 emissions in Jiangsu presented the H – H agglomeration in 2005, but the PM2.5 agglomeration in Jiangsu was not significant in 2021. The H – H agglomeration of the PM2.5 migrated to the northeast area, which led to the H – H agglomeration in Liaoning. Fig. 3 shows that from 2005 to 2021, the H – H agglomeration of SO2 moved from the east to the central and western areas, exhibiting a diminishing trend. The spatial correlation ofSO2 emissions is not obvious. The reason may be that desulfurization projects were generally implemented in China’s power plants to control pollution, and the 11th Five-Year Plan (2006-2010) put forward a SO2 emission reduction target, which had been well implemented.
The SDM Estimation
Fig. 1-2 indicate that the emissions of PM2.5 and NOx in Hebei, Henan, Shandong and Anhui present H – H agglomeration. This indicates that the agglomeration of PM2.5 and NOx is higher in these provinces, which makes the spatial correlation of PM2.5 and NOx pollution stronger among the regions. In 2005 and 2021, Sichuan had higher NOx emissions and was surrounded by provinces with relatively low NOx emissions, which presented as an H – H agglomeration with the surrounding areas. From the perspective of the industrial structure, Hebei, Henan, Shandong, Anhui, and Sichuan are all traditional industrial provinces with high levels of pollution-intensive industrial agglomeration. Industrial production consumes a lot of fossil energy, leading to a large amount of air pollutant emissions. The PM2.5 emissions in Jiangsu presented the H – H agglomeration in 2005, but the PM2.5 agglomeration in Jiangsu was not significant in 2021. The H – H agglomeration of the PM2.5 migrated to the northeast area, which led to the H – H agglomeration in Liaoning. Fig. 3. shows that from 2005 to 2021, the H – H agglomeration of SO2 moved from the east to the central and western areas, exhibiting a diminishing trend. The spatial correlation of SO2 emissions is not obvious. The reason may be that desulfurization projects were generally implemented in China’s power plants to control pollution, and the 11th Five-Year Plan (2006-2010) put forward a SO2 emission reduction target, which had been well implemented.11111 The Hausman test shows that the p values of the three air pollutants with the adjacency SWM, inverse distance SWM and economic distance SWM are less than 0.05. Accordingly, the fixed effect should be used in this case. The LR ratio is used to measure the spatial fixed and time fixed effects. It is found that the p values of the air pollutants with three kinds of SWMs are all less than 0.01, so the spatial and time fixed effects should be selected. The results of the Wald test and LR test are shown in Table 2. It can be seen that both null hypotheses are rejected, and thus the SDM model can be adopted.
As Table 2 shows, the spatial correlation coefficient ρ is significantly positive with the three SWMs, indicating there is an obvious spatial agglomeration feature of the air pollutants in the provinces of China. Thus, the regression coefficient in the SDM cannot accurately reflect the marginal effect; and the spatial lag coefficient cannot accurately reflect the spatial spillover effect [38]. Therefore, this study focused on the analysis of the direct and spillover effects of the SDM in detail.
The direct and spillover effects of the SO2, PM2.5, and NOx were estimated by using the SDM based on LeSage and Pace [34]. The results are shown in Table 3. It is noteworthy that the direct effect coefficients are different from their coefficient estimates in Table 2. The reason is that the direct effect takes into account the feedback effect that arises from the impact passing through neighboring provinces and back to this province.
The Direct Effect
The direct effects were first analyzed. On the SO2, PM2.5, and NOx emissions, the coefficients of ln(Y), (ln(Y))2, and (ln(Y))3 show as negative, positive, and negative, respectively, at the significant level of 1% with different SWMs. This indicates that an “inverted N” relationship exists between air pollutant emissions and economic growth. The air pollutant emissions decrease first, then increase, and eventually decrease again with the economic growth. The relationship between the air pollutants and economic growth depends on the development stage. In the beginning, where the economic level is low, economic growth would promote production efficiency to reduce pollutants. However, with further improvement in economic growth, industrialization accelerates and consumes large amounts of fossil energy, which leads to more air pollutant emissions. When the economic level reaches a certain height, the energy-intensive industries may gradually turn to service industries and knowledge-intensive industries, and the pollution situation would be alleviated accordingly.
The direct effect of ln(FDI) on the SO2 and PM2.5 is significantly positive with the three SWMs, and the direct effect on the NOx is positive though not significant. This denotes that the growth of FDI dependent degree promotes the emissions, which is consistent with the study conducted by Zhu et al. [39]. For instance, the coefficient of ln(FDI) on PM2.5 with the adjacency SWM (W1) is 0.0494 at a 1% significant level, which shows that the growth of FDI dependent degree by 1% would increase the PM2.5 emission by 0.0494%. In recent years, China has introduced a large amount of FDI, most of which has flowed into the industrial sector. The capital and technology brought by this FDI will expand the scale of industry, accelerate the use of natural resources, and consume a lot of fossil energy. In addition, some FDI flows into pollution-intensive and resource-consuming industries, which worsens pollution [39]. Under the performance appraisal mechanism, which sets economic growth as the core, blind competition for FDI seems inevitable for local governments. Some local governments have relaxed their environmental standards so as to attract FDI, which has led to increased air pollutants in China [40, 41].
For the air pollutants with three kinds of SWMs, the direct effects of ln(TR) are significantly negative. This indicates that the rise of foreign trade dependent degree has curbed air pollutant emissions. Chinese foreign trade structure has been continuously optimized and its quality and efficiency have been constantly promoted. According to the Ministry of Commerce of the People’s Republic of China, the Chinese export value of seven categories of labor-intensive products was 2.9 trillion RMB in 2016, which reflected a drop of 1.7% on the year, while the import and export of the processing trade fell by 5% to 7.3 trillion RMB. China has also vigorously supported the development of a new type of foreign trade, so the proportion of the service sector in foreign trade has further increased. In 2016 the annual import and export value of Chinese services reached 5.4 trillion RMB, which was an increase of 14.2% over 2015. The proportion of service imports and exports in China’s total foreign trade reached 18%, which was 2.6% higher than that in 2015. Many foreign trade enterprises have intensified their independent innovation efforts and participated in a higher level of international specialization. The Chinese government has comprehensively strengthened the supervision of the foreign trade environment, curbed the trade-in high-pollution and high-emission products, and vigorously promoted the development of green trade. New achievements have been made in the development, transformation, and upgrading of the trade sector with the goal of reducing pollutants [42, 43].
Table 2.
Results of SDM regression.
Table 3.
Results of direct and spillover effects.
The direct effects of ln(E) on air pollutant emissions are significantly negative at the 1% level with the three SWMs. This indicates that the energy efficiency is negatively correlated with the air pollutant emissions in China. To be specific, boosting energy efficiency can improve the utilization rate of energy, which saves energy and reduces air pollutants [4, 10, 44]. With regard to the SO2, PM2.5, and NOx emissions, the direct effect of ln(RD) is only significantly negative with the adjacency SWM W1, which indicates that the promotion of R&D investment has mitigated air pollutants in China. This is consistent with the study conducted by Guan et al. [45]. Increased R&D investment accelerates technological innovation and improves production efficiency, and this is conducive to mission reduction. The direct effects of ln(IND) on the SO2 and PM2.5 are significantly positive with the adjacency SWM (W1), while the direct effects on theNOx are significantly positive in the context of the three SWMs. The rise of the industrialization proportion can promote air pollutant emissions. At present, the Chinese industrialization development mode is still dominated by heavy industry, and the industrial structure remains irrational. There are many energy-intensive industries consuming a large amount of fossil energy, which causes serious levels of pollution [9, 46, 47]. The direct effect of ln(TI) on SO2 is positive and on PM2.5 is negative, but the direct effects of ln(TI) on the three air pollutants are not significant.
The Spillover Effect
As for the spillover (indirect) effect of each variable on the air pollutant emissions, the spillover effects of ln(Y) and ln(FDI) on the air pollutants are not significant in the context of the three SWMs, which indicates that the increase in the economic growth and FDI in adjacent provinces exerts no significant effect on air pollutant emissions in the local province. The reasons can be summarized as follows. First, an increase in foreign investment in surrounding areas has made a positive contribution to the introduction of advanced technology, which is conducive to energy efficiency improvement and pollutant reduction. Second, the expansion of industrial scale and the transfer of energy-intensive industries caused by the growth of FDI will increase the total industrial energy consumption; and the pollutant diffusion in large quantities can aggravate the environmental pollution in the local and adjacent provinces. In combination with these two aspects, the effect of economic growth and FDI on air pollutant emissions in the surrounding areas is not clear [7, 48, 49]. The spillover effect coefficients of ln(TR) on the SO2 and NOx are significantly negative with the inverse distance SWM (W2) and economic distance SWM (W3), which indicates that the increase in the trade dependent degree in the adjacent provinces has an inhibitory effect on the SO2 and NOx emissions in the local province. The reason for this phenomenon is similar to the direct effect analysis; that is, the increased foreign trade dependent degree enables less developed regions to acquire and absorb advanced technologies from developed regions, increases the intensity of market competition, and encourages enterprises to improve energy efficiency. Increases in energy efficiency can reduce air pollutants from fossil fuel combustion [43, 50, 51]. Meanwhile, increased foreign trade dependent degree promotes the improvement of trade structure, which is helpful to reduce pollutant emissions in the local province and the emissions diffusing into adjacent provinces [2].
The spillover effects of ln(E) on the SO2 and NOx are significantly negative at the 5% level with the three SWMs. The spillover effect of ln(RD) on the SO2 is significantly negative with the three SWMs, and it is only significantly negative for PM2.5 with the adjacency SWM (W1). This indicates that increases in energy efficiency and R&D investment in the adjacent provinces have restrained the air pollutant emissions in the local province. Increasing energy efficiency and R&D investment will inevitably lead to technology diffusion in the adjacent provinces. The promotion of production technology and independent industrial innovation in one province can improve the energy efficiency and production efficiency for others and itself, which is conducive to emission reduction [52]. In the context of the three SWMs, the spillover effects of ln(IND) on the three air pollutants are significantly positive at the 1% level. The increased industrial proportion in the adjacent provinces can promote air pollutants in the local province, which is consistent with the study conducted by Liu et al. [15]. Industrial production consumes a large amount of non-ferrous metals, coal, and other fossil fuels, thereby promoting air pollutants. Meanwhile, the diffusion of pollutants in the surrounding areas worsens local pollution [29]. The spillover effect coefficient of ln(TI) on the PM2.5 is significantly positive with the adjacency SWM (W1), whereas the ln(TI) coefficient of other air pollutants is not significant. This indicates that the enhanced traffic intensity in the surrounding provinces can promote the emissions of PM2.5 in the local province. The number of motor vehicles in China continues to grow, and vehicle exhaust is an important source of PM2.5 pollution in some regions [46, 53, 54]. Thus, PM2.5 is widely spread in the surrounding areas, which aggravates the local pollution.
Conclusions and Policy Suggestions
Based on the panel data of 30 Chinese provinces from 2005 to 2016, this study calculated the Moran’s I indices of the three air pollutants in these 30 provinces and found that all three air pollutants have positive spatial correlation. The spatial agglomeration was also discussed through the LISA agglomeration diagram of the three air pollutants. This study finally used the SDM for spatial econometric analysis and investigated the direct and spillover effects of FDI and foreign trade on the SO2, PM2.5, and NOx through the adjacency, inverse distance and economic distance SWMs. In addition to FDI and foreign trade, the regression analysis also considered the GDP per capita, industrialization, R&D intensity, traffic intensity, and energy efficiency. The inclusion of the spillover effects served to overcome the limitations in the previous literature, where the spillover effects of the air pollutants on the surrounding areas were ignored. On this basis, the following conclusions are drawn.
(1) The three air pollutants exhibit positive spatial correlation. The H – H agglomeration of the PM2.5 migrates to the northeast area; the H – H agglomeration of SO2 moves from the east to the central and western areas, and the agglomeration shows a diminishing trend.
(2) Increased FDI in a local province promotes the local air pollutants, but the spillover effect is not clear.
(3) The foreign trade reduces air pollutants in the local province, and the spillover effect is obvious. The increased trade dependent degree in adjacent provinces has a reducing effect on the SO2 and NOx in the local province.
(4) The relationship between the economic growth and the pollutants presents an “inverse-N” shape in the local province; the industrialization process increases the pollutants, exerting an obviously positive spillover effect; the R&D intensity reduces the pollutants and has a negative spillover effect on SO2; the energy efficiency substantially reduces the pollutants and exerts a negative spillover effect on local SO2 and NOx; the traffic intensity increases the pollutants with a positive spillover effect on PM2.5.
Given the above findings, the policy recommendations can be made as follows:
(1) The LISA cluster map indicates that the emissions of PM2.5 and NOx in Hebei, Henan, Shandong, and Anhui, namely, traditional industrial provinces, show H – H concentrations in 2005 and 2016. Because the air pollutants have positive spatial correlation and spillover effects, it is necessary to enhance the regional cooperation between the local governments to control this pollution. Furthermore, regional cooperation among local governments should be strengthened to jointly control pollutant emissions. It is important to divide Hebei, Henan, Shandong, Anhui, and other traditional industrial regions into key governance regions and balance the cooperation mechanism among the regional local governments. The cross-provincial environmental pollution monitoring system should be consolidated so that the local governments can jointly control air pollution.
(2) The rise of FDI dependent degree in a local province promotes air pollutants, but the impact of the growth of FDI in the adjacent provinces on the local province is not clear. This indicates that the quality and structure of the FDI still need to be further improved. Therefore, the government should focus on the quality of FDI and boost the enforcement of environmental protection through constant improvement of the environmental regulations and supervision system. The FDI in heavy-polluting industries should be restricted or prohibited from entering China. Instead, the FDI should be encouraged to flow into green and knowledge-intensive industries. China should focus on developing advanced technologies and green production processes through the entry of foreign-owned enterprises, and should introduce targets to ensure that FDI is of high quality and efficiency.
(3) The foreign trade growth restrains air pollutants in the local province, and it also has a negative spillover effect on the emissions of NOx and SO2 in the surrounding provinces. This reflects the improvement of the trade structure in recent years. China should further improve the quality of foreign trade through establishing rational import and export strategies. The foreign trade structure should be optimized and the transformation and upgrading of industry should be guided towards international business. The government should decrease the export that generates severe pollution, increase the export of knowledge-intensive products, and develop the import of pollution-intensive products.
(4) The growth of industrialization contributes to air pollutant emission increases. Accordingly, the government should focus on the impact of industry on the environment and actively promote industrial optimization and upgrading. The industries should be transformed from low-tech, low-productivity, and labor-intensive to high-tech, high-productivity, and knowledge-intensive. China should actively adjust the structure of industrialization by favoring industrial sustainable development so as to improve productivity and curb air pollutant emissions. Increased R&D intensity can curb air pollutant emissions. Thus, the government should enhance the introduction of clean technology. The enterprises should increase their investment in energy saving, environmental protection, and new energy technology research. The improvement in energy efficiency substantially reduces air pollutants. Thus, the government should conduct comprehensive evaluations of all energy-using units and guide them to save energy. The increase in the traffic intensity in adjacent provinces has a positive effect on PM2.5 emissions in local province. So the government should set up and implement stringent auto emissions standards. Meanwhile, appropriate goals for transportation development should be established to strengthen road planning and traffic control. China should optimize the layout of highways, constantly improve its comprehensive transportation capacity, and build a modern transportation network system.

