

Introduction
In recent decades, phytases have attracted significant attention from researchers and industry professionals in the fields of conservation of the environment, nutrition, and biotechnology. The phytic acid, or phytate, is the primary form of phosphorous in plants [1] but isn’t readily available for plant utilization. Phytate is the primary source of inositol [2], a crucial nutrient for plant development and growth. It is predominantly stored as phytate, constituting 50-85% of the total phosphorus in oilseeds, cereals, and legumes [2, 3]. Moreover, phytate appears in various soil forms, including insoluble iron salts, clay-bound compounds, as well as aluminum precipitated in soils that are acidic, and forms insoluble salts of calcium in soil that is alkaline [4]. Moreover, phytate, as a powerful chelating agent, binds critical metal ions crucial for optimal plant health with soil fertility [5, 6]. Thus, plants, similar to monogastric mammals, cannot use phytate-bound phosphorous. Thus, enhancing phytase supplementation in feed is advantageous for exploiting this crucial phosphorus reservoir [5].
Phytases are enzymes that can release phosphorus from phytate, the most common type of organic phosphorus in the natural ecosystem. These enzymes facilitate the breakdown of phytic acid into three principal constituents: myo-inositol, hexa-kis-phosphate (salt form of phytate), and inorganic phosphate. Phytases represent a subclass of phosphatases that act on phosphomonoester bonds commonly seen in phytates [7, 8]. Phytases are essential for reducing phosphate contamination. They are ubiquitous in diverse sources, encompassing animal tissues, plants, and microbial organisms such as yeasts, bacteria, and mold [9, 10]. Those enzymes have recently been isolated, described, and recognized as promising agents in the field of biotechnology, with potential applications encompassing water remediation, soil health enhancement, and the improvement of water quality for aquatic organisms [11].
At present, bacteria constitute the principal reservoir for obtaining phytase, notably strains such as Bacillus phytase [12]. This enzyme has garnered extensive research attention owing to its distinctive properties and the potential for large-scale production intended for incorporation into animal feeds [13]. Environmental pollutants have emerged as a predominant challenge in recent years, adversely impacting the quality of life [14]. The combined effects of industrialization, agriculture, and urbanization have precipitated environmental degradation and pollution, especially within aquatic ecosystems such as rivers and oceans. These issues have detrimental consequences for human health and sustainable societal development [15]. The objective of this study is to isolate the phytase enzyme from soil-derived microbial sources and examine its efficacy in water bioremediation. Additionally, the study seeks to elucidate the enzyme’s immunomodulatory effects within a rat model.
Experimental
Sources and Isolation of B. subtilis
Microbial samples were extracted from soil collected at various locations in Samra Village, Al-Alam District, Salah Al-Din Governorate, Iraq, while water samples were taken from untreated wastewater at the Baiji Oil Refinery and Samarra Pharmaceutical Factory, both located in the same governorate. A total of 72 samples were collected from four different locations in Al-Alam City, resulting in 26 pure isolates through the serial dilution method. In this method, one gram of soil was added to 10 mL of sterile distilled water in each test tube, followed by serial dilution to a factor of 10^-5. A 1 mL aliquot from each dilution was plated onto selective agar plates and incubated at 30ºC for 24 hours [16].
Preparation of Selective Agar for B. subtilis
The medium utilized for the isolation and identification of B. subtilis comprises the following constituents: beef extract (1 g), D-mannitol (10 g), peptone (10 g), sodium chloride (10 g), phenol red (0.025 g), and agar (15 g). These components are to be dissolved in 900 mL of distilled water with gentle heating to ensure complete dissolution. Sterilize the medium by autoclaving at 15 lbs pressure (121ºC) for 15 minutes, then allow it to cool to 45-50ºC. Under aseptic conditions, incorporate (100) mL of separately produced sterile egg yolk emulsion and mix completely. Ultimately, transfer the resulting mixture to sterile Petri dishes
Detection of B. subtilis
The B. subtilis was characterized by a number of chemical assays, as previously described [17]. Some of these tests include Gram staining, reduction of nitrates, oxidase generation, activity of catalase, as well as starch hydrolyzed, and the fermentation of sugars such as sucrose and lactose. These methodologies are consistent with established literature Freifelder (1983) [16].
Initial Analysis of B. subtilis Isolates for Activity of Phytase
About (1g) from samples of soil was dissolved in a 0.9% saline solution and then filtered using Whatman filtration paper. Successive dilutions (a total of 100 µl each) of the filtering suspension were inoculated into Lauria-Bertani (LB) agar plates. These plates were left to incubate at 30˚C for 1 to 2 days to enable the isolating of the bacteria strains. New strains of B. subtilis were tested for phytase production on LB agar enriched with 3 mM of phytic acid via a two-step contrasting method, as outlined by [18]. This approach involves the treatment of Petri plates with cobalt chloride and ammonium molybdate/ ammonium vanadate solutions to evaluate phytase activity via the reduction of the phytic acid/cobalt complex. A distinct halo on a dark yellow background indicates phytase activity. The isolates who displayed the most significant clear region were selected for subsequent examination utilizing a phytase-producing medium [19]. The altered LB medium, supplemented with 3 mM phytic acid, consisted of 10 g peptone, 10 g NaCl, 5 g yeast extract, 3 mM phytic acid, and distilled water to achieve a final volume of 1000 mL. Phytic acid was added to the LB media in a sterile way after autoclaving.
HPLC Analysis of Phytic Acid
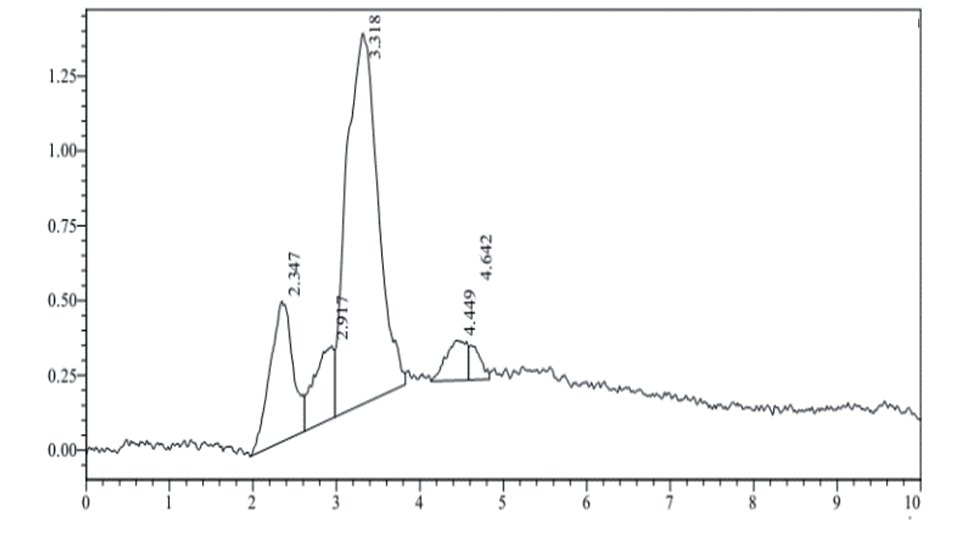
The HPLC analysis of phytic acid and protein was done on a C18 column (250 mm × 4.6 mm, 5 μm). The mobile phase used was acetonitrile/water, 60:40 v/v. The flow rate was 0.5 mL/min, and the injection volume was 20 μL. The column temperature was set at 30ºC. Detection was done by using a UV detector at 519 nm. The retention time for the protein was 3.318 min.
Purification of Phytase and Electrophoretic Analysis
The phytase was produced by cultivating B. subtilis from the Alsadera area in a wheat bran medium at 37ºC for 20 hours. The extracellular enzyme was recovered through centrifugation, followed by heat treatment and ammonium sulfate precipitation (65-85% saturation). The partially purified enzyme was suspended in 0.1 M Tris–HCl buffer (pH 7.5), dialyzed for 48 hours, and further purified to homogeneity using fast-performance liquid chromatography (FPLC) on PL aquagel-OH 40 columns. The protein’s homogeneity was confirmed using sodium dodecyl sulfate-polyacrylamide gel electrophoresis (SDS-PAGE) and Coomassie brilliant blue staining, following Laemmli’s method [20]. The N-terminal amino acid sequence of the purified enzyme was determined through automated Edman degradation. SDS-PAGE was performed with discontinuous gels (stacking gel: 5% acrylamide; separating gel: 10% acrylamide) under denaturing conditions, and protein bands were visualized using Coomassie blue staining and destaining techniques for enhanced clarity.
Enzyme Production Specifications
The culture specifically designed for phytase production was formulated with the following constituents: 1.5% glucose, 0.01% CaCl2·2H2O (calcium chloride dihydrate), 0.5% (NH4)2SO4 (ammonium sulfate), 0.05% KCl (potassium chloride), 0.01% NaCl (sodium chloride), 0.001% MnSO4 (manganese (II) sulfate), 0.01% MgSO4·7H2O (magnesium sulfate heptahydrate), 0.001% FeSO4 (iron (II) sulfate), and 0.5% sodium phytate (Sigma-Aldrich, USA), adhering to the protocol established by [21]. For the cultivation of bacterial isolates, LB medium was utilized, comprising 10 g tryptone, 10 g NaCl per liter, and 5 g yeast extract, with the pH adjusted to 7.
The phytase production medium (PPM) was formulated with 10 g sodium phytate, 1 g D-mannose per liter, 0.1 g MgSO4·7H2O, 1 g (NH4)2SO4, and 0.1 g CaCl2·2H2O, adjusted to pH 7, and subjected to sterilization via a low-binding protein filtration protocol. Bacterial cultivation in LB medium was conducted at 30ºC with agitation at 200 rpm overnight. A solitary colony of bacteria was introduced onto 5 ml of a medium LB for initial culturing, and 1 mL of the pre-culturing was subsequently inoculated within a 500 mL flask containing 100 ml of LB broth. The inoculation broth was incubated at the same condition as the initial culture. Samples were extracted bi-hourly, centrifuged at 13,000 rpm for ten minutes, and turbidity was measured at OD600 nm utilizing a wavelength spectrophotometer in accordance with the procedures outlined by [22].
Characterization of Phytase
Optimal Temperature for Phytase Activity
The optimal temperature for achieving maximal phytase activity was ascertained by subjecting the enzyme to incubation at temperatures ranging from 20 to 50ºC, with increments of 5ºC, under the previously specified assay conditions, with the sole exception of the temperature variable. Enzyme activity was subsequently quantified as detailed in the aforementioned description.
Optimal pH for Phytase Activity
The optimal pH for maximal phytase activity was ascertained through enzyme assays conducted across a pH spectrum of 4 to 8, with incremental variations of 1 unit. The phytase activity was meticulously quantified. The buffers employed included citrate buffer (pH 3-6), phosphate buffer (pH 7), Tris buffer (pH 8-9), and carbonate-bicarbonate buffer (pH 10).
Enzyme Stability at Different Temperatures
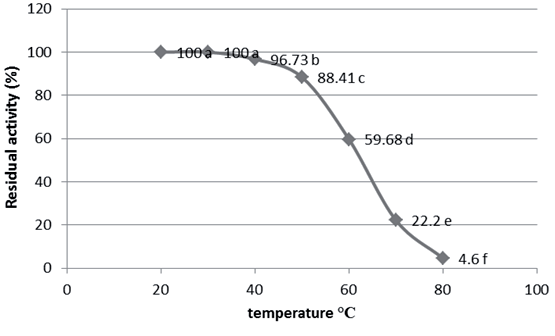
The thermal stability of phytase was assessed by subjecting the enzyme to incubation at a spectrum of temperatures from 20 to 80ºC, with 10ºC increments, and performing the enzyme assay subsequent to a 1-hour incubation period. Phytase activity was also evaluated for a control sample maintained at 4ºC. The residual enzymatic activity was subsequently quantified.
Stability of Phytase at Various pH
The stability of the phytase across a pH spectrum was assessed by quantifying the residual enzymatic activity subsequent to its incubation in various buffer systems ranging from pH 4 to 8, in 1-unit increments, over a period of 1 hour.
Residual activity
Residual activity denotes the percentage of enzymatic activity of the sample relative to the enzymatic activity of the control sample:
Determination of Phytase Enzyme Activity
Enzyme activity assays were performed in accordance with the procedure delineated by [23], albeit with several modifications. The experiments were performed at 37ºC, with enzymatic reactions commenced by the addition of 10 µL of the enzyme to the experiment solutions. The incubation mixture for phytase measurement comprised 350 µl of 0.1 M sodium acetate buffering at pH 5, enriched with 500 nmol sodium phytate, following a 30-minute period of incubation, the released orthophosphate was quantified utilizing an altered molybdate ammonium method [23]. The reaction mixture was subsequently treated by adding 1.5 mL for a stopping reaction. Any resultant turbidity was eliminated using centrifugation before measuring absorbance at 356 nm. A sample with no reaction has been produced by adding the stop solution prior to the introduction of the enzyme to mitigate substrate degradation. Enzyme activity was measured by creating a calibration curve ranging from 100 to 1500 µg/mL of orthophosphate. The activity of the enzyme has been quantified using international standards units.
Method of Phytase
The assay for phytase activity involved incubating 0.1 ml of enzyme extract with 0.9 mL of 2 mM Sodium Phytate in 0.1 M Tris-HCl buffer (pH -7) at 37.5ºC for 15 min. This process was halted by adding 0.75 mL of 5% trichloroacetic acid. The phosphate release was measured at 700 nm following an addition of one ml from the reagent of color, and phytase activity was determined by utilizing a standard curve of phosphate. Phytase activity is defined as the amount of enzyme required to release 1 µmol of phosphate per minute according to specified testing conditions.
In-vivo Experiment
In this study, the viability and effectiveness of phytase post-isolation from microbial sources have been assessed. Twelve male rats (n = 12), each weighing approximately 150-160 g, were employed in the experiment. The subjects were allocated into four groups (three rats per treatment) and administered varying doses of Phytase derived from B. subtilis. The injections were administered five times, at three-day intervals, over a period of 15 days. Blood specimens were collected from the ocular region of each rat every three days and placed on EDTA tubes to measure white blood cell (WBC) counts.
Results and Discussion
Isolating and Detecting B. subtilis
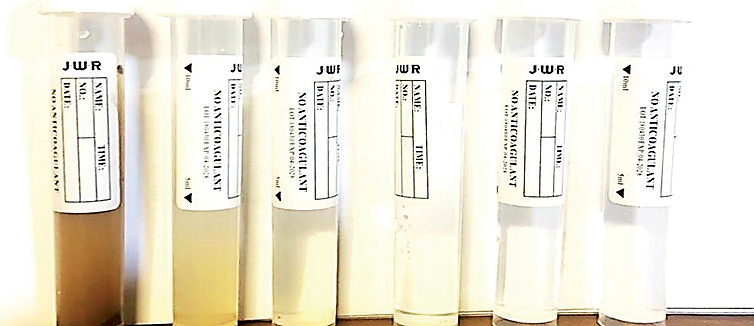
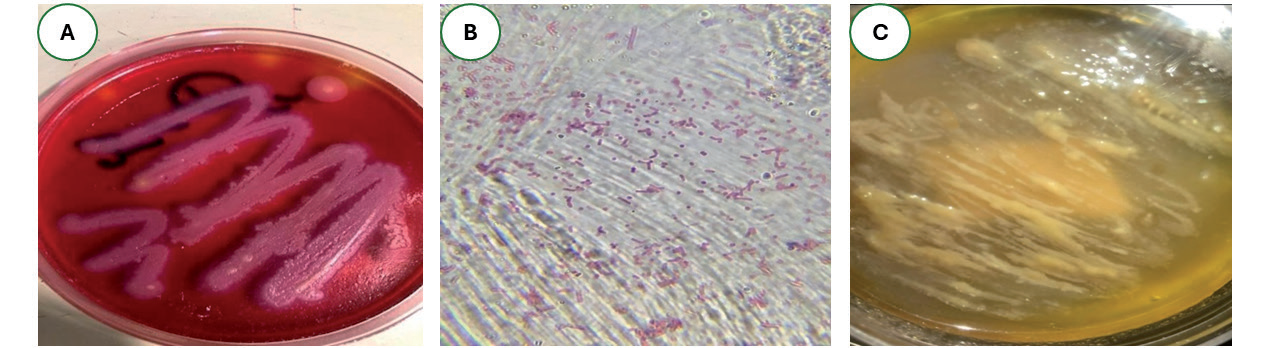
In Fig. 1. we adeptly isolated B. subtilis from diverse soil samples collected in Al-Alam City, Iraq. The proliferation of B. subtilis on selective agar is illustrated in Fig. 2a), its microscopic morphology is detailed in Fig. 2b), and the dimensions of the secreted phytase enzyme are depicted in Fig. 2c).
Phytase Extracted from B. Subtilis
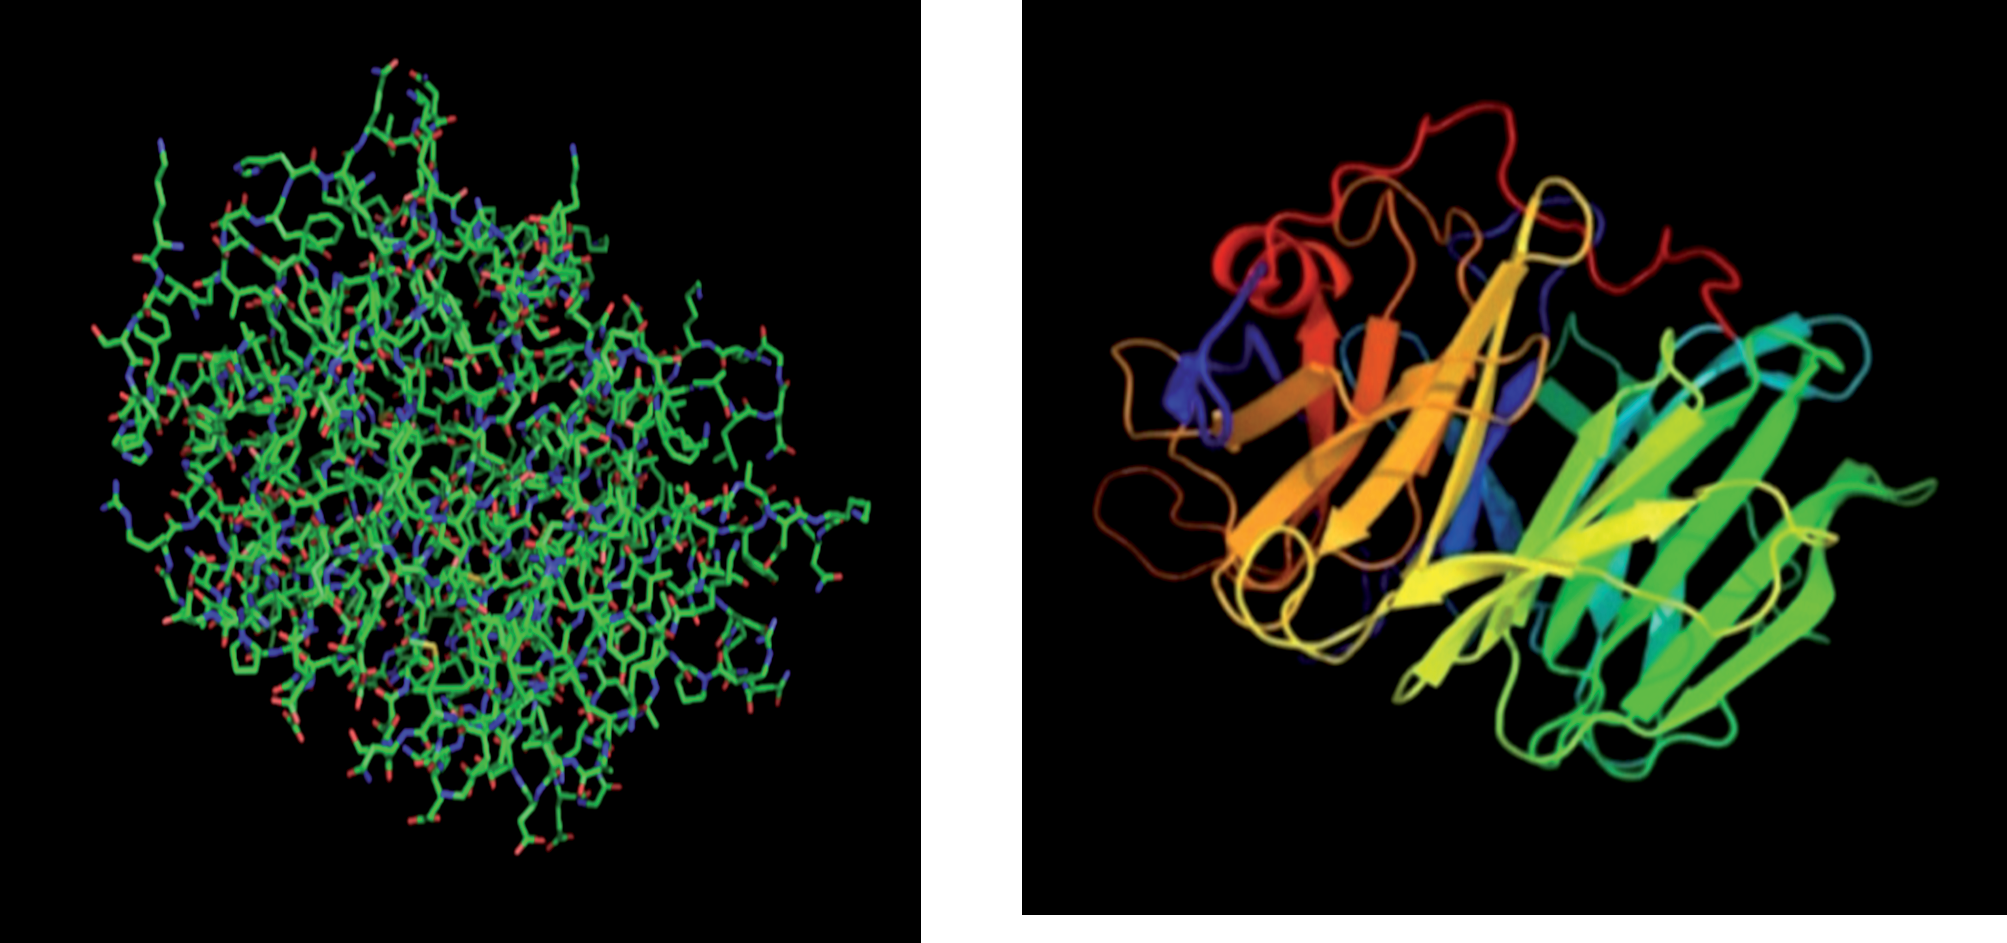
Phytase, a pivotal enzyme, is accruing significant attention for its catalytic prowess. Originating from sources such as B. subtilis, it is acclaimed for enhancing phosphorus bioavailability and mitigating environmental pollution. Recent endeavors have concentrated on the isolation, purification, and description of phytase from Bacillus subtilis, aiming to clarify and utilize enzymes to their full potential. This review delves into the methodologies for extracting and utilizing phytase from B. subtilis, emphasizing its enzymatic attributes and its diverse industrial applications. Fig. 3 illustrates the enzyme’s three-dimensional structure, disclosing its geographic arrangement and essential structural characteristics. The structure-based model, created with Pymol and clarified through sophisticated techniques like X-ray crystallization, offers comprehensive insights into the enzyme’s active regions and catalysis domains, crucial to phytate-degradation activity (HPLC Lab, Nineveh Governorate, Mosul, Iraq).
Molecular Density for Phytase after Purification
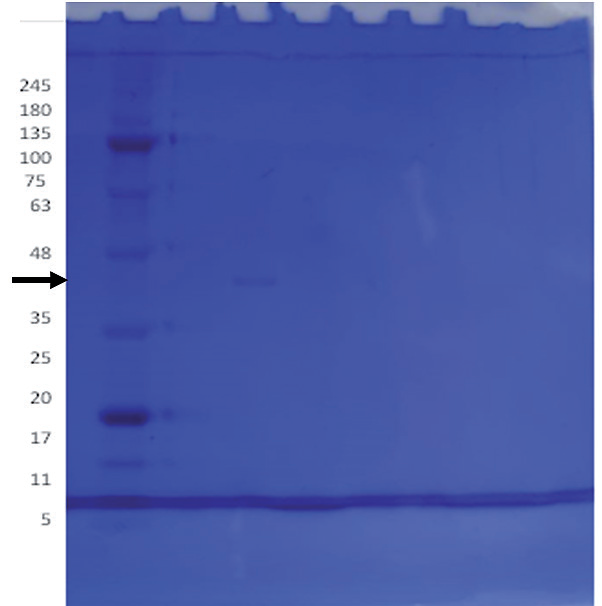
The isolated phytase has been analyzed utilizing SDS-PAGE electrophoresis and Coomassie brilliant blue staining. This technique is essential for determining the molecular density of the enzyme component and assessing the purity of it. The total molecular weight of the purified phytase was determined to be around 40 kDa (Fig. 4). The HPLC chromatogram confirms the existence and clarity of the obtained phytase from B. subtilis (Fig. 5).
Characterization of Enzyme
Effect of Reaction Time on Phytase Enzyme Activity and Stability
The results depicted in Fig. 6 illustrate the influence of reaction time on phytase activity. The enzyme activity exhibited a positive correlation with the duration of the reaction, escalating until a plateau was attained between 20 and 30 minutes, at which point the phytase activity stabilized at 0.91 u/mL.
Huang et al. [24] posited that the temporal scale is a critical determinant of enzyme activity, advocating for methodologies involving brief incubation periods to accurately assess enzymatic function. Furthermore, the brevity of phytase activity duration is pivotal in its industrial applications.
Fig. 3.
The three-dimensional representation of the enzyme of phytase, clarifying its geographic arrangement and essential structure characteristics. The structure of the model, created using Pymol software, was obtained utilizing advanced techniques like X-ray crystallography. This model offers an in-depth comprehension of the enzyme›s active locations and catalyst domains crucial to phytate-degradation activity.
Optimal Temperature for Phytase Activity
The data presented in Fig. 7 demonstrate that the phytase exhibited activity across an extensive incubation temperature range (20-50ºC). The enzyme achieved peak activity of 0.83 unit/ml at 30ºC, with subsequent activity of 0.81 and 0.78 unit/ml at 35ºC and 40ºC, respectively, showing no differences among these values. Notably, the phytase maintained activity even at 50ºC, yielding a measurement of 0.48 unit/ml.
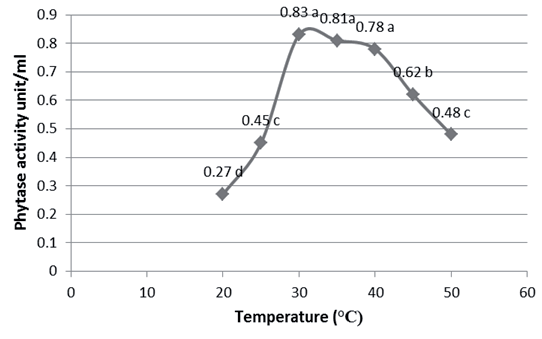
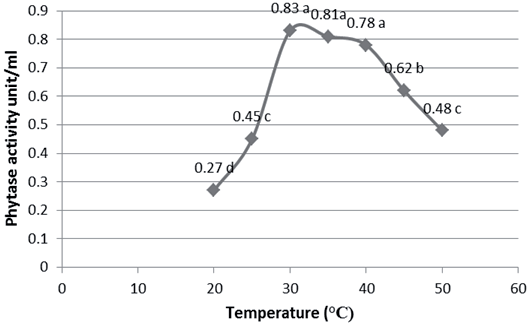
Fig. 5.
HPLC a chromatography demonstrating the detection and clarity of phytase isolated from B. subtilis.
Enzymes have an optimum degree of temperature that is equal, more or less than the temperature that includes them. The velocity of enzyme interaction with temperature increases when it reaches the optimum degree of interaction. Then it declined gradually. This can be attributed to the process of reducing or destructing the enzyme molecule, and this decline in the degree of interaction leads to the reduction or loss of the enzyme activity. This decrease can be construed (explained) by the influence of high temperatures on the state of ionization of the groups found on the enzyme surface and its substrate. The enzymes are complex protein molecules whose catalyst activity is affected by regular tertiary structure. High temperature changes the enzyme structure, which causes the loss of its activity [25].
Thermostability of Phytase
The results illustrated in Fig. 8 from the temperature stability studies of phytase suggest that the enzyme exhibits remarkable thermal stability across a broad temperature spectrum (20-60ºC) for one hour, with over 50% of its relative activity preserved post-incubation. Notably, even at 70ºC, 22.2% of the activity was retained after one hour. Complete phytase activity was observed at 20ºC and 30ºC. Based on these findings, it can be inferred that the phytase isolated from B. subtilis demonstrates thermostability up to 60ºC.
The diminution of enzymatic activity with rising temperature may precipitate the denaturation of the enzyme by disrupting its tertiary structure, thereby altering the conformation of the active site and leading to enzyme inactivation at elevated temperatures [26]. Temperature can affect the protein structure by cleaving the bonds that stabilize its secondary and tertiary conformations, resulting in denaturation [27].
Optimal pH for Phytase Activity
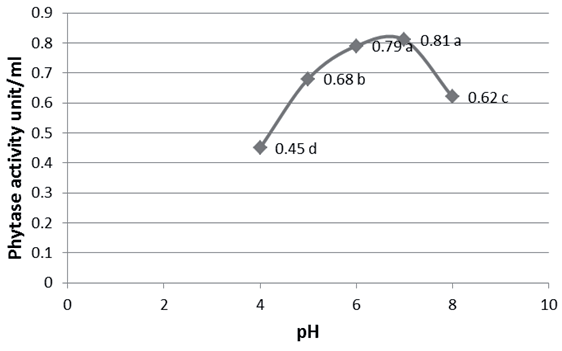
The data presented in Fig. 9 demonstrate that the phytase exhibited activity across an extensive pH spectrum (4-8), with peak enzymatic activity of 0.81 unit/mL observed at pH 6, and a subsequent measurement of 0.79 unit/mL at pH 5, with no differences detected between these pH conditions.
The pH of a solution can significantly influence the structure and functional dynamics of enzymes, as it affects the ionization state of both acidic and basic amino acids. Acidic amino acids possess carboxyl functional groups in their side chains, while basic amino acids contain amine functional groups. Alterations in the ionization state of these amino acids can disrupt the ionic bonds crucial for maintaining the enzyme’s three-dimensional conformation, potentially leading to changes in protein recognition or loss of enzymatic activity. Furthermore, pH fluctuations may not only modify the enzyme’s conformation but also impact the substrate’s shape or properties, which could impair substrate binding to the active site or hinder the catalytic process [28].
Stability of Phytase at Different pH
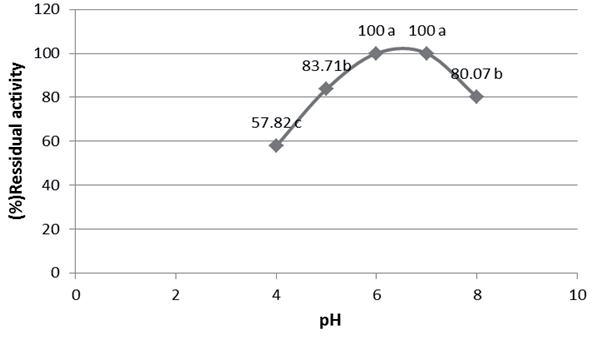
The data elucidated in Fig. 10 reveal that the enzyme exhibited complete stability at pH 5 and 6 following one hour of incubation at 37ºC. Phytase activity did not exceed 70% at other pH values, thereby indicating that the enzyme maintains functionality across a broad pH range of 4-8.
Masson et al. [27] observed that most enzymes undergo irreversible denaturation under strongly acidic or alkaline conditions. Similar to other proteins, enzymes exhibit stability only within a narrow pH range. Deviations from this range induce alterations in the charges of ionizable residues, leading to modifications in the protein’s tertiary structure and, ultimately, denaturation. The reduction in enzymatic activity under extremely acidic or basic conditions is likely attributable to alterations in the secondary and tertiary structures, as well as the ionic state of both the enzyme’s active site and the substrate [29]. The pH of the enzyme’s buffer can impact enzymatic activity in several ways. Firstly, each enzyme has a specific pH optimum at which it exhibits maximal activity, though it remains stable within certain limits around this optimum. Secondly, enzyme stability may be compromised at extreme pH values, leading to denaturation. Thirdly, the pH of the reaction mixture can influence substrate dissociation, thereby affecting the pH activity curve and the pH optimum. These aspects have been extensively reviewed previously [30].
Effect of B. subtilis Treatment on Wastewater Contaminants from Samarra Pharmaceuticals Company and Baiji Petroleum Refinery
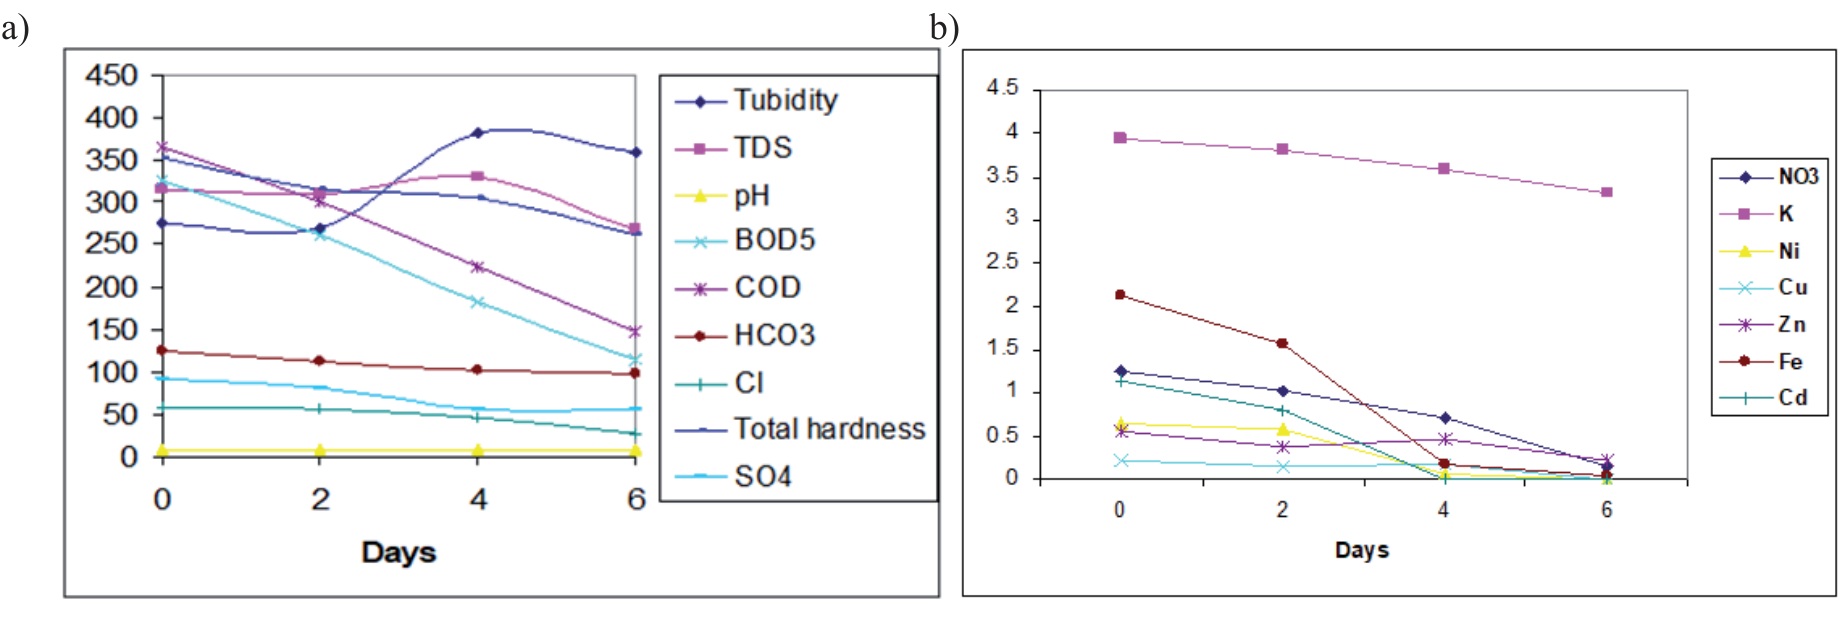
The Samarra Pharmaceuticals company, situated in the city of Samarra, around 125 kilometers north of Baghdad, manufactures approximately 310 medications, encompassing antibiotics as well as additional medicinal forms like syrups, drops, powder materials, suspensions, tablets, creams, ointments, and syringes. The factory began operations in 1970 and was staffed by 2,045 individuals until the beginning of 2004. An evaluation of the factory’s effluent quality and volume indicated a median discharge rate of 18.7 m³/hr, with BOD5 and COD values between 180-400 mg/I and 400-1100 mg/I, correspondingly. The Baiji Petroleum Refinery is located 5 km farther north of Baiji town and roughly 246 km north of Baghdad, representing one of the country’s most pivotal industrial projects. Established in 1980, this facility plays a critical role in local petroleum product consumption and the export of surplus resources. Employing a workforce of 8000, the refinery operates across six primary sections, each subdivided into key subsections. Notably, the production section poses direct and indirect chemical pollution risks. Wastewater treatment studies using B. subtilis (Table 1 and Fig. 11 for Samarra Drugs Factory; Table 2 and Fig. 12 for Baiji Refinery) demonstrated reductions in BOD5, COD, nitrate, Cu, Zn, Ni, Cd, and Fe concentrations, particularly after a 6-day inoculation period with B. subtilis. Specifically, reductions of 64.9% and 56.4% in BOD5 were observed for wastewater from both Samarra Pharmaceuticals Company and Baiji Petroleum, with corresponding reductions of 60% with 54% in chemical oxygen demand from the same sources.
Table 1.
The different water variables of Samarra Drugs Factory during various experimental periods.
Fig. 11.
Analysis of wastewater from Samarra Pharmaceuticals Company conducted at two-day intervals throughout a six-day period.
Phytases with diverse molecular masses have been identified from various sources. Reports have documented phytases with molecular weights ranging from 36 to 40 kDa [31]. Furthermore, phytases with molecular masses of 200 and 92 kDa have been isolated from Aspergillus niger [32] and Aspergillus fumigatus [33], respectively. The biochemical oxygen demand over five days (BOD5) is a critical metric for evaluating water quality; elevated BOD5 levels signal an excess of organic matter that can deplete oxygen and induce anaerobic conditions detrimental to aquatic organisms. The initial BOD5 measurements in the samples surpassed acceptable thresholds, posing significant risks to aquatic ecosystems. The accumulation of organic matter can also facilitate the buildup of toxic compounds, further exacerbating the decline in water quality.
In an investigation involving wastewater from the Samarra Drugs Factory, the introduction of Bacillus subtilis led to a substantial diminution in BOD5 levels. The most pronounced reduction of 64.9% was recorded after 6 days of inoculation, exceeding the reductions of 45% and 20% observed after two and four days. For wastewater from the Baiji refinery, B. subtilis effectively reduced BOD5 levels, with a maximum decrease of 56.4% after 6 days, above the reductions of 339% and 5% observed after both four and two days, correspondingly. The chemical oxygen demand test, an expedient analytical technique for measuring organics material in wastewater via an effective oxidizer, showed the most COD reduction in Samarra Drugs Factory wastewater transpired after six days of B. subtilis inoculation, attaining a 60% decrease in contrast to 39.1% and 18% decreases after both four and two days, correspondingly. The Baiji Petrochemical effluent demonstrated the highest chemical oxygen demand decrease at 54% during six days of inoculation, compared to a reduction of 28% as well as 6.4% after both four and two days, correspondingly. These findings corroborate the results reported by [34] and [35], highlighting the capability of these bacteria to produce enzymes that degrade complex organic compounds into CO2 and water.
Table 2.
The different water variables of Baiji Refinery during various experimental periods.
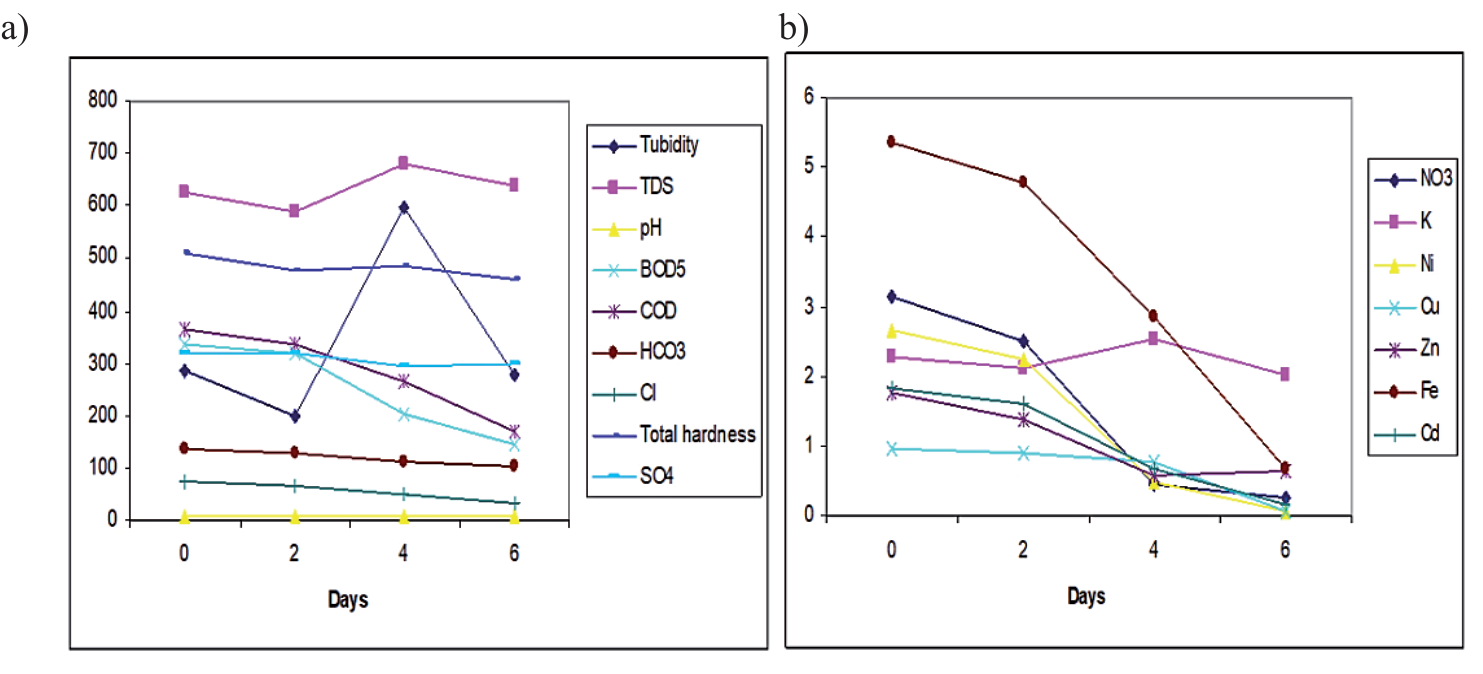
The bacterial strains in the wastewater demonstrated minimal effect on the decrease of both COD and BOD5, as evidenced by the control instance. Pseudomonas sp. and Bacillus sp. exhibited the potential to reduce COC and BOD5 [36]. The concentration of nitrates had been noted to be beneath the limit set by USEPA 2007 standards. Results indicated that Bacillus sp. within wastewater from the Samarra Pharmaceuticals Company attained the highest reduction in nitrates after six days of B. subtilis inoculating, exhibiting an 89% decrease, in contrast to reductions of 42.3% and 18.6% observed the following days, correspondingly. In Baiji Refinery effluent, the maximum nitrate decrease of 91% was achieved during six days of B. subtilis inoculating, above the reductions of 86% and 21% noted during two and four days, correspondingly. This decrease is presumably due to the process of denitrification [37] documented the nitrates-reducing ability of bacterial licheniformis in wastewater from municipalities and found Bacillus sp. as highly efficacious for the reduction of nitrates. In contrast, Bacillus sp. exhibited a reduction in concentrations of copper, zinc, nickel, Cadmium, and iron, with the most decrease observed after six days after treatment.
Effects of Phytase on Immunological Function in Rats
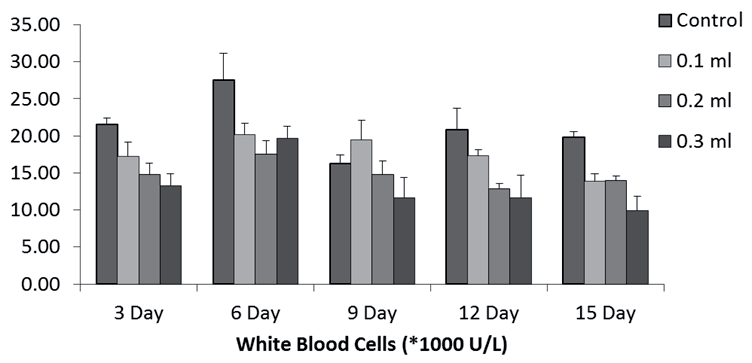
The effects of phytase supplementation on murine leukocyte counts are illustrated in Fig. 13. Rats subjected to phytase treatment demonstrated a pronounced and consistent reduction in white blood cell counts, a phenomenon that correlated with both increased injection concentrations and higher dosage frequencies. It has been postulated that the degradation products arising from phytase-mediated phytate hydrolysis may modulate immune cell activity [38]. Furthermore, phytase could increase immunity in the mucous membrane by improving food absorption for gastrointestinal cells immunity and strengthening mucin preservation [39]. Although [40] reported that exogenous enzymes elevated IgA levels in digesta, available sources on this aspect remain limited.
The implications of both phytase and phytate on immunological parameters are compelling. Research in human studies has elucidated that lower molecular weight inositol phosphate esters play an essential function in controlling vital cellular activities, including protein trafficking and ion channel activity [41], oocyte maturation [42], and cellular differentiation [43]. Furthermore, these esters may enhance immune system efficacy by augmenting immunocyte activity and mitigating pathological calcification [44]. Contrarily, our findings indicate that phytase administration in rats did not result in an increase in lymphocyte count nor an enhancement of immune functionality.
Conclusions
The current study demonstrated that the application of B. subtilis for the treatment of wastewater from the Samarra Pharmaceuticals Company with Baiji Petroleum resulted in a reduction of both chemicals and biological parameters, including COD, BOD5, nitrates, copper, zinc, nickel, cadmium, and iron concentrations. Moreover, the phytase enzyme extracted from B. subtilis was observed to reduce immune parameters in rats, as evidenced by a decline in white blood cell counts. Furthermore, the administration of phytase via injection failed to enhance lymphocyte counts or ameliorate immune parameters in rats. The findings highlight the potential for scaling up B. subtilis-based treatments for industrial wastewater, where its bioremediation capabilities could offer a sustainable and cost-effective alternative to traditional chemical treatments. The use of phytase in wastewater treatment may offer additional benefits in terms of breaking down organic contaminants.

