

Introduction
Cultivated areas are decreasing rapidly due to swift economic, community development, and urbanization [1]. Under this circumstance, more important is to utilize unused resources like brackish water resources, salinized soil land, and desert resources [2], because increasing populations are threatening the agriculture sector with higher food demand [3]. There are many abiotic and biotic factors that are affecting crop growth and production [4, 5]. Among all these abiotic factors, soil salinization, and brackish water irrigation are the major threats that restrict higher food production by reducing land use efficiency and reduction crop production [6, 7]. Every year, 10% of the area is increased with saline alkali soil, but this salinized soil has countless abilities to be developed and utilized [8]. The Tharparker desert is located in an arid and semi-arid region in the Sindh province of Pakistan. The Tharparker region is suffering from soil salinization because of less rainfall and high temperatures that create a higher evapotranspiration rate along with deep brackish groundwater [9, 10]. Crop and vegetation growth in this region is very tough because of the harsh environment along with brackish water irrigation [11-14]. Therefore, renewal of salinized soil and consumption of saltwater resources are current vial needs. Moderation practices such as soil amendment, mulching, land management, substrate drainage, and fertilizer utilization for improving desert soil production have been restrained due to higher costs and low efficiency [15]. Hence, a rational ratio that is effective, low cost, and eco-friendly are instantly required to ameliorate the saltwater effect, promote plant productivity, and restore vegetation in desert soil [16].
Conventional agricultural lands are getting lower and lower day by day [1, 17]. One way to fulfill food demand is to utilize desert lands and brackish water resources for agriculture practices [18]. Deserts are found in regions where the environment is susceptible to climate change and anthropoid manipulation. Groundwater becomes brackish because farmers pump groundwater for irrigation due to this salts invasion in seaside areas or dissolution of minerals in old aquifers [19]. This increasing salinization negatively impacts crop growth [20].
Soil salinity and brackish water irrigation effects on agricultural land are increasing worldwide due to agricultural practices such as irrigation methods and natural phenomena [21]. Brackish water irrigation poses salt effects that create three main threats to plant growth, i.e. oxidative stress, osmotic stress, and ionic stress [22]. Salt stress affects different physiological and metabolic processes of plants in different ways. Plants responses to these salt stresses are often accompanied by a variation of symptoms such as reduction in leaf area, abscission of leaves, higher leaf thickness, mortification of shoot/root, and reduction in plant height [4, 5, 23]. Plants’ responses against salt stress and their successful growth strategies mostly dependant on plant species [24-26]. Many crops, i.e., rice (Oryza sativa L), wheat (Triticum aestivum L), and maize (Zea mays), cannot grow well under salt stress conditions due to being less salt tolerant [27, 28]. These crops reduced yield i.e., wheat, 50 % [29], Maize, 37.8% [30], and rice, 31.3% [31] under 0.3 to 0.5% salt stress [32]. Therefore, amendment in brackish water treatment or saline soil is the first step of desert farming.
There are many cultivation techniques and management practices that have been carried out in desert regions for sustainable agriculture [33]. Engineering methods and reclamation methods have been carried out to overcome salt effects on plant growth [2, 34, 35]. Many soil amendment techniques such as biochar, gypsum, and fertilizer, were used to improve soil fertility and increase plant growth under brackish water irrigation [36]. While these techniques are not easily acceptable for poor farmers because of higher investment, among all techniques to overcome salt effects on plant growth, irrigation management is one of the most effective strategies in desert farming [37].
Using different irrigation strategies along with different percentages of brackish water irrigation, it could help to improve the salt stress tolerance of many crops [38, 39]. Drip irrigation, along with mulching, is the most economical method under saltwater irrigation [39, 40]. There are many things that can be used as mulch like plant straw and snow grass, but more efficient are plastic mulching [41]. Drip irrigation along with plastic mulching reduced salt accumulation near the soil surface, increased water and fertilizer use efficiency, weed control, and produced a higher yield [42].
Sesbania is a widely growing annual shrub. It has the ability to grow under harsh environmental conditions [43]. A large amount of Sesbania is grown in Asia, Australia, and Africa as an important forage crop and green manure because it has the ability to grow under saline and drought conditions [43, 44]. Sesbania is the best forage crop because it contains a high amount of carbohydrates, vitamins, and various minerals. It is also helping to improve soil fertility and remove salt content in the soil. Sesbania is reported as the main crop for improving saline-alkali land [45]. Genetic improvements and cultivation techniques such as planting density and fertilizer application could enhance the growth of Sesbania under brackish water irrigation. Therefore, the objective of this study is to check the survival and growth response of Sesbania under deficit irrigation of brackish water. Furthermore, figure out the best brackish water irrigation regime at which Sesbania plants grow well. This study could provide us with the best irrigation management strategies to grow salt tolerant plants under brackish water irrigation in desert conditions.
Material and Method
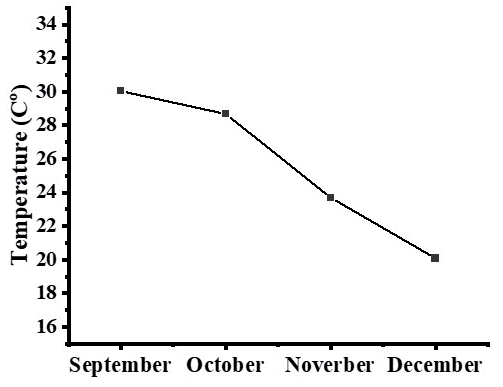
A field experiment took place at the Sindh Engro Coal Mining Company experimental site within Thar Block II, located roughly 10 kilometers away from Islamkot, Thar Parker, Sindh, Pakistan, from September to December 2022. The area is renowned for its extreme weather patterns, enduring extended periods of blistering summers with temperatures soaring to nearly 48ºC and fleeting winters characterized by temperatures dropping to around 8ºC. Annual precipitation in this locale typically averages around 130 mm, while evaporation rates reach approximately 2600 mm annually. The soil within this experimental zone is predominantly composed of arid, sandy terrain, exhibiting minimal nutrient content. The average temperature during the growing season (September to December) is shown in Fig. 1. There is no rainfall during the growing season.
The seeds of the Sesbania plant were bought from a local market. Healthy and equal sized seeds were sown in the field by using one-by-one ft plant-to-plant spacing, and 2.5 ft row-to-row spacing in each plot. Before seed sowing, the field was prepared by adding urea fertilizer at 240 kg/ha [46]. This experiment was arranged in a complete randomized block design with 3 replicates. Every plot has a size of 20x20 ft, and the plant density was 28800 plant/acre. There were a total of 12 plots. The quality of freshwater and brackish water used for this study is shown in Table 1. There are three brackish water treatments and one fresh water (control) treatment given by drip irrigation along with mulching. The experimental design and water treatment details are shown in Fig. 2. Throughout the germination and seedling establishment phase, fresh water was applied for a period of 25 days. To explore the influence of deficit irrigation of brackish water on the growth of Sesbania plants, irrigation was initiated 25 days after seed sowing. Three plots received fresh water as a control, while the other nine plots received three different treatments of deficit irrigation of brackish water.
All drip lines in the drip irrigation treatment plots were connected to the main irrigation pipe and a fertilizer tank. A switch and water meter were installed on the main irrigation pipe to control the amount of water and fertilizer applied. The discharge of drip emitter at the rate of 3 l/hr for this experiment. The total volume of water supply during this experiment under different brackish water and fresh water treatments is shown in Table 2. Sixty times water was supplied in each treatment by using a drip irrigation system during the whole experiment period. In the middle of the experiment, urea was given at a rate of 350 kg/ha as a fertilizer that helped the plant boost its growth under brackish water irrigation.
Table 1.
Water quality parameters.
| Water quality | EC (dS/m) | Total dissolved solid (mg/l) | Nitrate (mg/l) | Nitrite (mg/l) | Chloride (mg/l) |
|---|---|---|---|---|---|
| Brackish water | 4.368 | 6240 | 0.4 | 0.002 | 2231.03 |
| Fresh water | 0.357 | 510 | 0.4 | 0.015 | 196.75 |
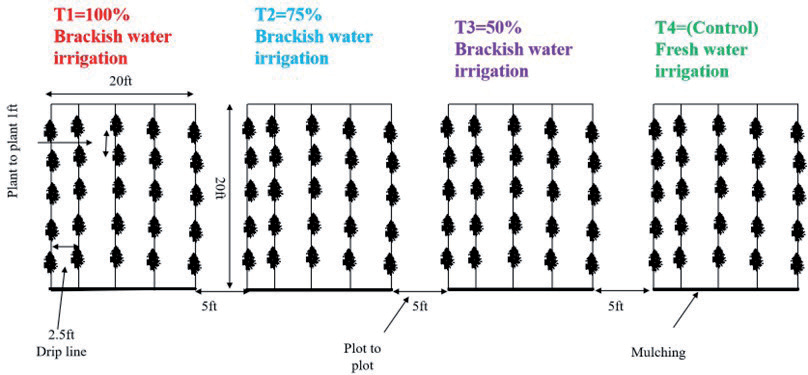
Table 2.
Amount of water given in different treatments of water.
| Treatment | Amount of water (mm/acre) |
|---|---|
| T1 | 600 |
| T2 | 450 |
| T3 | 300 |
| T4 | 600 |
Observation and Measurement
Soil water content (MC), soil temperature (T), and soil salinity (SS) were measured with the ENVI data-DT probe system (ENVI data-DT 1000 series; Beijing Yugen Technology Co., Ltd., Beijing, China). The accuracy of this system is 0.01 m3/m3 for moisture, 0.1oC for temperature, and 10 uS/cm for salinity, respectively. The soil profile was divided into four intervals 0, 20, 40, and 60 cm, and readings were taken of every soil profile interval from October to December during brackish water treatments by using probes installed in the soil profile.
After 105 days of planting, about 5 plants of every treatment per replicate were selected for measurement. The leaf areas of these selected plants were measured with ImageJ software. Leaf chlorophyll content (SPAD) in leaves of Sesbania plants was measured with a portable chlorophyll meter (SPAD; Oakoch OK-Y104, China). Specific leaf area (SLA) was calculated with the help of Equation (1):
These selected plants were harvested to measure plant height and root length by the ruler, then a weight balance was used to measure fresh above ground biomass and below ground biomass per plant. The yield of every treatment was calculated with the help of these fresh above and below ground biomass samples per plant, and multiple per plant biomass into plant density to get yield in Kg /acre. Then these were put into an oven for 40 hours at 72oC to measure their dry weight [47]. After this, dry weight was weighted to measure dry above ground biomass (AGB) and below ground biomass (BGB).
Statistical Analysis
Assumptions of parametric statistics were tested to verify normality and homogeneity of variance using the Shapiro–Wilk normality test and Levene’s test before further analysis. Data were analyzed using one-way analysis of variance (ANOVA) with treatments as the main factor to determine the main effect and interaction effects of each growth trail (P<0.05). Furthermore, a posthoc Tukey test P<0.05 was performed to determine significant differences within treatments (SPSS 22). Graphs were made by using Origin Pro 2021.
Results
Soil Moisture Content, Temperature, and Salinity
The soil moisture content (MC), soil temperature (T), and soil salinity (SS) in different soil profiles were taken of T1 treatment every month during the whole experiment. These parameters were measured only in the T1 treatment because this treatment got 100% brackish water irrigation.
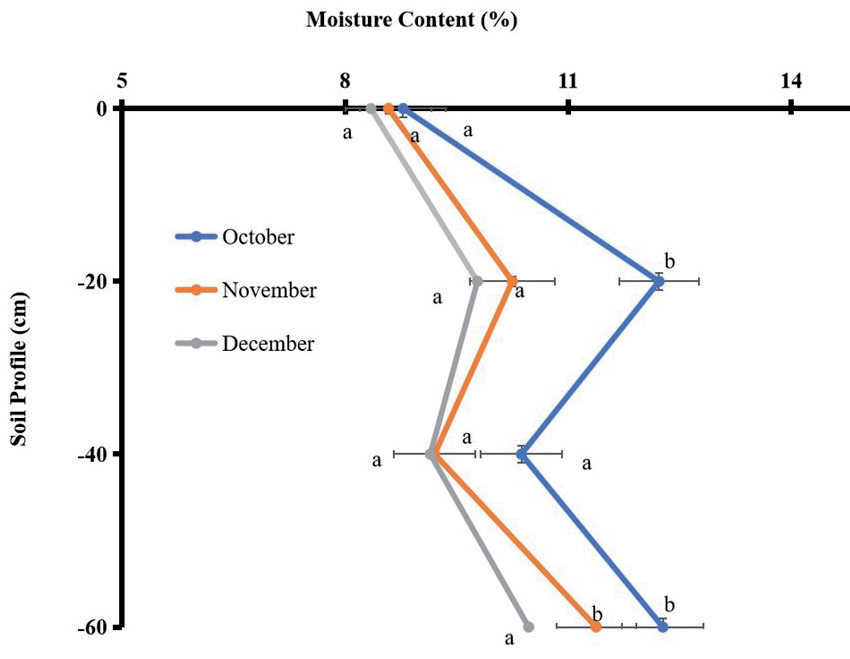
Soil MC was significantly different within months in different soil intervals (F = 6.148, P<0.01), as shown in Fig. 3. In October, MC was increased with an increased soil profile, but this increment was non-significant. In November, MC in the soil profile showed a similar trend, but at 60 cm, MC was significantly different than others at 0, 20, and 40 cm in the soil profile. In December at 20 cm and 60 cm, soil MC were significantly different than 0 cm and 40 cm in soil profile.
SS was also significantly (F = 38.65, P<0.01) different in every month within different soil profile intervals, as shown in Fig. 4. In October, SS was increased with an increased soil profile from 0 to 60 cm, but that increment was non-significant, except 40 cm. In November, there was very little increment in SS from 0 to 60 cm in the soil profile. In December, a significant increment was found from 0 to 60 cm, as shown in Fig. 4, because the temperature is getting cooler and the water requirement of the plant is getting lower. That’s why water is moving below ground with increasing SS.
Fig. 4.
Soil salinity under different soil profile. Different letters indicate a significant difference (P<0.05) between values as assessed by Tukey’s HSD test within Soil profile.
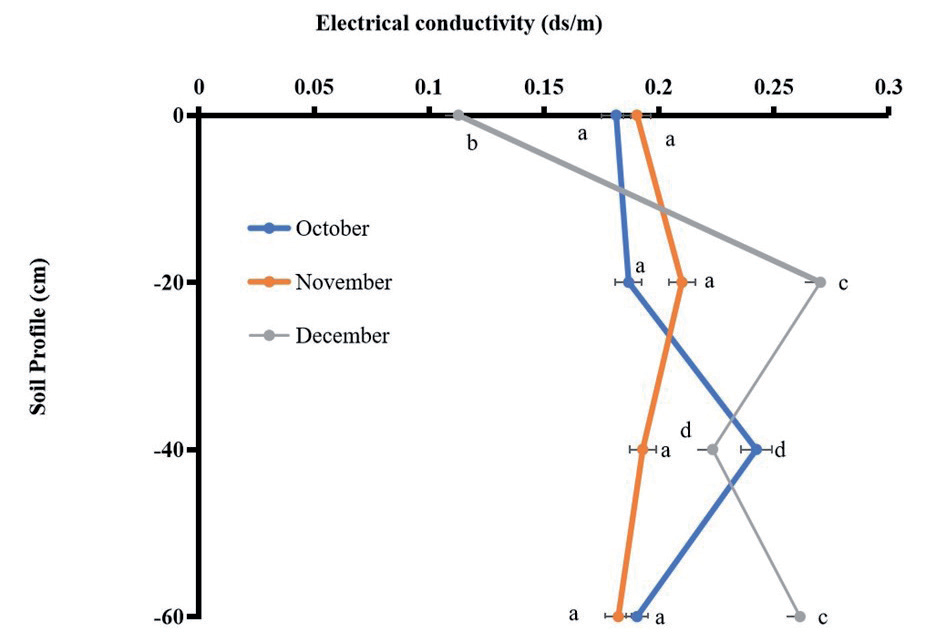
Fig. 5.
Soil Temperature under different soil profile. Different letters indicate a significant difference (P<0.05) between values as assessed by Tukey’s HSD test within Soil profile.
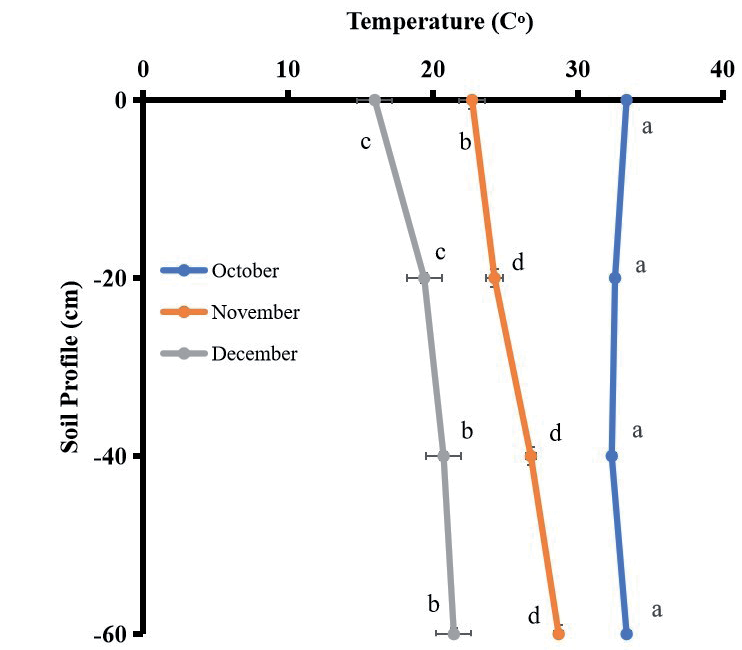
Temperature (T) in the soil profile was significantly different (F = 77.95, P<0.01) in every month within different soil profiles, as shown in Fig. 5. In October, soil T was decreased with an increased soil profile below ground from 0 to 60 cm, but in November and December, soil T was increased from 0 to 60 cm. The T increment in November and December is because the cool wind that’s blowing within these months makes the soil surface temperature cooler than below the surface.
Growth Trails
Yield was calculated with the help of fresh biomass per plant within an acre under each treatment. Deficit irrigation of brackish water treatments was significantly affecting total yield, as shown in Table 3. More yield reduction was found in T1 and T2 treatments. While the T3 treatment yield was also significantly different from control T4. AGB (F = 62.29, P<0.01) and BGB (F = 7.41, P<0.05) were also significantly different under these treatments. More reductions in AGB and BGB were found under T1 and T2 as compared to T3. AGB and BGB under T3 were non-significant with control T4. Root-to-shoot ratio was significantly (F = 37.63, P<0.01) different under these treatments, as shown in Table 3. The root-to-shoot ratio was decreased from T1 to T4 treatments, which shows due to the high number of salts in the root zone decreased water movement from root to shoot by reducing shoot length.
Chlorophyll Content and Specific Leaf Area
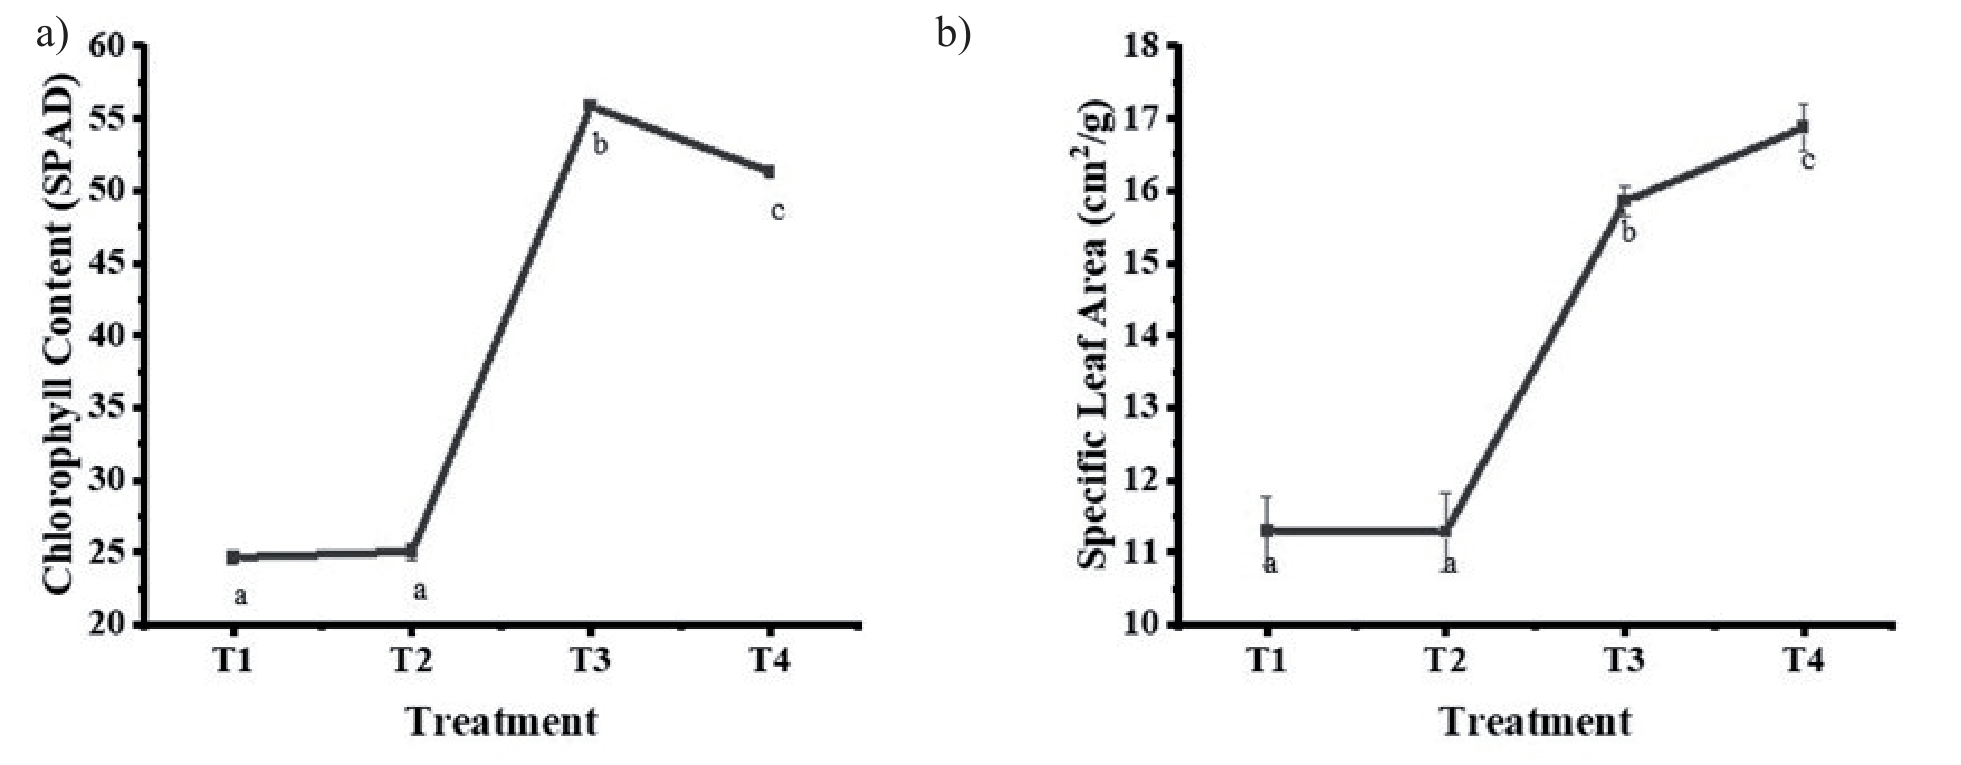
Deficit brackish water irrigation significantly affects chlorophyll content ((F = 39.91, P<0.01)) and SLA (F = 51.71, P<0.01). SLA and chlorophyll content were very lower at T1 and T2 treatments, but non-significant between these treatments, as shown in Fig. 4. At T1 (100% brackish water irrigation) and T2 (75% brackish water irrigation), SLA and chlorophyll content were reduced more as compared to T3 (50% brackish water irrigation), as shown in Fig. 6a) and 6b). These results show that the Sesbania plant has the ability to grow under drought conditions.
Plant Height and Root Length
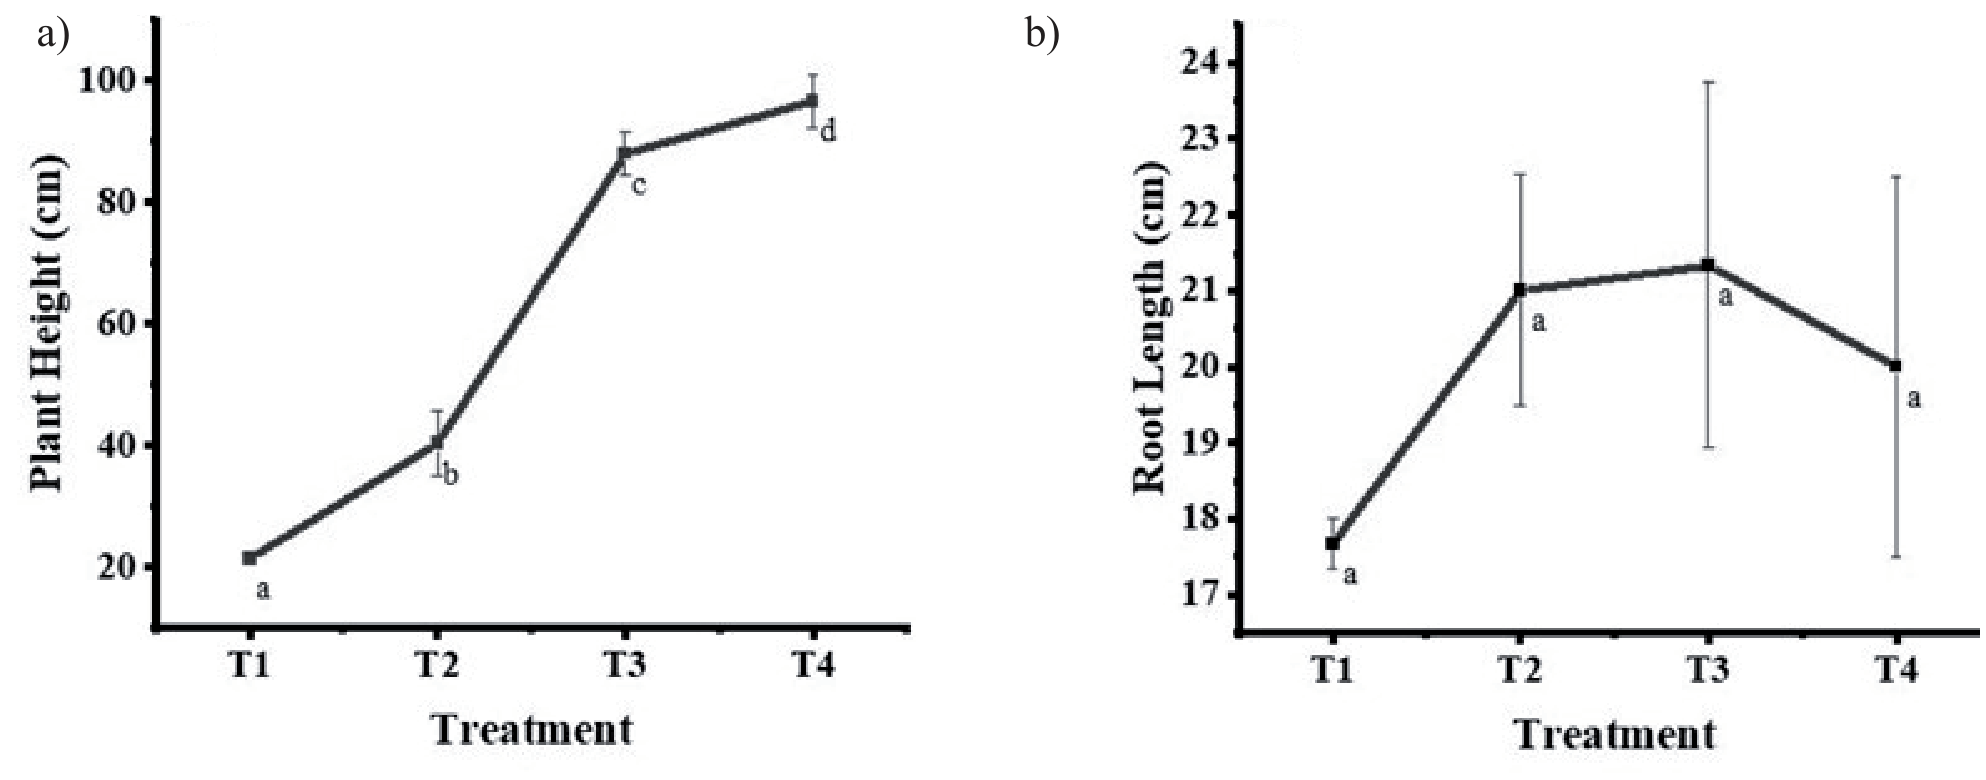
Plant height was significantly different (F = 86.02, P<0.01) within deficit brackish water irrigation treatments. A more significant reduction in plant height was found in T1 and T2 as compared to T4. Plant height was also reduced in the T3 treatment, but the reduction was under the acceptable range for deficit brackish water irrigation, as shown in Fig. 7a). Root length under these treatments was reduced, but this reduction was non-significant (F = 0.753, P>0.05). Root length at T2 and T3 was higher than T4 (Control) to show the plant spent more resources to sustain its growth under these saltwater conditions, as shown in Fig. 6b).
Discussion
Soil Temperature, Moisture Content, Soil Salinity, and Brackish Water Irrigation
The soil T in October was decreased with an increased soil depth from 0 to 60 cm. In October, the temperature was higher because of the small vegetation cover that allowed solar radiation to affect the soil surface [48]. Environmental factors like wind, solar radiation, and soil cover directly affect soil surface [49], but these factors get lower with increasing soil depth and become stable due to the soil temperature in deeper soil being lower in October, as shown in Fig. 5. In November and December, soil T decreased with an increased soil depth because higher vegetation cover reduced the effect of solar radiation on the soil surface [14, 50]. Furthermore, cool wind below in November and December in the Thar desert also reduced soil surface T by weakening turbulence development and inhibiting evapotranspiration from plant and ground surfaces [51, 52]. Compared with top soil temperature, below ground temperature is higher because decreasing transpiration and evaporation processes resulted in higher permeability [14].
Table 3.
Growth response under different water quality treatments.
Soil MC described an S-shape distribution that showed with increasing soil profile MC was increased, then decreased, and again increased, as shown in Fig. 3. Soil MC was significantly different every month. The soil MC at the soil surface was lower than below ground soil, indicating that a higher evaporation rate at the desert soil surface due to higher temperature and fast wind speed that decreased MC in the soil surface [53]. The influence of temperature, wind, and other environmental factors decreased with the increasing soil profile due to this MC, with increasing soil profile being higher as compared to soil surface [54, 55]. The top dry sandy soil layer can help to protect against loss of deep soil water, which is conducive to protective infiltration water [54, 56]. While deep soil has more clay particles, a dense structure, and more effective water conservation [14]. The soil MC decreased at 0 cm and 40 cm because the roots of Sesbania were mostly lying within the 17 to 25 cm soil layer, and roots absorbed water for plant growth development within these areas due to MC in these areas being reduced. [35] also finding similar results related to root length and soil MC under different quality of water irrigation.
Total SS in the soil profile showed different results. SS decreased at the soil surface, increased at 20 cm, and decreased at 60 cm in the soil profile in the months of October and November, as shown in Fig. 4. Due to the higher amount of evaporation on the soil surface because of the higher temperature and fast wind, this is the main reason for increasing SS on the soil surface [57]. On the other hand, SS at the soil surface is decreasing in December because of higher vegetation cover on the soil surface transferring salts into plant upper parts through the osmotic process [4, 23, 25]. The stem flow of salt tolerant plants such as Sesbania can take away the salts and reduce salts in the topsoil layer [12]. SS and soil MC are also affected by soil electrical conductivity [58]. According to the theory, soil electrical conductivity can be affected by water content because salts come with water and go with water [59]. However, soil MC increased with increased soil profile; furthermore, it can be speculated that SS in soils, influence on soil electrical conductivity plays a significant role.
Brackish Water Irrigation and Growth Response
In this present study, plant growth and physiological traits of Sesbania were significantly effective by deficit brackish water irrigation, as shown in Table 3. Deficit brackish water irrigation (T1, T2, and T3) has a significant effect on growth traits as compared to freshwater irrigation (T4) (Table 3). Brackish water irrigation reduces soil salinity on a temporary basis on the soil surface. While soil salinity comes again to the soil surface by continued use of salt water for irrigation [41, 60]. The salt accumulation on the soil surface is mainly dependent upon the amount of salt present in irrigation water and the irrigation water amount [47]. Therefore, to avoid accumulation of salts on soil surface deficit brackish water irrigation is better as compared to 100% brackish water irrigation [61]. The increased concentration of salts in the soil surface has resulted in a decrease in plant fresh weight and dry weight [2]. During salinity stress application, a high concentration of sodium accumulates around the root zone, creating an antagonistic effect on potassium. This results in potassium deficiency, thereby causing a reduction in shoot fresh and dry weight [62]. In this study, plant fresh and dry weight at T1 treatment decreased as compared with T3, which agreed with previous research findings [63, 64]. Plant growth response to brackish water irrigation is very complex [65]. Saltwater irrigation first mainly affects root length. Root length and root fresh weight were decreased due to osmotic pressure, and water uptake was also decreased due to the higher amount of salts in the irrigation water [66]. Root length also transferred a large amount of salts into the plant leaves that stopped the photosynthesis process by closing the stomatal conductance to avoid water loss, and finally the growth of the plant was reduced [4, 5, 22, 38, 61].
It was reported in a previous study that the growth of plants increased by improving root activity, chlorophyll content, and photosynthesis activity under deficit saltwater irrigation [67].
According to the result of this study, AGB, BGB, root-to-shoot ratio, and total yield at T3 were significantly higher than T1 and T2, indicating that the Sesbania plant has the ability to bear less frequency of saltwater irrigation and maintain its growth [46].
Chlorophyll content is the key color agent responsible for photosynthesis [47]. The chlorophyll content is a good indicator of the photosynthesis process under salt stress conditions. Several studies described that chlorophyll content values increased or remained unchanged mostly in salt tolerant plants under salt stress conditions [68-70]. While in salt sensitive plants its value was decreased. In this present study, chlorophyll content values were decreased in T1 and T2 more than in T3, as shown in Fig. 6a), indicating that the Sesbania plant can survive its growth in deficit brackish water irrigation. This chlorophyll content value also described that the Sesbania plant also has the ability to grow under drought conditions [68]. Decreased production of these pigments under saltwater irrigation is considered to be a result of the slow breakdown of leaf cells [64]. Cell elongation and development inhibition resulted in a decrease in leaf area, SLA, and finally growth as shown in Fig. 6b). At T1 and T2, the higher frequency of brackish water irrigation creates osmotic stress between plant roots and plant leaves due to this photosynthesis process being effective [22]. Due to the osmotic stress, a large number of salts were present in leaves, and water deficiency was produced because plants stopped getting water from roots [21]. In this situation, plants trying to close in stomata due to this transpiration, inter-cellular CO2 concentration reduces, and finally, plant height is reduced, as shown in Fig. 7a). When osmotic stress reached threshed values, then plant roots stopped uptake water and plant growth was effective [63]. In the present study, 80% yield at T1, 70% yield at T2, and 15% yield at T3 were reduced as compared to T4. This indicates the Sesbania plant has the ability to sustain its growth under deficit brackish water irrigation.
Conclusions
Overall, the results showed that brackish water irrigation decreased the growth of Sesbania plants as compared with freshwater irrigation. The negative effects of 100% brackish water irrigation were greater on the growth of Sesbania plants as compared with 75% and 50% deficit irrigation of brackish water. It was concluded that 100% irrigation of brackish water creates a higher amount of salts in the root zone and plant leaves. The longer the duration of brackish water irrigation, the higher the area of salts present around the root zone. Therefore, deficit irrigation of brackish water is the better choice of irrigation in the desert region to promote the growth of Sesbania plants because of its salts and drought tolerant ability. This study provides us with an optimal strategy to utilize brackish water resources in the desert region to get production with the least reduction in yield.

