

Introduction
Sediment transport analysis, also known as sediment conveyance analysis, is a critical and essential component of any river or waterway-crossing design project. Due to the continuous processes of erosion and deposition, sediment in rivers originates from the watershed. Sediment is categorized into cohesive sediment, such as clay, and non-cohesive sediment, such as sand and coarse sediment. With the increasing impact of human activities and the influence of climate change, the balance of sediment in rivers, coastlines, and lakes has faced unprecedented disruptions [1, 2]. For instance, activities such as upstream soil erosion, dam construction, and river dredging not only alter the sources and supply of sediment but also affect the transport pathways and rates of sediment in water bodies [3]. Particularly in the agricultural sector, the transport process of sediment has significant implications for soil erosion, soil conservation, and the design and management of irrigation systems.
The airlift pump, a device transporting fluidized slurry by immersing and conveying it within a vertical pipeline, finds extensive applications in sewage treatment, aquaculture, mining, chemical industry, and agriculture [4, 5]. In research on airlift pumps, many studies focus on their performance under two-phase flow operating states [6-11]. However, for airlift pumps transporting solid particles, theoretical analyses mostly concentrate within the pipeline, with limited exploration of the external flow field. Hatta et al. conducted theoretical analyses of multiphase mixture flow characteristics inside vertically fixed airlift pipes [12]. By analyzing existing two-phase flow theories, they developed a model for gas-liquid-solid three-phase flow by coupling the momentum equation of two-phase flow with the motion equation of individual solid particles, yielding the fundamental characteristics of typical airlift pumps, disregarding air compressibility. Yoshinaga and Sato performed airlift experiments with uniform and non-uniform spherical particles, altering lifting pipe diameter, particle size, and submergence ratio, and established a gas-liquid-solid three-phase flow model based on the momentum equation [13]. Hu et al. discovered that while altering air intake minimally affects the liquid lifting flow rate [14, 15]. It significantly boosts solid lifting flow rate and efficiency, echoed by similar studies by Tang et al. [16-18]. Fujimoto examined local bends’ effect on gas-liquid-solid three-phase flow characteristics, concluding that bends below the air inlet least affect pump performance [19]. Alasadi and Habeeb, integrating experimental and numerical research, compared airlift pumps with traditional and improved air injection devices [20]. Similarly, Wahba et al. explored various models from one-dimensional to Large Eddy Simulation (LES) [21]. Deendarlianto et al. utilized a microbubble generator-type airlift pump system to lift solid particles, noting a 17% performance increase compared to traditional systems [22-24]. Shimizu and Takagi built a 200 m-long airlift pump facility, studying its performance with water and highly viscous shear-thinning slurries [25]. Nigardsoy et al. investigated airlift pumps’ self-cleaning capability with U-shaped bends, showing effectiveness for particle concentrations up to 70% of the bend’s cross-sectional area [26]. Rim et al. numerically analyzed steady-state gas-water-solid three-phase flow and water-solid two-phase flow in airlift pumps, validating the model in a 7.86 m vertical pipeline and extending it to deep-sea mining [27]. Abed and Ahmed explored pulsating air injection effects on airlift pump performance, suggesting frequency optimization under varying submergence ratios [28]. Chladek et al. investigated gas flow rates’ effect on solid mass flow rate and pipeline pressure drop in vertical airlift pipes, constructing a state diagram to depict their relationship [29]. In conclusion, scholars’ research on airlift pumps primarily focuses on evaluating their performance under two-phase flow operating states. For airlift pumps transporting solid particles, most studies concentrate on theoretical analyses within the pipeline, with limited research on the external and bottom flow fields. Furthermore, scholars often conduct experiments by supplying sediment through pipelines. Although this method is convenient, it cannot control the state of sediment at the pool bottom, significantly affecting the accuracy of experimental results. Therefore, this study adopts the method of laying sediment at the pool bottom to supply sediment. Before the experiment, the water in the experimental pool is drained, and the sediment is manually spread on the pool bottom to better simulate the pressure-holding effect of water on sediment in reality. Nevertheless, current research on airlift pumps mostly focuses on the pipeline, with limited exploration of sediment influence at the bottom. The research results will help to further understand the application potential of pneumatic pumps in engineering, provide new solutions to solve the problem of sediment accumulation in water bodies, help to reduce the interference to the water ecosystem, protect the living environment of aquatic organisms, and maintain the ecological balance of water bodies, which is of great significance for the sustainable development of the environment.
From the perspective of sediment transport analysis and combined with the application of airlift pumps in engineering, this research explores the relationship between sediment transport and airlift pump technology. It aims to provide theoretical support and practical guidance to promote the sustainable utilization of water resources and the protection of water environments.
Material and Methods
Experimental Conditions
All experiments were conducted using river sand particles, air, and water as the working fluids, under atmospheric pressure and at a room temperature of 24ºC. Further detailed information regarding these experimental conditions is summarized in Table 1.
Experimental Setup
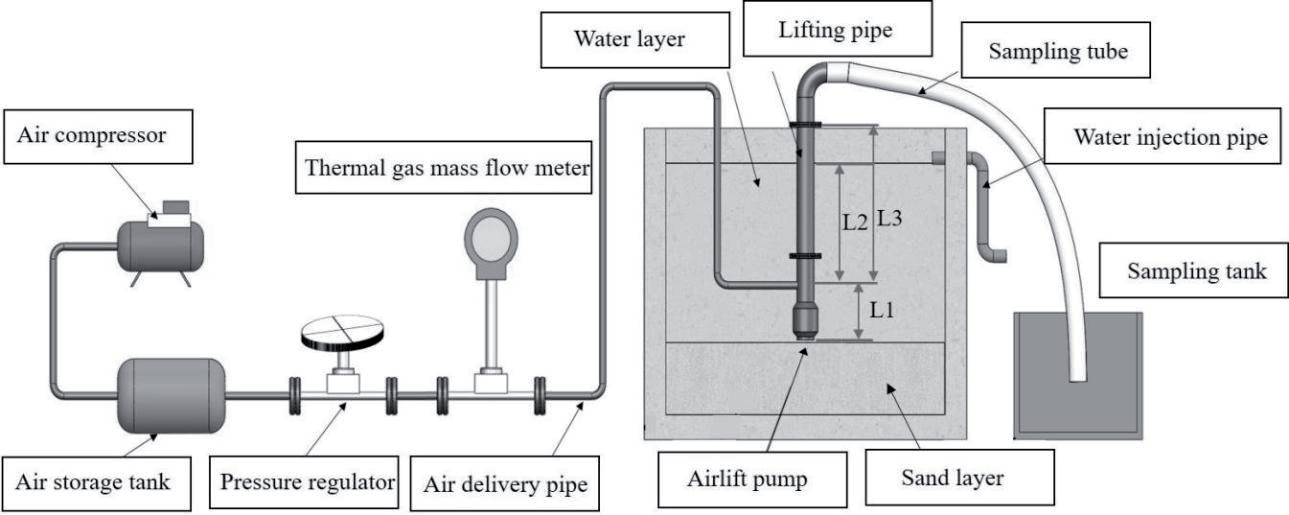
The experimental setup depicted in Fig. 1 illustrates the apparatus for the airlift system. It comprises an airlift pump, a lifting pipe, an air supply pipe, a water supply pipe, and a slurry delivery pipe. The airlift pump features a suction port with a 70 mm diameter at its base and a flange structure at the upper- end for seamless connection with the lifting pipe. The lifting pipe, made of standard seamless steel pipe SCH20 with dimensions of 110 mm outer diameter, 100 mm inner diameter, and 2000 mm length, ensures stable flow conditions during experimentation. Its lower end connects to the airlift pump via a flange, while the upper end links to the outlet sampling pipe. To facilitate observation of the airlift pump’s bottom flow field and post-operation sand pit morphology, the experimental setup includes a 3800 mm×2520 mm×3000 mm (length×width×height) test pool filled with approximately 400 mm thick river sand, as specified in Table 1. Before commencing experiments, the submergence ratio is set by adjusting the pool’s water level via a water injection pipe. The submergence ratio is defined as γ = L2/L3, as illustrated in Fig. 1. Positioned above the pool is a three-axis (X, Y, Z) moving platform allowing controlled movement of the lifting pipe and airlift pump in three dimensions using screw drive mechanism vxyz = 4.5 mm/s. The airlift pump can move linearly at a constant speed along both horizontal and vertical directions. Compressed air, provided by two M40A screw air compressors and stored in an air tank, is regulated for precise adjustment of the airflow rate using a thermal gas mass flow meter and a pressure regulating valve installed on the air pipe at the airlift pump inlet. Subsequently, air is injected into the airlift and mixed with water in the lifting pipe. The resulting gas-liquid-solid three-phase mixture flows upward in the lifting pipe and is discharged into the sampling trough via the sampling pipe. Within the sampling trough, air is separated from the liquid-solid mixture and released into the atmosphere to complete the sampling process. Throughout the experiment, the water level is meticulously adjusted using the water injection pipe and the three-axis (X, Y, Z) moving platform to maintain an almost constant submergence ratio. This comprehensive setup constitutes the experimental platform for airlift pumping with a lifting pipe diameter of 100 mm.
In the experiment, the submergence ratio can be controlled within the range of 0.5 to 0.8, while the air intake can vary from 0 to 240 m3·h−1. To obtain the inlet air flow rate accurately, a thermal gas mass flow meter (model: JL-LDR-80) with an accuracy of ±1.5% is installed near the airlift pump. The JL-LDR thermal gas mass flow meter operates based on the principle of thermal conduction for flow rate measurement. It employs a bridge loop, with one sensor measuring the flow temperature and another sensor maintaining a constant temperature difference higher than the fluid temperature, allowing for precise flow rate measurement even under high-temperature and high-pressure conditions.
Experimental Methodology
The experimental process is as follows:
1. Before commencing the experiment, thorough consideration is given to the confining effect of deep water on sediment particles. To closely simulate real-world engineering conditions, a sand supply method akin to practical scenarios is employed. Initially, experimental river sand is meticulously spread across the bottom of the experimental water tank, forming a sand layer approximately 400 mm thick, as depicted in Fig. 1. To ensure that the pump bottom remains parallel to the sand surface throughout the experiment, an experimental auxiliary apparatus is employed. The X-axis of the three-axis (X, Y, Z) moving platform is maneuvered back and forth to address any irregularities in the surface of the sand layer. Additionally, a level is used to verify the evenness, guaranteeing that subsequent sand pit extractions result in a smooth sand pit profile and minimizing experimental inaccuracies.
2. On the fixed frame of the three-axis (X, Y, Z) moving platform, mark the scales for the X, Y, and Z axes to facilitate adjustment of the simulated construction position. Label the positions of the x and y axes for the locations of vertical construction points. Mark the scale position of the z-axis as the position where the bottom of the pump aligns with the sand surface. Then, adjust the Z-axis position to the maximum stroke value. Finally, open the water inlet valve of the water injection pipe to inject experimental water into the reservoir to the appropriate depth. Collaboratively adjust the submergence rate to 0.8 by adjusting the Z-axis position and the water inlet valve.
3. Turn on the air compressor and simultaneously observe whether the air pressure in the air reservoir tank is fully charged. Once filled, adjust pressure regulating valve 3 to stabilize the working pressure required for the experiment.
4. Use the scale markings on the three-axis moving platform and move the airlift pump to the corresponding position to locate the simulated construction point of the airlift pump. Move to the sampling point, and after the pressure gauge on the air reservoir tank stabilizes, take samples at that point.
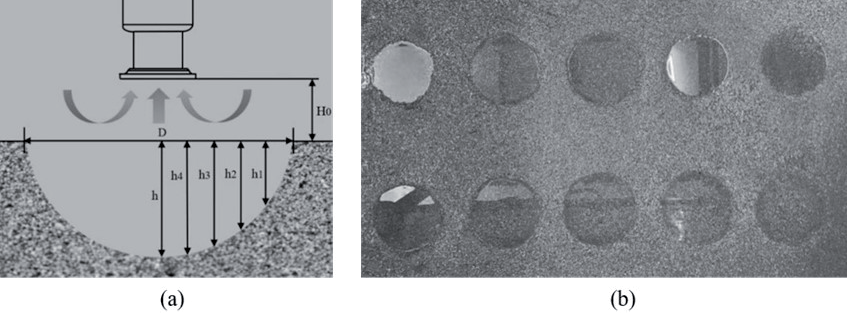
5. Sampling process: Adjust the Z-axis position downward to the position where the bottom suction port of the airlift pump aligns parallel to the bottom sand surface before the experiment starts, even when H = 0, as shown in Fig. 2a). Begin sampling into the sampling trough using the sampling tube. The sampling time is 20 seconds, with sampling for 10 seconds at H = 0, followed by moving the Z-axis downward for another 10 seconds. Immediately after 20 seconds of sampling, move the Z-axis to the top end of the stroke.
6. Continue adjusting the air intake volume to other values of air flow rates and repeat steps (2-5).
7. To ensure that there is no mutual interference between the sampling points, ten samples can be taken at the bottom of the airlift pump for each construction point. After sampling ten points, open the drain valve of the water reservoir tank to drain the water from the reservoir tank. After draining the water from the reservoir tank, ten sand pits are left on the bottom sand layer, as shown in Fig. 2b).
8. Then, measure the morphology of the sand pits. As shown in Fig. 2a), measure the height of the sand pits under the diameter of the sand pits, namely (D/10, h1), (D/5, h2), (D3/10, h3), (D2/5, h4), and (D1/2, h). Where D is the diameter of the sand pit.
9. Repeat the above steps to complete the sampling and measurement of the bottom sand pit morphology for different air intake volumes at submergence rates of 0.5, 0.6, and 0.7.
In addition, the sampling method used in the experiment follows the sampling method employed in practical engineering applications by our research group. Throughout the experiment, to maintain a constant submergence rate, the water level is observed for changes in submergence rate after each sampling. Once the water level is adjusted to be consistent, the next set of experiments begins. To minimize randomness and reduce experimental errors, three sets of samples are taken under identical conditions. After completing each experiment, the position of the sand pit at the bottom is numbered accordingly.
Uncertainty Analysis
This experiment utilizes various techniques to calibrate all measuring devices. Additionally, uncertainty analysis is conducted based on the multivariate Taylor series method. Table 2 summarizes the values obtained through uncertainty analysis.
Theory Analysis
When the compressed air output from the air compressor enters the airlift through the air storage tank and the air delivery pipe, the compressed air is axially jetted out inside the airlift. On one hand, the high-speed airflow exchanges momentum vigorously with the liquid in the delivery pipe, forming a local vacuum at the intake of the airlift; on the other hand, a gas-liquid-solid mixture lighter than water is generated inside the pipe. This continuously extracts loose slurry from beneath the water. As shown in Fig. 2a), the amount of solid particles sucked is determined by the average velocity Vr of water flow through the annular gap between the intake of the airlift pump and the sand bed. When the distance H0 between the suction tube and the working surface is constant, and the average velocity of water flow in the annular space can be determined by the following equation.
The energy change during fluid motion reveals that.
Expressing the velocity in terms of dynamic viscosity μ in both the kinetic and potential energy terms, we obtain
From equations (1) and (2), we obtain
Where Vr is the velocity of the liquid in the pipeline, μ is the dynamic viscosity of the liquid, ΔHp is the height of the local vacuum at the suction port of the air lift, and g is the acceleration due to gravity.
Generally, solid particles begin to separate from the sand layer and enter the suction pipe only when Vr reaches a certain value. The minimum value of Vr is determined by Kynch’s sedimentation criterion.
In the equation, b is an empirical constant, h is the water depth, and dm is the average diameter of the river sand particles.
From equations (3) and (4), it can be seen that Vr is related to parameters such as the local vacuum height ΔHp, water depth, and solid particle diameter. Among these parameters, ΔHp has the greatest influence on Vr, and ΔHp is only related to the structural parameters of the air lift, and the flow rate, and the pressure of the compressed air. Therefore, assuming the pressure of the air jet inlet in the air lift is Pg0, the velocity is vg0, and the density is ρg0, and the pressure of the air jet outlet in the air lift is Pg1, the velocity is vg1, and the density is ρg1, we have
In the equation, k represents the specific heat ratio of the gas. For air, k = 1.4.
Pressure loss generated by air lift can be determined using the principle of momentum conservation.
The variables in the equation are as follows: αg represents the gas void fraction, ρm is the density of the liquid-solid mixture, Vm2 is the average velocity of the mixture in the conveying pipe, Qm is the flow rate of solid particles, and A is the diameter of the lifting pipe.
From equations (3) to (7), it can be observed that adjusting the diameters of the airlift conveying pipe and the lifting pipe, altering the pressure and flow rate of the injected gas, and adjusting the water depth (submergence ratio) can optimize the suction capacity of the airlift device.
Results and Discussion
Analysis of Solid Conveying Performance of Airlift Pumps
At varying submergence ratios, Fig. 3 illustrates the solid particle lifting performance of the airlift pump. The results of this experiment are consistent with the trends observed in the study by Kassab et al. Results indicate that the efficiency of solid particle lifting by the airlift pump is significantly influenced by the submergence ratio. The mass flow rate of solid particles shows a consistent pattern with changes in air flow rate across all submergence ratios. Under constant submergence ratio conditions, the solid conveying capability of the airlift pump increases with the rising air flow rate until reaching a peak at a specific air volume, after which it stabilizes. When the air mass flow rate remains constant, the mass flow rate of solid particles rises with increasing submergence ratio. Notably, the increase in solid mass flow rate with rising submergence ratio is more pronounced at lower air volumes, gradually becoming less prominent at higher air volumes. Furthermore, as the submergence ratio increases, more airflow is needed at the origin of the coordinate axis to lift solid particles. This phenomenon may be attributed to the heightened static head at the pump inlet under high submergence ratio conditions, necessitating less air volume to initiate the lifting of solid particles and thus facilitating their earlier flow.
Analysis of the Suction Range at the Bottom of the Airlift Pump
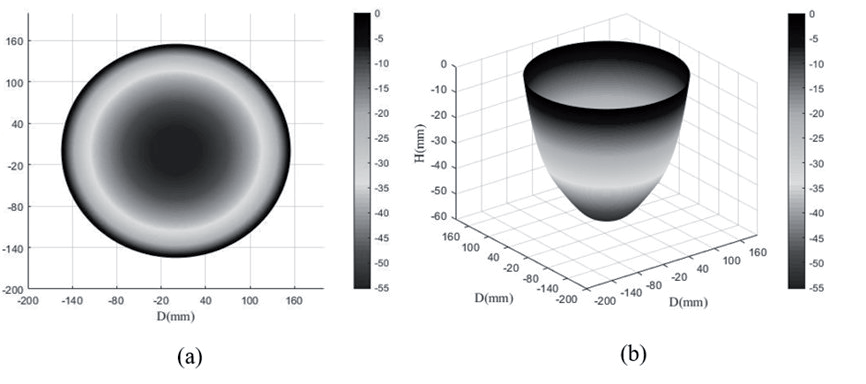
To validate the theoretical analyses presented in this paper, we compared the theoretical results with our experimental findings. To investigate the suction range of the airlift pump, we conducted a characterization analysis of the sandpit morphology observed during the experiment. Using Matlab, we analyzed the data obtained from measuring the main height and diameter of the sandpit, as illustrated in Fig. 4. It’s evident from Fig. 4a) that, at γ = 0.8 and Qg = 30 m³·h⁻¹, the sandpit exhibits a regular circular shape with uniform contours around its perimeter. Fig. 4b) illustrates the morphology of the sandpit derived from the measured height, assuming a regular circular profile. Our experimental observations consistently revealed circular profiles for the sandpits under varying submergence ratios and air intake rates, with uniformly distributed contours along the perimeter.
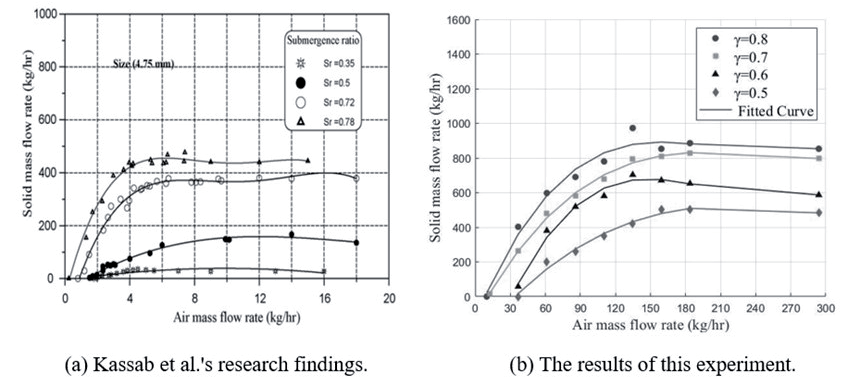
Fig. 4.
a) A Study of Sandpit Integrity at γ = 0.8, Qg = 30 m³·h-1; b) Characterization of Sandpit Morphology.
Based on the aforementioned findings, to conduct a more precise analysis of the suction range at the bottom of the airlift pump, a characterization analysis of the three-dimensional sandpit profiles was performed using profile data points. Initially, an analysis of the general trends was conducted for various submergence ratios and air intake volumes.
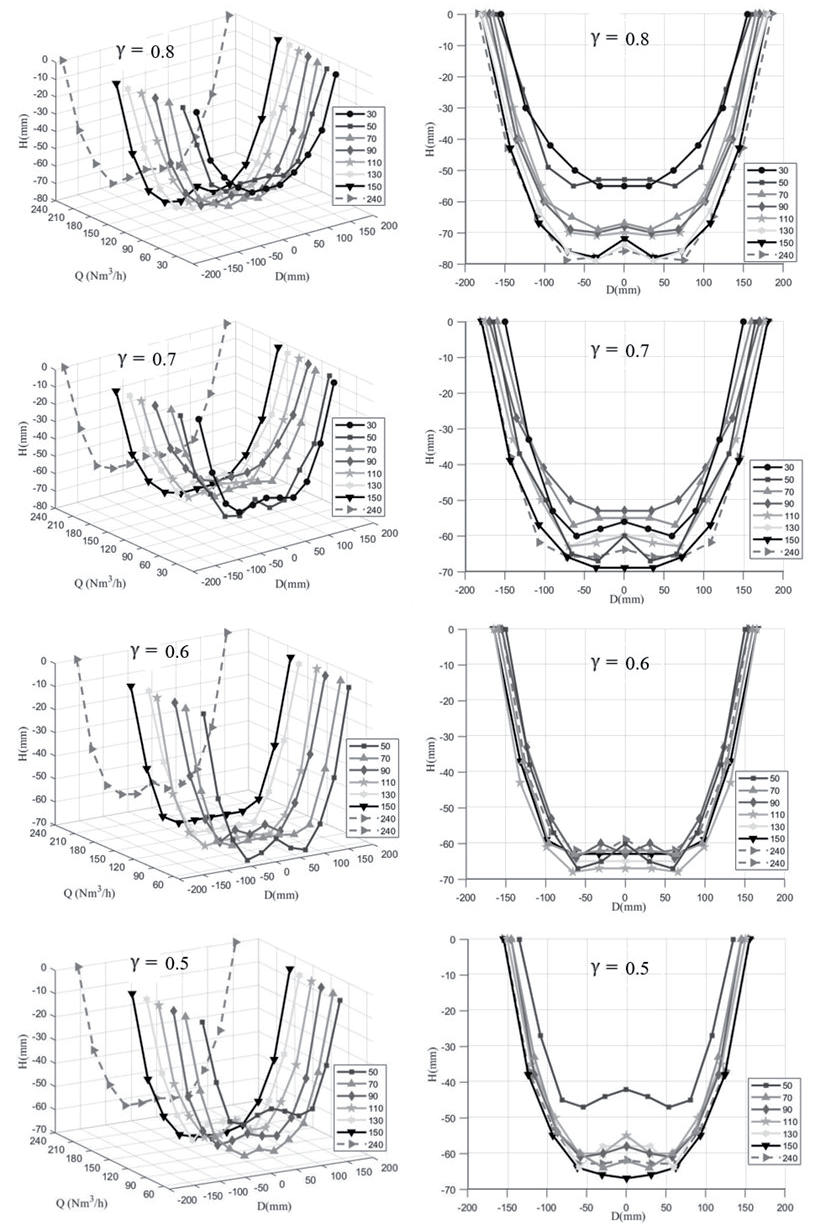
As can be seen from Fig. 5, it’s evident that the relationship between sandpit size and air intake volume was investigated across different submergence ratios. Variations in sandpit size exhibit slight differences between high submergence ratios (γ = 0.8, 0.7) and low submergence ratios (γ = 0.6, 0.5). As depicted in Fig. 5, at an submergence ratio of 0.8, both sandpit diameter and depth increase with rising air intake volume. The diameter ranges from 300 mm to 370 mm, while the depth escalates from 55 mm to a maximum of 79 mm. The smallest sandpit exerts its influence over an area 18 times that of the airlift pump intake, whereas the largest sandpit’s range extends to 28 times the intake area. Fig. 5 illustrates a sudden upsurge in sandpit size from low to high air intake volumes at high submergence ratios. This phenomenon could be linked to the solid conveying curve of the airlift pump. At higher submergence ratios, the elevated liquid level necessitates less energy to reach the top of the lifting pipe, as per the law of conservation of energy. Consequently, under similar air intake volumes, the solid conveying rate is poised to increase. Moreover, escalating air intake volumes might augment gas flow velocity, intensifying aerodynamic effects and lifting more particles, thus enlarging the sandpit diameter. Larger air intake volumes may also alter the liquid-solid interaction, rendering particles more susceptible to gas-induced lift, thereby influencing sandpit morphology. Likewise, from Fig. 5, it’s apparent that variations in sandpit size at submergence ratios of 0.7 and 0.8 exhibit similar trends. While the sandpit diameter displays an upward trajectory, the depth shows relatively minimal fluctuation without any discernible pattern. Nonetheless, at an submergence ratio of 0.7, sandpit size changes appear more uniform, lacking the abrupt differences observed elsewhere.
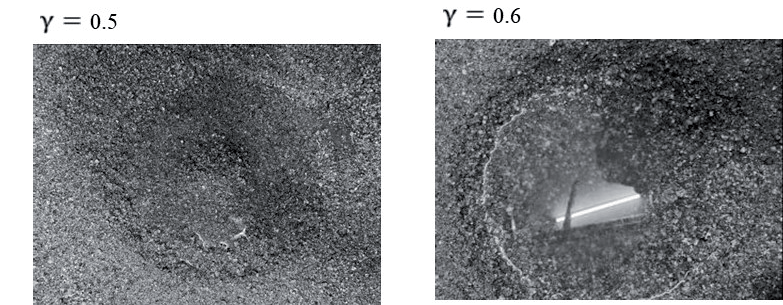
At low submergence ratios, as depicted in Fig. 5, no sandpit formation is observed at an submergence ratio of Qg = 30 m³·h-1, attributable to insufficient lifting energy resulting in a limited bottom influence range. However, as shown in Fig. 6, sandpit contours are discernible without actual sandpit formation, with surface sand accumulation evident. This indicates that at low submergence ratios and low air volume values, the critical threshold for fully lifting particles is not reached. Although particles are set in motion at the bottom, they might oscillate up and down, traversing into the lifting tube. Consequently, only a minor portion of particles is conveyed outward, while the bulk settles at the bottom, forming small sand mounds. For low submergence ratios, specifically when Qg=30 m³·h-1 or higher, increasing the air volume leads to a slightly reduced bottom influence range, with less variation observed in sandpit diameter compared to higher submergence ratios. This phenomenon could be attributed to the stronger binding of particles by surface tension at lower submergence ratios, imposing greater constraints on the movement of bottom particles and resulting in smaller sandpit formations.
Regarding the morphology of the sand pits, as observed in Fig. 5, it is evident that nearly every sand pit’s center at the bottom formed a small mound, ranging from a point to a triangular shape. This feature is particularly pronounced at a submergence ratio of 0.8, with the size of the mounds gradually leveling off with increasing air intake. This phenomenon may be attributed to the fact that after the experiment ends and the airlift head ascends, a small portion of particles are still lifted at the bottom. As a result, the distance between the bottom of the airlift and the sand surface increases, leading to significant losses in both friction and local resistance along the path. Consequently, a large number of particles accumulate at the suction port and the lower end of the lift pipe, resulting in collisions and friction, which in turn leads to significant energy losses and the formation of small mounds. With an increase in air intake, the size and volume of the sand pit gradually increase, leading to a larger area at the base of the formed mounds and, consequently, a decrease in their height. However, a unique phenomenon was observed in the experimental results: at submergence ratios of 0.7, 0.6, and 0.5, with Qg = 150 m³·h-1, small mounds were absent at the bottom of the sand pits, which instead exhibited a semi-elliptical shape. This may be attributed to the fact that, under the experimental system parameters, Qg = 150 m³·h-1 is more conducive to the lifting of bottom particles, leading to an optimal lifting state. Combined with Fig. 5, it can be inferred that the airlift pump’s solid lifting performance is optimal at Qg = 150 m³·h-1.
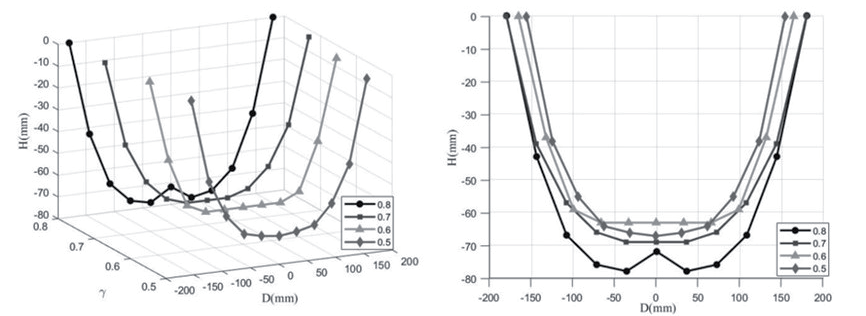
In investigating the influence of the submergence ratio on the bottom’s affected range, sandpits were examined at four submergence ratios (0.8, 0.7, 0.6, 0.5) with an air intake of Qg = 150 m³·h-1. As indicated by the aforementioned analysis of the airlift pump’s performance, the optimal lifting performance of solid particles was observed at Qg = 150 m³·h-1, hence, this air intake was chosen for the analysis. From Fig. 7, it is evident that under the same air intake conditions, the bottom’s affected range gradually expands with an increasing submergence ratio. The diameter of the bottom sandpit increases with the rising submergence ratio, and similarly, the depth of the sandpit exhibits an increasing trend. This may be attributed to lower submergence ratios potentially leading to easier particle sedimentation at the bottom, resulting in the formation of smaller sandpits. Conversely, under higher submergence ratios, particles may be more prone to being flushed by airflow, leading to the formation of larger sandpits. Additionally, with the increase in submergence ratio, the distance between the end of the lift pipe and the liquid surface, ΔL(ΔL = L3 – L2), decreases. Consequently, less energy is required for solid particles to overcome gravity as they ascend to the outlet. Since the air intake remains constant, according to the principle of energy conservation, the analysis of the airlift pump’s performance indicates an increase in the mass flow rate of solid particles at the outlet, thereby enlarging the bottom sandpit’s affected range.
Conclusions
The conclusions drawn from the study on the bottom suction range of the airlift pump system with a lifting pipe diameter of 100 mm and capable of three-axis movement are as follows:.
(1) Initially, the working principle of the airlift pump for extracting solid particles was analyzed, and theoretical formulas were used to determine that adjusting the pipe diameters of the airlift delivery and lifting pipes, as well as altering the pressure, flow rate, and water depth (submergence ratio) of the jet gas, can optimize the suction capacity of the airlift device.
(2) Experimental observations revealed that the airlift pump lifts sand particles, forming regular sandpits, which were characterized in three dimensions. The overall shape of the sandpit was found to be semi-elliptical, with circular contours and uniform profiles around the perimeter.
(3) Regarding the morphology of the sandpit, it was observed that almost every sandpit formed a small sand mound resembling a triangle at the center of the bottom. However, at submergence ratios of 0.7, 0.6, and 0.5, with Qg = 150 m³·h-1, no small sand mound was observed at the bottom of the sandpit, and the shape of the sandpit was semi-elliptical. This airflow rate also marked the turning point for the pump’s solid lifting performance, representing the optimal airflow rate for the airlift system in this experiment. Therefore, at the turning point of the solid lifting performance of the airlift system, it facilitates the complete lifting of bottom particles.
(4) Based on the analysis of the solid lifting performance of the airlift pump, the study found that the submergence ratio and air intake volume significantly impact the suction range at the bottom of the airlift system. When the submergence ratio is 0.8, the size and depth of the sand pit show a clear pattern, increasing with the air intake volume. When the submergence ratio is 0.7, the size of the sand pit changes more uniformly, without abrupt differences. At low submergence ratios, increasing the air intake volume has a slightly smaller effect on the bottom impact range, and the sand pit diameter changes less compared to higher submergence ratios. In the study of the submergence ratio’s effect on the bottom impact range, with the same air intake volume, the bottom impact range gradually expands as the submergence ratio increases. The diameter of the bottom sand pit increases with the submergence ratio, and the sand pit depth also tends to increase.
Based on these findings, it is evident that airlift pumps can effectively transport sediment in underwater dredging, mineral extraction, and environmental remediation. Studying sediment transport at the base of airlift pumps can significantly enhance operational efficiency and minimize environmental impact.

