

Introduction
The World Meteorological Organization, in its 2022 Greenhouse Gas Bulletin, reported that atmospheric concentrations of carbon dioxide (CO2) reached a record 415.7 parts per million (ppm) in 2021, the highest level observed in over two million years. Notably, China's carbon emissions escalated to 1,147.7 million tons in 2022, surpassing all global records. This data underscores the integral relationship between global carbon emissions reduction trends and China's initiatives in energy conservation and emissions reduction. The imperative to mitigate carbon emissions intensity in pursuit of environmental protection and sustainable development is clear. During the 75th session of the UN General Assembly's General Debate, China articulated its ambition to attain "carbon peak and carbon neutrality" for the first time. The nation has engaged in comprehensive efforts to lower carbon emissions, transitioning towards a low-carbon, energy-efficient paradigm. This includes the promotion of clean energy development and application, enhancement of energy efficiency, and fostering of green technological innovation. Furthermore, the emphasis on bolstering carbon market regulation and incentivizing market-driven emission reduction strategies is pivotal in fostering a low-carbon economy. Consequently, enhancing energy efficiency and diminishing carbon emissions are imperative tasks [1].
Electricity consumption is closely linked to carbon emissions. Electricity production often burns fossil fuels, releasing large amounts of carbon dioxide and other greenhouse gases. Therefore, it becomes crucial to promote green technology innovation and low-carbon energy-saving transformation [2]. In 2015, China put forward the Implementation Opinions on Promoting the Construction of the Electricity Market, aiming to gradually establish an electricity market balancing mechanism based on medium- and long-term trading, supplemented by spot trading. In 2018, China even started a new round of exploration of electricity marketization reform. Currently, the initial eight spot pilots have conducted continuous settlement trial operations, while the subsequent six pilots have successfully completed simulated trial operations (data sourced from China Power Network). On 18 September 2023, the National Development and Reform Commission and the National Energy Administration issued a notice on the Basic Rules of the Electricity Spot Market (for Trial Implementation). The comprehensive multi-level electricity marketization policy reflects China's emphasis on optimizing the allocation of electricity resources, improving energy efficiency, and developing green technologies to achieve low-carbon, energy-saving, and emission reduction targets. Therefore, the assessment of the carbon-reducing effects of electricity marketization reforms deserves attention.
The earliest studies on "Electricity Marketization Reform," dating back to the late 1990s and early 2000s, mark the inception of a global shift towards liberalizing electricity markets. Burkard Eberlein (2000) delved into the strategic responses of market actors and regulatory continuities amidst evolving market dynamics in his study on the liberalization of the German electricity market [3]. A. Rønne (2000) provides a detailed account in his paper on Denmark's electricity reform, outlining the legislative changes that were enacted to enhance market organization and address environmental considerations [4]. Lastly, H. Outhred (2000) offers a comprehensive review in his study on Australia's electricity sector reform, focusing particularly on the restructuring process and its outcomes within the National Electricity Market [5]. Collectively, these early studies provide foundational insights into the initial phases of electricity market reforms, highlighting the complexities and challenges inherent in transitioning to market-oriented approaches in different national contexts. In recent years, the latest literature on electricity marketization reform paints a picture of a sector at the crossroads of technological innovation, environmental sustainability, and regulatory adaptation. Banks (2022) focuses on the decarbonization transition in the U.S. electricity markets, driven by policy incentives, technological advancements, and consumer preferences. The increasing penetration of variable renewable energy (VRE) and distributed energy resources (DERs) has significantly influenced market structures, both in restructured and regulated markets [6]. The Australian electricity market's decarbonization efforts, as discussed by Cantley-Smith et al. (2023), reveal the complexities of regulatory frameworks in facilitating market reforms. The paper identifies regulatory roadblocks and transformative opportunities, emphasizing the need for adaptive policies that can support the transition to a net-zero emissions future [7]. Schneiders et al. (2022) explore the concept of peer-to-peer (P2P) electricity trading within the broader context of the sharing economy. This perspective adds a novel dimension to the discourse on electricity market reforms, highlighting the potential of decentralized trading models [8]. China's electricity marketization reform is relatively late, and there is relatively little literature on electricity marketization reform. From the perspective of the research object, despite the growing attention toward power marketization reform, there is a paucity of literature that examines its policy effects as a quasi-natural experiment, particularly in the realm of empirical studies. From the research results, most of the literature discusses the history and process of electricity market-oriented reform, and the policy effect of electricity market-oriented reform is not yet determined. "Carbon emission", as an important indicator for measuring the green development of the environment, is crucial for evaluating the role of electricity market-oriented reform.
In recent years, scholars have increasingly devoted attention to electricity market-based reform. However, two significant limitations in the current research landscape deserve attention. Firstly, there is a dearth of literature exploring the carbon reduction effect of such reforms. Secondly, a notable absence is the utilization of the difference-in-differences (DID) model, which could potentially mitigate endogeneity issues in the resulting conclusions. In 2018, China carried out a pilot of the electric power spot market in eight regions, which provided a new opportunity to study the electric power market-based reform. The study considers this pilot as a quasi-natural experiment and analyzes its carbon reduction effect using a DID model, which has important research value.
Utilizing panel data from 282 inland municipalities in China spanning 2012-2021, this study examines the carbon reduction effects of the electricity spot market through the construction of a difference-in-differences (DID) model. This approach aims to validate the necessity of electricity market-based reforms and offers empirical evidence to inform future recommendations.
The potential marginal contributions of this study are threefold. Firstly, by utilizing a difference-in-differences model and focusing on the electricity spot market, it evaluates the carbon reduction impact of electricity market-based reform in China, thereby providing empirical evidence for the efficacy of such reforms and enriching relevant research findings. Secondly, the study delves into the internal functioning of the electricity spot market, confirming the economic agglomeration and green innovation effects stemming from electricity market-based reform. This offers valuable insights into the operational logic of China's electricity market. Finally, the findings offer a testament to the effectiveness of China's electricity market-based reforms, serving as a valuable reference for future market-oriented reforms across multiple energy sources.
Institutional Background and Theoretical Mechanism
Institutional Background
As a large power-consuming country, China's power consumption in 2022 is 8636.9 billion kWh and power generation reached 8693.9 billion kWh [9]. Meanwhile, electricity consumption is one of the major carbon emission sources. China leads the world in carbon emissions, accounting for about one-third of the world's emissions, so it is imperative to reduce carbon emissions and promote energy efficiency and low-carbon transition in electricity [10]. In the early days, the Chinese government took a series of measures to unify the management of electricity, the main one being a vertically integrated monopoly operation model. This monopoly model of power utilities contributed significantly to early economic growth and improved reliability of power supply [11]. However, as the size of the power system grew, the vertically integrated monopoly model was no longer adapted to China's evolving needs, and the national power market generally faced the following three major problems: first, monopolies in the power sector inhibit efficiency, leading to over-investment and under-utilization of grid equipment; second, losses caused by poor operations or poor decision-making under a monopoly are usually borne by the consumer; and lastly, monopolies have too close a governmental relationship is too close and often subject to unnecessary intervention, which prevents electricity prices from truly reflecting costs. Therefore, it is urgent to determine the price and quantity of electricity supply and demand through market competition and to take measures to break the monopoly, deregulate, and introduce competition to the electricity industry, so as to achieve the optimal allocation of electricity resources in a more reasonable way [12-14].
China has been implementing power market-based reforms since 2002, with the aim of efficiently allocating power resources and enhancing their efficiency. In 2002, the State Council introduced the 'Reform Programme on Electricity System Mechanisms,' outlining four critical reform objectives: the separation of power plants from the grid, the segregation of primary and ancillary sectors, the disentanglement of transmission and distribution, and the introduction of competitive bidding for grid access. These reforms were intended to address the escalating demand for electricity and foster market competition, highlighting the urgency of such interventions. In 2015, the "Opinions on Further Deepening the Reform of the Electricity System" marked the start of a new round of electricity reform, promoting the continued improvement of the electricity market-based trading mechanism and deepening the electricity trading system. In August 2017, the National Development and Reform Commission (NDRC) and the National Energy Administration (NEA) jointly issued the "Notice on the Pilot Work on Construction of the Electricity Spot Market," designating eight regions in the South, commencing with Guangdong, along with Inner Mongolia, Zhejiang, Shanxi, Shandong, Fujian, Sichuan, and Gansu, as pilot areas for constructing the electricity spot market. This initiative aims to delve into the structure and framework of the electricity spot market, fostering effective competition within it. The pilot construction responded to the need to deepen power reform and expand transaction scale, aimed at exploring the trading mechanism of the electricity spot market and provided experience and data for the subsequent power system reform [15].
Characteristics of the electricity spot market construction include: the pilot areas cover the east, center, and west of China. The eastern part includes Guangdong, Zhejiang, Shandong, and Fujian; the central part includes Shanxi and Inner Mongolia; and the western part includes Sichuan and Gansu, which ensures that the pilot covers all major power-consuming regions in order to obtain comprehensive data. Second, the market-based formation mechanism for electricity prices has been improved to ensure a balance between supply and demand through active participation in market regulation. Third, a clean energy quota system was established to support market-based trading with clean energy enterprises, such as hydropower and wind power, to promote consumption. Fourth, allow eligible users to enter the market, properly handle cross-subsidization, and improve safeguards. Finally, strengthen the supervision during and after the event to reduce market volatility, ensure normal operation and fair competition, and give play to the central role of the market in resource allocation [16-19]. Since the inception of the pilot program, the power spot market reform has witnessed significant progress, yielding noteworthy results in the southern regions, commencing with Guangdong. Specifically, since November 2021, the number of market participants in the spot market has increased substantially, from 29,000 to 48,000. Additionally, the volume of electricity traded in the medium- to long-term market stands at approximately 276.9 billion kilowatt-hours (kWh), while the amount transacted in spot market deals amounts to roughly 20.1 billion kWh. Notably, the average spot price over recent days has hovered around RMB 0.601/kWh, surpassing the benchmark coal price by approximately 30%. Overall, the market has successfully evacuated a total of RMB 17.1 billion in power generation costs. The spot market operation has achieved positive results [20]. In March 2021, China opened a second batch of pilot work, including Liaoning, Jiangsu, Anhui, Henan, Hubei, and Shanghai, to supplement its pilot area so that the final results obtained from the pilot are more rigorous and scientific.
Typical Case
Guangdong Province, as one of the first batches of the electricity spot market pilot provinces, has been the leader and wind vane in the construction of the electricity spot market in all provinces in the country since the start of the settlement trial operation. As of 31 December 2023, Guangdong's total electricity consumption reached 850.2 billion kWh in 2023, an increase of 8% year-on-year, making it the first province in the country to exceed 800 billion kWh [21]. According to data from the Electricity Division of the Guangdong Energy Bureau, the highest unified load in Guangdong in 2023 hit another record high of 145 million kilowatts (kW), about 3 million kW higher than last year's peak. The province's power operation was safe and orderly, with sufficient supply, which strongly responded to the situation of another record high of power and electricity and reliably supported the high-quality development of Guangdong's economy and society.
The success of Guangdong's electricity spot market is not only reflected in the multi-dimensional coverage of policy implementation, but also in its close integration with green technology innovation and regional economic agglomeration. First, the series of policies and guidelines formulated by the government significantly improved market transparency and fair competition, creating a favorable environment for the application and development of green technologies [22]. The policies enacted by the Guangdong Energy Bureau, such as the Guangdong Electricity Retail Market Management Measures, have not only fortified the transaction oversight in the electricity market, thus safeguarding market integrity, but they have also steered the market towards a healthy, green, and low-carbon development trajectory. Furthermore, the Guangdong government's reform of the electricity pricing and trading mechanism has provided incentives for a more efficient and environmentally sustainable mode of electricity production and consumption, thereby catalyzing advancements in green technology. The government's strong support for new and renewable energy has accelerated technological innovation in these areas and promoted the widespread use of green technologies in the electricity market. Finally, the Guangdong electricity market uses the market price mechanism to promote the clustering effect of the regional economy. The market price mechanism drives enterprises to adopt lower-cost aggregation schemes through price signals, facilitates enterprises to flexibly choose labor and intermediate inputs matching their emission reduction technologies, and improves their own emission reduction technology level [23]. This series of measures promotes the organic combination of green technology innovation and regional economic agglomeration, demonstrates the central role of the market mechanism in optimizing resource allocation and promoting green development, and provides valuable experience and models for the green economic transformation of Guangdong and the whole country.
The electricity spot market, with its flexible and dynamic market mechanism that reflects real-time changes in electricity supply and demand through real-time price signals, provides incentives for investors to invest in renewable energy projects. [24-26] At the same time, electricity spot markets are often coupled with carbon pricing policies, renewable energy quota systems, and other policies that work together to promote a low-carbon transition in the power sector. [27-29] These combined factors make electricity spot markets play a significant role in reducing carbon emissions. On the one hand, the electricity spot market promotes the research, development, and application of green technologies through economic incentives (e.g., green certificates, carbon trading, etc.). Participants can obtain additional economic benefits by investing in green technologies, such as selling green certificates or participating in carbon trading. These measures accelerate the commercialization of clean energy technologies and promote the optimization of the energy mix. On the other hand, the electricity spot market promotes the clustering of energy and environmental protection industries in the region. The market mechanism has attracted enterprises related to electricity production, sales, services, and green technologies to gather in certain regions, forming industrial clusters. This agglomeration effect not only promotes technological innovation and knowledge sharing, but also improves the overall efficiency of the industrial chain and reduces production and operating costs, thus further reducing carbon emissions [30-32].
Theoretical Mechanism
The construction of the electricity spot market enhances the market-based price formation mechanism for electricity transactions, necessitating a transparent and equitable trading framework, a rational and efficient price discovery mechanism, the establishment of robust market oversight mechanisms, a comprehensive information disclosure system, the reduction of market entry barriers, the refinement of legal and regulatory frameworks, and the provision of pertinent policy support. These measures are crucial for optimizing the market's efficient allocation of resources and harnessing the value attributes of electricity resources across varying temporal and spatial dimensions. The basic rules of the spot electricity market (Trial) have given full play to the efficient allocation of resources by the market and the value attributes of electricity resources in different times and spaces. Under the market mechanism of spot trading, electricity is traded as an ordinary commodity, market players declare supply and demand bids in advance, and real-time prices are formed by specialized market agencies and uniformly cleared. On the one hand, the construction of the electricity spot market can promote the structural reform of the supply side of electricity, and promote the development of clean and efficient energy so as to improve the efficiency and quality of electricity supply [33]. On the other hand, the construction of the electricity spot market invisibly allocates the supply and consumption of electricity resources through the price mechanism of the market, which ultimately achieves the optimal allocation of electricity and reduces the intensity of carbon emissions [12].
The study concluded that the construction of an electricity spot market can reduce regional carbon emissions; the key lies in the exertion of the economic agglomeration effect and green innovation effect [13].
Electricity spot market construction can promote the regional economic agglomeration effect. First of all, the spot market construction of electric power improves the efficiency and transparency of electric power transactions, reduces the cost of electricity for enterprises, and thus attracts more industrial agglomeration. The market mechanism of power trading can promote the optimal allocation of power resources, attract investment, and promote the development of related industries, thus driving regional economic growth and forming an economic agglomeration effect. Secondly, as the degree of agglomeration increases, professional environmental protection enterprises, contract energy management companies, or third-party carbon emission monitoring institutions may appear, which can provide professional services at low cost and achieve the scale effect of energy saving and emission reduction; finally, economic agglomeration will produce positive externalities on carbon emissions, reduce costs through factor sharing, reduce transportation distances, and improve production efficiency, so as to conserve energy in order to reduce the intensity of carbon emissions [14, 15, 34].
The study concludes that the construction of the electricity spot market can promote the green innovation effect in the region. Firstly, the electricity spot market continuously raises the cost of usage for inefficient and highly power-consuming power users through the price mechanism, thus realizing the elimination of the least efficient through the market competition mechanism. The elimination mechanism will force power users to continuously seek ways to reduce power consumption and improve efficiency, thus promoting green technological innovation. Secondly, the construction of the electricity spot market promotes the consumption of clean energy such as hydropower, wind power, solar power, and nuclear power [35], which puts forward higher technological requirements for the main body of electricity consumption [36] and will force the main body of electricity consumption in the region to undertake green technological innovation. Finally, the construction of the electricity spot market has developed a perfect subsidy mechanism and safeguard measures, such as providing funds to reduce taxes and lower costs, which provide a guarantee for the main body of electricity consumption to undertake green technological innovation. Green technology innovation can not only improve the efficiency of electricity use and optimize the structure of electricity consumption, but also reduce the greenhouse gases produced in the process of electricity use, thus reducing the intensity of carbon emissions.
In summary, the study proposes the following hypotheses:
Hypothesis 1: Electricity spot market construction can effectively reduce regional carbon emissions.
Hypothesis 2: The construction of an electricity spot market can produce regional economic agglomeration effects and green innovation effects, and then reduce regional carbon emissions.
Study Design
Model Design
Benchmark Regression Model
To test hypothesis 1, drawing on the findings of Dong et al. (2022) [31], the study considers the construction of the electricity spot market as a quasi-natural experiment and uses a DID model to identify its policy effects. The specific model is as follows:
where i denotes city and t denotes year, carbon denotes the study's explanatory variable carbon reduction effect, which is carbon emissions per capita and carbon emissions generated per unit of GDP, respectively. Treat × time is the study's explanatory variable electricity spot market construction constructed through a DID model. Controls denotes a set of control variables selected by the study that may affect the regional low-carbon transition. δ denotes individual fixed effects in the city dimension, and μ denotes time fixed effects in the year dimension. ε denotes the disturbance term. If the β is significantly negative, it indicates that the construction of the electricity spot market can reduce regional carbon emissions.
Mechanism Tests Model
The stepwise regression method has been questioned in economics. A common method of testing mechanisms is to only examine the relationship between the explanatory variable and the mechanism variable and not to empirically test the relationship between the mechanism variable and the dependent variable, as well as the extent of the indirect impact effect, such as Dell (2011) [37]. Therefore, in order to test hypothesis 2, this article first constructed the following model:
Among them, MV represents Mechanism Variables, including economic agglomeration and green innovation, while other variables are the same as in model (1). If β is significantly positive, it indicates that the construction of the electricity spot market can generate economic agglomeration effects and green innovation effects. The explanation for reducing regional carbon emissions through economic agglomeration and green innovation comes from the derivation of theoretical mechanisms.
Meanwhile, this article draws on the approach of Alesina and Zhuravskaya (2011) and adopts the research approach of the instrumental variable (IV) method [38]. Due to the fact that the construction of the electricity spot market as a quasi-natural experiment is exogenous, this article will use it as the IV of Mechanism Variables for further testing. Specifically, after estimating the regression coefficients through model (2), this paper uses treat × time as the IV fitting mechanism variable MV ', which excludes endogenous factors unrelated to the construction of the electricity spot market. Furthermore, this article examines the relationship between the newly fitted Mechanism Variables and the dependent variable and constructs the following model:
Among them, MV is a newly fitted mechanism variable that includes economic agglomeration and green innovation. If β is significantly negative, it indicates that the economic agglomeration effect and green innovation effect of electricity spot market construction can further reduce regional carbon emissions.
Definition of Variables
Explained Variables
Carbon emission (carbon): First, based on the carbon emission data of each prefecture-level city in China, three types of emission ranges are used to measure regional carbon emissions, as follows:
(1) Scope 1 refers to all direct emissions within the city's jurisdiction, including mainly GHG emissions from transport and buildings, industrial processes, agriculture, forestry, land use change, and waste disposal activities.
(2) Scope 2 refers to indirect energy-related emissions that occur outside of the city's jurisdiction, including mainly emissions from purchased electricity, heating, and/or cooling to meet the city's consumption.
(3) Scope 3 refers to other indirect emissions caused by activities within the Town that occur outside the jurisdiction but are not included in Scope 2, including GHG emissions from the production, transport, use, and disposal of all goods purchased by the Town from outside the jurisdiction.
Total carbon emissions is the sum of carbon emissions from the three scopes.
Furthermore, the study divides the total carbon emissions by the number of population and regional GDP, respectively, to obtain the carbon emissions per capita (CPC) and the carbon emissions generated per unit of GDP (CPG) to measure the regional carbon emissions. If the construction of the electricity spot market can achieve the carbon reduction effect, the coefficient of treat × time should be significantly negative.
Explanatory Variables
Electricity spot market construction (treat × time): the study constructs policy variables for electricity spot market construction through the DID model. Among them treat is a dummy variable; treat is 1 when the city is selected as a pilot to carry out electricity spot market construction and 0 otherwise. Time is a dummy variable, 1 when the electricity spot market is constructed and 0 otherwise. The interaction term treat × time indicates the net effect of the electricity spot market construction of the city compared to the non-construction of the city after the construction of the electricity spot market compared to the construction of the city before the construction effect.
It is important to explain that although the electricity spot market construction was notified in 2017, the pilot regions started to organize the construction in 2018. Therefore, the time variable of the study is bounded by 2018, with 1 after 2018 and 0 otherwise.
Mechanism Variables
Economic: It is believed that the construction of an electricity spot market can achieve regional carbon emission reduction, mainly due to the economic agglomeration effect by promoting the optimal allocation of electricity resources. Referring to the research results of Ciccone and Hall (1993), the degree of agglomeration of economic activities is measured by economic density [39]. The specific calculation formula is as follows:
Where i represents the ith city, t represents the year, A is the area of the region, and eco is the number of urban jobs. In the study, Economic1 uses the number of urban employment calculated by the formula, and Economic2 uses the logarithm of urban employment calculated by the formula.
Green innovation (Green): the study concludes that the construction of an electricity spot market can achieve a regional carbon reduction effect, mainly due to the various ways to force or incentivize the region to carry out green technological innovation. Referring to the research results of Du et al. (2022) [40] and Li et al. (2023) [41], the study uses regional green patent application data to measure green innovation (Green1). Considering that patent applications are not necessarily granted, the number of granted regional green patents is chosen as an alternative measure of green innovation (Green2). At the same time, since the patent data do not follow a normal distribution, the study treats them with +1 to take the logarithm.
Control Variables
Drawing on the literature on regional carbon emission measurement, the study selects a series of control variables that may affect regional carbon emission, as shown in Table 1. First, the study concluded that the scale and structure of regional economic development affect carbon emissions.
(1) Economic aggregate: economic aggregate reflects the scale of production and consumption in a region, and a larger economic scale is usually accompanied by higher energy demand and carbon emissions, so economic aggregate affects carbon emissions. Therefore, the study measures economic aggregates in terms of Gross Regional Product (GRP) and takes logarithms.
(2) Economic structure: Economic structure determines the efficiency and type of carbon emissions. Industrial activities are usually energy-intensive and have high carbon emissions, while the service sector has relatively low carbon emissions. Therefore, the study measures economic structure by the regional secondary industry GDP share and tertiary industry GDP together.
(3) Employee size: The number of employees reflects the scale of industrial activities in a region. A larger number of employees usually means higher industrial activities and energy demand, which in turn leads to higher carbon emissions. Therefore, the size of the workforce affects the regional carbon emissions. The study measures employee size in terms of the number of employees and takes the logarithm.
(4) Enterprise size: The profitability and size of an enterprise affect its investment capacity and technology choice, which in turn affect carbon emissions. Larger or more profitable firms are more likely to invest in high-efficiency, low-carbon technologies, and production processes that reduce carbon emissions per unit of product or service. Conversely, smaller or less profitable firms may lack the ability to invest in newer technologies, leading to higher energy consumption and carbon emissions. Therefore, enterprise size and profitability are important factors affecting regional carbon emissions. The study measures enterprise size and enterprise profitability in terms of the number of industrial enterprises and industrial enterprise profits and takes the logarithm.
(5) The level of foreign business: the level of foreign business reflects the degree of regional openness to the outside world; foreign-funded enterprises tend to bring more advanced and environmentally friendly technologies, which affects regional carbon emissions. The study measures the foreign business level by the number of foreign-funded enterprises and takes logarithms.
(6) Transport conditions: Transport activities are an important source of carbon emissions. The volume of freight and passenger transport is an important indicator of the intensity of regional transport activities. The study measures transport conditions by the volume of road freight and road passenger transport and takes logarithms.
(7) Government management level: reflected by indicators such as fiscal revenues and expenditures, the government's ability to formulate and implement policies is crucial to promoting low-carbon development and reducing carbon emissions. The study measures the level of government management by revenue and expenditure within the general budget of local finance and takes logarithms.
Samples and Data
The panel data of China's inland cities from 2012 to 2021 are selected as the initial research sample. After the missing value elimination treatment, 282 cities with a total of 2608 observations are obtained. At the same time, in order to facilitate the presentation of empirical results, the study has processed the units of some variables, which will not affect the direction and significance of the regression coefficients.
Table 1.
Variable definition.
The carbon emission data and regional green patent data are from the China Research Data Service Platform (CNRDS), and other data are from various statistical yearbooks.
The acquisition of raw carbon emission data entailed gathering diverse information from various sources. Specifically, energy consumption data segmented by energy type and industry sector were procured from the China Energy Statistical Yearbook and respective statistical yearbooks of varying levels. Industrial process and product utilization data were retrieved from the China Industrial Statistical Yearbook and its corresponding statistical yearbooks. Furthermore, agricultural, forestry, and other land-use activities data were gathered from the China Agricultural Statistical Yearbook, China Livestock Statistical Yearbook, China Forest and Grassland Statistical Yearbook, and other relevant publications. Data pertaining to agricultural, forestry, and other land use activities are sourced from the China Agricultural Statistical Yearbook, China Livestock Yearbook, China Forestry and Grassland Statistical Yearbook, and various statistical yearbooks of varying levels. Waste treatment data are procured from the China Environmental Statistical Yearbook and corresponding statistical yearbooks. Additionally, data on purchased electricity, heating, and cooling are obtained from the China Urban Statistical Yearbook, China Energy Statistical Yearbook, and other statistical yearbooks at various levels. Emission factors are based on official data, including the "Guidelines for Provincial Greenhouse Gas Emission Inventories (for Trial Implementation)" and the carbon emission inventory guidelines issued by the governments at all levels, and if there are any default data, they are supplemented by the IPCC Emission Factor Database.
Table 2.
Descriptive statistics.
Empirical Analysis
Descriptive Statistics
Table 2 reports the results of the descriptive statistics for the main variables. CPC has a mean of 11.272 with a standard deviation of 9.831, and CPG has a mean of 2.506 with a standard deviation of 2.251, suggesting that the intensity of carbon emissions varies greatly across cities. Treat × time has a mean of 0.107, suggesting that the sample size following the construction of the spot market for electricity accounts for the overall 10.7 percent. The descriptive statistics of other variables are shown in the table and will not be repeated.
Baseline Regression
Benchmark Regression Results
Table 3 reports the baseline regression results. As shown in columns (1) and (3), the coefficients of the interaction term treat × time are significantly negative. After adding control variables to the model, as shown in column (2), the coefficient of the interaction term treat × time is -0.477 with a significance level of 0.01. This indicates that the per capita carbon emissions of the host city are reduced after the construction of the electricity spot market. As shown in column (4), the coefficient of the interaction term treat × time is -0.129, and the significance level is 0.01. This indicates that after the construction of the electricity spot market, the intensity of carbon emissions generated per unit of GDP in the host city is reduced. Therefore, the construction of an electricity spot market reduces the carbon emissions of the region, and hypothesis 1 is proved.
Electricity spot market construction has regional carbon emission reduction because, on the one hand, electricity spot markets promote competition and efficiency among companies. Market-based reforms usually introduce competition, prompting power companies to improve efficiency and reduce waste. Increased efficiency is usually accompanied by optimized energy use, which reduces carbon emissions. On the other hand, the electricity spot market can incentivize consumers and firms to reduce energy consumption and choose more environmentally friendly energy sources by introducing a price for electricity that reflects the true cost [42].
Dynamic Effects Test
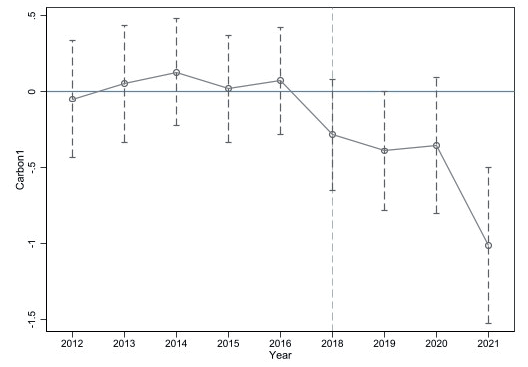
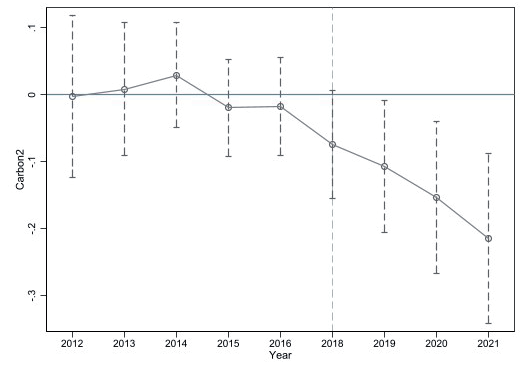
The application of the DID model presupposes that the study satisfies the parallel trend assumption, i.e., the explanatory variables in the experimental and control groups show consistent trends ex-ante. The study drew on Jacobson et al. [43] to develop the following model for dynamic effects testing:
Table 3.
Benchmark regression results.
Among them, year is the dummy variable for each year from 2012 to 2021. Other variables in model (2) are the same as in model (1). Referring to the results of Nunn and Qian (2011), the study used the year before the start of the demonstration project (2017) as the base period, and the following figure plots all coefficients and 95% confidence intervals for treat × year [44].
As depicted in Figs. 1 and 2, prior to 2018, 95% of the confidence intervals encompassed a value of 0, suggesting that before the establishment of the electricity spot market, the pilot regions and non-pilot regions exhibited a similar trend in both per capita carbon emission and carbon emission per unit of GDP, thereby fulfilling the criterion of parallel trends. Moreover, after 2018, the construction of the electricity spot market began to have a negative effect on both, i.e., it produced a regional carbon reduction effect.
Robustness Tests
Placebo Test
The carbon-reducing effects of electricity spot market construction may be influenced by potential unobservables from city-years, which may interfere with the study's findings. To mitigate the endogeneity issue, this study employs a placebo test. Specifically, it creates new pseudo-policy variables by randomly selecting an equal number of cities as the pilot cities for electricity spot market construction across 500 random samples, designating them as pseudo-pilot regions, and subsequently interacting these variables with the TIME variable. If most of the pseudo-policy variables fail to achieve effects similar to those of electricity spot market construction, it means that their policy effects are hardly disturbed by potentially unobservable factors.
Figs. 3 and 4 plot the regression results of the pseudo-policy variables formed by 500 random samples on carbon emissions per capita and carbon emissions per unit of GDP, respectively. In the figure, the blue hollow circles depict the regression coefficient values, while the solid curves represent the kernel density of the distribution. The vertical dashed line on the x-axis marks the true regression coefficient values associated with the construction of the electricity spot market (as detailed in Table 3, Columns (1) and (2)). The horizontal dashed line on the y-axis indicates the 0.1 level of significance.
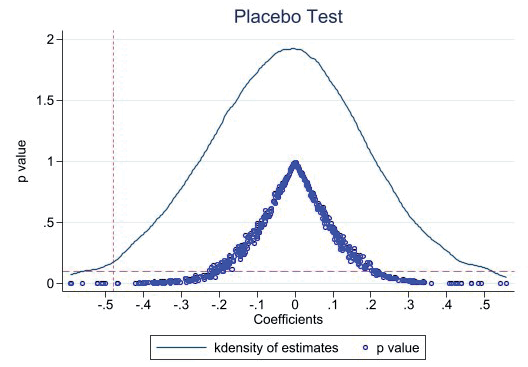
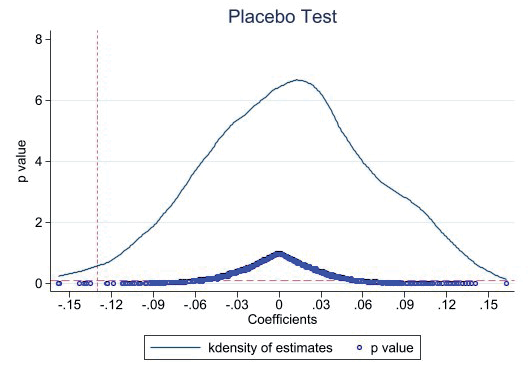
As shown in Fig. 3 and Fig. 4, most of the regression results of the 500 random samples are around the value of 0 and do not reach the 0.1 level of significance. Meanwhile, the actual regression results of electricity spot market construction are all singular values. Therefore, it can be assumed that the vast majority of the pseudo-experimental group could not realize the policy effect of electricity spot market construction, and the research findings are hardly disturbed by unobservable factors.
PSM-DID Test
In order to further eliminate the interference of factors that may have an impact on the selection of pilot regions for the construction of the electricity spot market, the study matches the pilot regions with non-pilot regions through the method of propensity score matching. Referring to Heckman et al. [45], firstly, the study selects all the control variables as covariates, i.e., the study considers that these factors may influence the selection of pilot regions. Secondly, propensity scores were calculated and matched through the nearest neighbor principle. Finally, regression analyses are then performed on the sample after matching.
The findings from the PSM-DID analysis, presented in Column (1) of Table 4, indicate that after PSM matching of 2026 observations, the coefficients of the interaction term 'treat × time' are consistently negative and significant. This suggests that the carbon-reduction effect of the electricity spot market construction remains robust after eliminating the confounding influence of factors that may have influenced the selection of pilot regions.
Table 4.
Robustness tests.
Control of Other Policy Interference
In recent years, China has introduced a series of energy policies to effectively manage energy consumption and carbon emissions, such as energy rights trading. In order to eliminate the possible interference of the same period and type of policies on the research findings, it is necessary to control them. In 2017, China carried out a pilot of energy rights trading in four provinces, including Zhejiang, Fujian, Henan, and Sichuan, and the study constructed its policy variable RIGHT based on the DID model and added it as a control variable into the model (1).
Column (2) of Table 4 reports the results controlling for the interference of the energy rights trading policy. The coefficients of the interaction term treat × time are all significantly negative, indicating that the carbon reduction effect of electricity spot market construction remains robust after controlling for possible disruptions from energy rights trading policies.
Hysteresis Effect Test
In order to further confirm the causal relationship between the two, the study applies a one period lag to the explanatory variables and all the control variables, i.e., it tests the relationship between the explanatory variables, the control variables, and the explained variables in period t-1.
Column (3) of Table 4 reports the results of the lagged effects test. The coefficients of the interaction term treat × time are all significantly negative, which provides further evidence of the causal relationship between electricity spot market construction and regional carbon reduction effects.
Cluster Analysis
To further mitigate the effects of the endogeneity problem, the study analyzes robust standard errors clustered at the individual city level.
Column (4) of Table 4 reports the results of the tests after the clustering analysis. The coefficients of the interaction term treat × time are all significantly negative, which indicates that the carbon reduction effect of electricity spot market construction remains robust after clustering the robust standard errors to individual cities.
Excluding Municipalities
In order to avoid the effect of municipalities, this paper conducts robust tests after removing the four municipalities.
Column (5) of Table 4 reports the results of the test after removing the municipalities. The coefficients of the interaction term treat × time are all significantly negative, indicating that the carbon-reducing effect of electricity spot market construction is still robust after removing the municipalities.
Further Analysis
Mechanical Tests
Table 5 reports the mechanism testing results of economic agglomeration effects. Firstly, as shown in columns (1), the coefficients of the interaction term treat × time are 0.185, with significance levels of 0.05, respectively. Secondly, based on the regression coefficients in column (1), this article fitted the new mechanism variable economics' with treat × time as IV. As shown in columns (2) and (3), the coefficients of economics' are significantly negative, indicating that economic agglomeration further reduces regional carbon emissions. As shown in columns (4) - (6), after replacing the measurement method of economic agglomeration, the regression results remain unchanged. This indicates that the construction of the electricity spot market significantly promotes economic agglomeration in the region and thus facilitates regional carbon emission reduction.
Table 6 reports the mechanism testing results of green innovation effects. Firstly, as shown in column (1), the coefficients of the interaction term treat × time are 0.063, with a significance level of 0.005. Secondly, based on the regression coefficients in column (1), this article fitted the new mechanism variable green with treat × time as IV. As shown in columns (2) and (3), the coefficients of green 'are significantly negative, indicating that green innovation further reduces regional carbon emissions. As shown in columns (4) - (6), after replacing the measurement method of green innovation, the regression results remain unchanged.
This indicates that the construction of the electric power spot market promotes green technological innovation, which ultimately contributes to the realization of the regional carbon reduction effect.
The construction of the electricity spot market achieves carbon emission reduction by fostering economic agglomeration effects and fostering green technological innovation. This is likely due to the fact that, firstly, economic agglomeration facilitates the vertical and horizontal integration of industries, enabling by-products from certain enterprises to serve as intermediate inputs for others, thereby fostering a virtuous economic cycle and promoting resource efficiency. Enterprises can save energy to reduce carbon emissions through factor sharing to lower costs, reduce transport distances, and improve production efficiency. On the other hand, green technological innovation improves energy efficiency and replaces traditional high-carbon emission energy sources, such as solar and wind power, instead of coal and oil. This promotes environmental awareness and facilitates carbon reduction actions at the broader societal level, such as the development of carbon capture and storage technologies, which reduce carbon emissions on a wider scale [14, 15, 28]. Therefore, hypothesis 2 is proved.
Table 5.
Mechanism tests of economic agglomeration.
Table 6.
Mechanism tests of green technology innovation.
Heterogeneity Analyses
Source of Carbon Emissions
By promoting regional economic agglomeration and green technology innovation, electricity spot market construction mainly affects the intensity of direct carbon emissions, especially those generated by transport, building, and industrial production processes. Therefore, electricity spot market construction has a stronger impact on carbon emissions in Scope 1. The study divides the carbon emissions into the carbon emissions of scope 1, scope 2, and scope 3 according to the three carbon emission sources and examines how the impact of the construction of the electricity spot market on the carbon emissions of these three scopes is different, respectively.
The test results are shown in Table 7, and it can be seen that the interaction term coefficients of columns (1) and (4) are larger and more significant, and the construction of the electricity spot market has a greater impact on the carbon emission of scope 1. There is a need to actively explore more avenues of electricity market-based reform programs to effectively manage carbon emissions for other scopes.
The possible reasons for this are that, on the one hand, electricity market construction directly affects the energy use choices of businesses and households by improving the efficiency and flexibility of electricity supply and promoting cleaner and more efficient energy consumption. On the other hand, for sectors such as transport, buildings, and industrial production, the development of electricity markets can have a greater impact on the direct carbon emissions of these sectors by reducing reliance on traditional fossil energy sources and promoting electrification and energy efficiency [46].
Government Low Carbon Governance Efforts
Environmental governance has negative externalities, and electricity market-based reforms need to be complemented by government administrative instruments in order to work better. Therefore, the study explores the differences in the impact of the electricity spot market on regional carbon emissions under different strengths of government low-carbon governance. The study employs the frequency of occurrence and the respective weights of low-carbon-related terminology in provincial government work reports as proxy indicators for environmental governance at the prefecture-level city government level. Specifically, the frequency of terms such as "low-carbon" and "carbon dioxide" is utilized to quantify the intensity of the government's low-carbon governance efforts. These measures are then categorized into two distinct groups, based on the median value of their annual occurrences.
The test results are shown in Table 8. Columns (2) and (4) are the groups with greater intensity, and their interaction term coefficients are both larger and more significant, which shows that the construction of the electricity spot market has a greater effect on reducing the intensity of carbon emissions. This suggests that in the electricity market, the market determines the allocation of resources, while the government carries out appropriate regulation, which can further strengthen the effect of environmental governance.
On the one hand, cities with stronger governmental low-carbon governance already have a more mature policy and technological base to support and take advantage of the electricity market. These cities may be able to integrate renewable energy, promote electric vehicles, and energy efficiency measures more effectively, and achieve a better allocation of energy through the electricity market, thus achieving more significant results in reducing carbon emissions. On the other hand, cities with stronger government low-carbon governance tend to be accompanied by higher public awareness of environmental protection and corporate emphasis on sustainable development. In such an environment, the construction of the electricity market can more effectively promote the use of clean energy and the transformation of energy consumption patterns, thus reducing carbon emissions more significantly [47].
Table 7.
Carbon emission sources.
Table 8.
Government's low-carbon governance efforts.
Conclusions and Policy Recommendations
The study selects the panel data of 282 inland cities in China from 2012 to 2021 as samples. Electricity spot market construction is used as a quasi-natural experiment to construct a DID model to investigate the impact of electricity spot market construction on the carbon emission of the host city, and the results show that the per capita carbon emission and the carbon emission per unit of GDP of the host city are reduced after the construction of electricity spot market. Subsequently, the study conducted a series of robustness tests, such as the placebo test and the PSM-DID test, and the conclusions still hold after the tests. Further analyses show that electricity spot market construction reduces regional carbon emissions by promoting regional economic agglomeration and green technology innovation. Heterogeneity shows that electricity spot market construction has the greatest impact on the intensity of urban direct carbon emissions. The impact of electricity spot market construction on the intensity of carbon emissions is greater in regions where the government's low-carbon governance is stronger. Based on the conclusions, the study proposes the following policy recommendations:
Firstly, consideration can be given to expanding the scope of cities in which the electricity spot market is piloted so as to gradually promote the marketization process. By increasing the number of pilot cities, the carbon-reducing effect of electricity market-based reform can be more comprehensively assessed and prepared for full implementation in the future.
Second, in the process of promoting the construction of the electricity spot market, it is necessary to continuously improve the electricity market-based trading mechanism. Sound market-based trading rules and mechanisms are established to improve market transparency and fairness, promote efficient allocation of power resources, and thus achieve the goals of reducing carbon emissions and improving resource use efficiency.
Third, actively promote the integration of market supervision into the entire process of electricity spot market construction. The effective and efficient functioning of the electricity spot market is pivotal in advancing the refinement of China's electric power market system, fostering a stable, healthy, and environmentally sustainable development of the electric power spot market. Ultimately, this will contribute to the establishment of a nationally unified electric power market that is aligned with the objectives of low-carbon energy transition and socioeconomic progress.
Finally, increase support for technological innovation: this study found that green technological innovation is the key to achieving carbon reduction. Therefore, the government should increase its support for technological innovation, including the provision of financial support and technology information-sharing platforms. By incentivizing and supporting enterprises and research institutes to carry out technological innovation, it can promote the development and application of clean energy technologies and further reduce carbon emissions.
By adopting the above policy recommendations, the electricity market reform can be further promoted to achieve the goal of reducing carbon emissions and low-carbon transition and contribute to sustainable development. The study has some limitations. Firstly, due to the limitation of data availability, the article is not exhaustive in exploring the mechanisms and only analyzes the impact of green technology innovation as an operating mechanism without discussing other mechanism analyses such as the use of renewable energy. Secondly, the article's discussion of boundary conditions is relatively limited, and the study only analyzes heterogeneity based on dividing cities into eastern, central, and western regions. In the future, the analysis can be extended by exploring dimensions such as the degree of marketization of cities.

