

Introduction
In the context of global warming, carbon emissions have garnered escalating global attention [1, 2]. Controlling carbon emissions and mitigating climate change represents a shared mission for all nations. In pursuit of this goal, China has implemented the Double-Carbon target, with objectives to peak carbon emissions by 2030 and attain carbon neutrality by 2060 [3].
In the process of industrialization and urbanization, a large amount of fossil fuels were consumed, resulting in significant carbon emissions, and alterations occurred in land use types [4]. There exists a complex relationship between land use change and carbon emissions [5, 6]. Moreover, land use change significantly impacts ecosystems by reshaping the spatial distribution of regional biodiversity, resources, and ecosystem types. This alteration can influence ecosystem services, which can often be evaluated in economic terms, such as through Ecosystem Service Value (ESV) [7, 8]. Therefore, variations in carbon emissions and ESV, along with their spatiotemporal relationship, can be analyzed based on land use change, an endeavor of paramount importance for mitigating carbon emissions, enhancing the ecological environment, and fostering sustainable development.
In recent years, research has delved into the ramifications of land use change on carbon emissions and ESV, such as spatial differences in carbon emissions at various regional scales [9, 10], carbon emission mechanisms of single land types [11, 12], the relationship between land use change and carbon sources and sinks [13, 14], and spatiotemporal characteristics and interrelationships between ESV and land use change [15, 16]. Wei Wei and Yahui Zhang et al. explored the temporal and spatial evolution characteristics of LUCE at provincial and county scales, respectively [17, 18]. Luo Xiang et al. used the DEA and SBM-undesirable models to determine the constraint benefits of cultivated land carbon emissions on land use efficiency [11]. Wang Fu et al. studied the temporal and spatial changes of land use change on carbon sources and carbon sinks under different climate conditions and found that climate and land use change are the main reasons affecting carbon sinks [14]. Guo Pengfei et al. explored the impact of land use change on ESV from the spatial dimension and revealed the response mechanism of ESV [19]. However, there is a scarcity of studies investigating the spatiotemporal correlation between carbon emissions and ESV derived from grid scale land use changes.
An integral part of the Yangtze River Delta Economic Circle, Anhui Province in East China boasts the highest urbanization rate, densest urban clusters, and top economic development nationwide [20]. Anhui Province is also an important coal base, ensuring the energy demand for economic development in East China [21]. The fluctuations in carbon emissions and ESV within Anhui Province correlate with the sustainable development of China’s eastern region. Therefore, this study aims to investigate the spatiotemporal relationship between carbon emissions and ESV in Anhui Province and analyze their spatial correlation.
Material and Methods
Study Area
Situated in eastern China, Anhui Province, with its capital Hefei, comprises 16 prefecture-level cities, covering an area of 14.01×10⁴ km2 (Fig. 1). Positioned in the lower reaches of the Yangtze River and Huai River, Anhui serves as a transitional zone between warm temperate and subtropical climates. The landform consists of plains, hills, and mountains. The northern part of Anhui is the Huaibei Plain, which is a grain producing area rich in crops such as wheat and corn. It is also an important coal producing base where the famous Huainan and Huaibei mining areas are located. The central part is the Jianghuai Hills and the plain along the Yangtze River, with rice as the main crop. It is an important industrial area, with 8 out of 10 cities with a high level of industrialization in the province located here. The southern region is mountainous, with agriculture and tourism as the main industries. In 2022, the permanent population of the region stood at 61.27 million, accompanied by a GDP of approximately 643.5 billion US dollars.
Materials
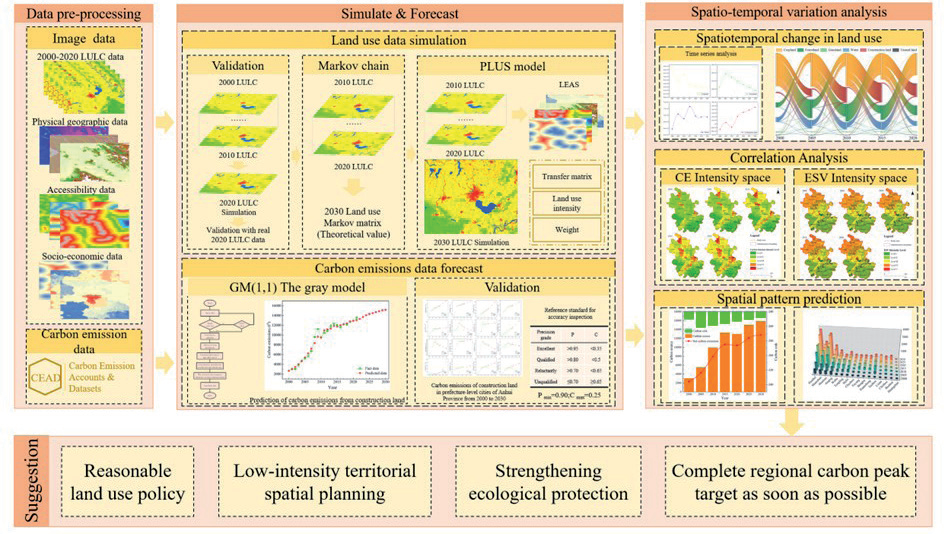
The land use data is sourced from the Wuhan University CLCD dataset [22], which is suitable for long time series land use change studies with high temporal resolution and accuracy validation up to 80%. According to the land use classification criteria of the Chinese Academy of Sciences, the land classes in the CLCD dataset are divided into six first-level land classes, namely, cropland, forestland, grassland, water, construction land, and unused land. Socio-economic data for Anhui Province and energy consumption data primarily come from the Anhui Municipal Statistical Yearbook and China Energy Statistical Yearbook. Vector data from the National Catalogue Service for Geographic Information, including roads, rivers, and administrative boundaries, predominantly originate (Table 1). Anhui Province underwent administrative division adjustments from 2000 to 2015, dividing Chaohu Lake into Hefei, Wuhu, and Ma’anshan, and dividing Shouxian County from Lu’an City to Huainan City. The technical route is shown in Fig. 2.
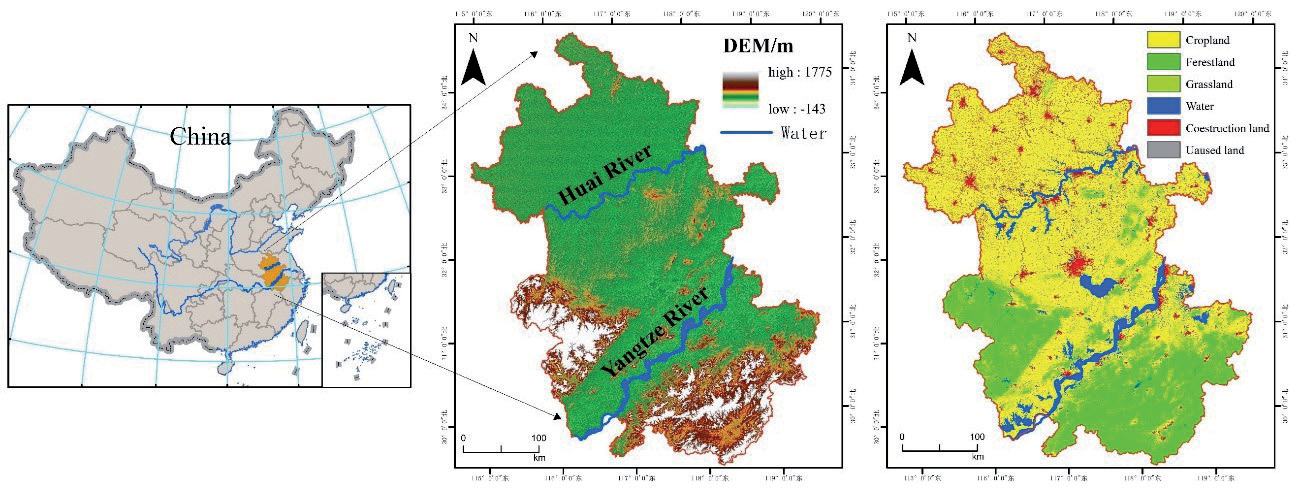
Table 1.
Data details.
Research Methods
Carbon Emissions Estimation
Land use carbon emissions (LUCE) include those from non-construction land as well as from construction land [23]. Carbon emissions from non-construction land can be estimated directly by multiplying the area of each land use type and the corresponding carbon emission factor and then summing them up. Estimating carbon emissions from construction land involves an indirect approach based on fossil energy consumption data for calculation [24].
The equation for estimating carbon emissions from non-construction land can be expressed as follows:
Style: E1 is carbon emissions from non-construction land: Si is the area of land type i; Gi is the carbon sink or emission factor for land type i.
The carbon emission coefficient for each land use type was established by consulting pertinent literature and considering the specific conditions of the study area [23, 25], as illustrated in Table 2.
To estimate carbon emissions from construction land, this text uses consumption data and carbon emission coefficients obtained from various sources (Table 3), including the China Energy Statistical Yearbook, the Anhui Statistical Yearbook, and the Intergovernmental Panel on Climate Change (IPCC). The equation can be expressed as follows:
Style: E2 is direct carbon emissions, Ti is the average annual consumption of each type of fossil energy source, θi is all kinds of fossil energy conversion standard coal coefficient, φi is the energy carbon emission coefficient.
The determination of land use carbon emission intensity relied on the area and carbon emission coefficient of each land type within the grid. It represents the carbon emissions per unit grid area, with higher intensity indicating greater ecological risk. The unit grid size in this paper is 2×2 km.
Style: C is the carbon emission intensity of land use, Si is the area of the i land use type in the grid, ωi is the carbon emission factor for the i land type, and S is the grid area.
Table 3.
Various energy standard coal and carbon emission conversion coefficient.
ESV Estimation
ESV was determined using the equivalent factor method, referencing the “ecosystem service value equivalent per unit area scale” proposed in the relevant literature. One ESV equivalent was defined as 1/7 of the average annual natural food production per hectare of farmland [26]. Utilizing data on the sowing areas, yields, and prices of the three main crops of rice, wheat, and corn in Anhui Province from 2000 to 2020, the ESV unit equivalent in Anhui Province was calculated to be 1537.78 CNY/hm2. The equation can be expressed as follows:
Style: Ea is the unit equivalent of ESV (CNY/hm2); mi is the area under crop i (hm2); pi is the average price of crop i in Anhui Province from 2000 to 2020 (CNY/t); qi is the crop i yield per unit area (t/ hm2); M is the total area under crop cultivation (hm2).
Due to the differences in ecosystems in different geographical areas, the ESV coefficients for each category in the study area need to be corrected. The ESV table was revised based on the ratio of grain production in the research area to national grain production [27]. The correction results are shown in Table 4. In this case, the ESV of the construction land is taken as 0 [15].
Table 2.
Carbon emissions coefficients of land use type. (carbon sink is negative and carbon emissions are positive).
| Types | Cropland | Forestland | Grassland | Water | Unused land |
|---|---|---|---|---|---|
| Carbon emission factor (t/hm2)) | 0.422 | -0.644 | -0.021 | -0.253 | -0.005 |
ESV intensity:
Style: VESj is the ESV of land types j, Aij is the area of land use types i in grid j, Ci is the ESV factor for land types i; S is the grid area;n for 6 land use types, m is the number of grids.
Bivariate Spatial Autocorrelation Analysis
The spatial correlation and degree of aggregation between carbon emission intensity and ESV intensity in Anhui Province were analyzed using the Bivariate Moran’s I method.
Style: I and Ii are global and local bivariate variables for carbon emission intensity and ESV intensity, respectively Moran’s; n is the grids number; wij is the n × n spatial weight matrix; xi and xj are the attribute values of grids i and j, respectively; x̅ and S2 are the mean and variance of the attribute values.
Carbon Emission Prediction
Predictions for LUCE encompass forecasts for both construction and non-construction land. The carbon emissions from construction land were directly predicted using the gray GM(1,1) model [10, 28, 29]. For non-construction land, the PLUS model was utilized to predict spatial distribution, which was then combined with carbon emission coefficients to estimate emissions [30].
Table 5.
Gray model prediction accuracy standard.
| Accuracy Class | Excellent | Qualified | Unqualified | Poor |
|---|---|---|---|---|
| P | >0.95 | >0.80 | >0.70 | ≤0.70 |
| C | <0.35 | <0.50 | <0.65 | ≥0.65 |
Based on the carbon emission data from construction land in prefecture-level cities of Anhui Province spanning 2000 to 2020, a first-order linear differential equation was formulated utilizing the GM(1,1) gray model to forecast carbon emissions from construction land from 2020 to 2030 [29]. Comparing the selected prediction results from 2010 to 2020 with the original data validates the accuracy of the predictions (Table 5). The maximum value of the posteriori difference ratio “C” is 0.25, and the minimum value of the probability of small error “P” is 0.90, indicating satisfactory model performance.
Employing the PLUS model, the spatial distribution of land use in 2020 and 2030 was projected based on data spanning from 2000 to 2020 in Anhui Province. The comparison between selected land use prediction outcomes for 2020 and the original data validated the accuracy of the predictions, yielding a Kappa value of 0.84, signifying excellent model performance. By leveraging the outcomes of land use prediction and carbon emission coefficients from non-construction land, carbon emissions from Anhui Province for the period of 2020-2030 were estimated.
Results
Temporal and Spatial Changes in Land Use
Table 6 and Fig. 3 illustrate, from 2000-2020, the intricate transfer changes among various land use types in Anhui Province. The total transfer area amounts to 11,374.77 km2, representing 8.12% of the Anhui Province. The primary land types undergoing transfer and alteration are cropland and construction land. Cropland contributed the most to the transferred area, with 8103.52 km2 transfer-out and 2791.45 km2 transfer-in, for a total reduction of 5312.07 km2. The transfer of cropland to construction land encompassed 4,648.42 km2, constituting 57.36% of the total transfer-out area. Additionally, 2277.62 km2 was transferred to forestland, accounting for 28.11% of the total transfer-in area, which promoted the expansion of forestland area. The increase of cultivated land primarily originated from forestland and water areas. Specifically, forestland accounted for 1,864.01 km2 of transfers, comprising 66.78% of the total transferred area, while water areas contributed 807.37 km2, representing 28.92% of the total transferred area.
Table 4.
ESV coefficients for each category in Anhui Province (CNY/hm-2a-1).
| Types | Cropland | Forestland | Grassland | Water | Unused land |
|---|---|---|---|---|---|
| ESV factor | 6074.242 | 30290.47 | 18550.78 | 136578.2 | 1691.561 |
Table 6.
Land use transfer matrix from 2000 to 2020.
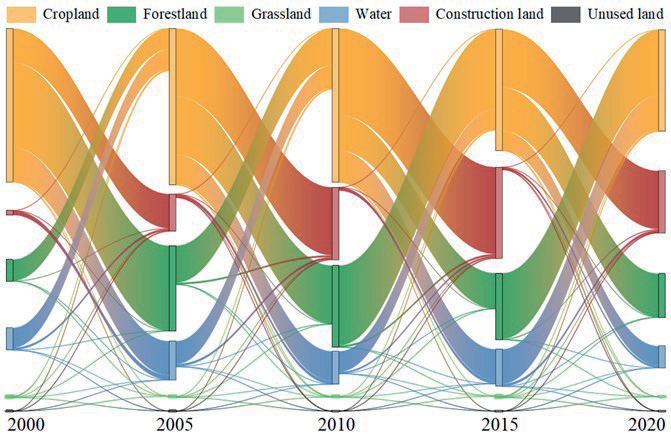
Table 7.
Carbon emissions of land use in Anhui Province (104t).
The change of construction land is less than that of cultivated land, transfer-out 206.10 km2 and transfer-in 4,933.02 km2, with the transfer-in area significantly larger than the transfer-out area, and the total area increasing from 8,479.03 km2 to 13,205.95km2, with the total area showing an upward trend. From 2010 to 2015, the most notable expansion occurred in construction land encroaching on cropland, construction land increased by 1,667.25 km2, of which 1,649.89km2 encroached upon cropland, comprising 98.96% of the cropland transfer-out area.
Analysis of LUCE
Table 7 illustrates the stage-type growth trend of LUCE in Anhui Province from 2000 to 2020, initially rising and later declining. From 2000 to 2015, there was a substantial increase in net carbon emissions, rising from 2786.56×104 tons to 12736.00×104 tons, marking an increase of 10228.30×104 tons, and the average annual growth was 17.85%. The main source of carbon emissions is construction land, accounting for 87.68% to 97.34% of carbon emissions. From 2000 to 2015, as the level of urbanization increased significantly, the construction land area and energy consumption increased significantly, and net carbon emissions also increased significantly. Thereafter, due to the implementation of the “13th Five-Year” energy conservation and emission reduction implementation plan of Anhui Province, coupled with the impact of the COVID-19 pandemic, which has resulted in a decline in energy consumption in 2020 [31], net carbon emissions showed a decreasing trend from 2015 to 2020. Carbon emissions from cropland showed an overall slow decline due to the reduction of cropland area, declining from 374.16 × 10⁴ tons in 2000 to 351.75 × 10⁴ tons in 2020, and the average annual decline was 0.30%.
The total carbon sink also tends to increase and then decrease from 2000 to 2020. Forestland is the most important carbon sink, contributing 92.83% to 93.33% of carbon sequestration, which declined after 2005. While the carbon sink of water areas fluctuates, the overall trend indicates growth.
The carbon emission intensity is categorized into five levels (I, II, III, IV, and V) based on grid carbon emissions, ranging from low to high (Fig. 4). From 2000 to 2020, there was a noticeable increase in the overall trend of carbon emission intensity in Anhui Province, and the maximum value of carbon emission intensity increased from 137.40t/hm2 in 2000 to 450.69t/hm2 in 2020, an increase of 2.28 times. The number of grids in classes V and IV increases by 11.60% from 2000 to 2020; the number of grids in classes I and II decreases year by year, by 44.58% in 20 years, with a clear characteristic shift towards class III.
Spatial and Temporal Variation Analysis of ESV
Table 8 illustrates an M-shaped growth trend in the overall ESV of Anhui Province from 2000 to 2020, with the overall ESV increasing from CNY 2537.95×108 in 2000 to CNY 2566.84×108 in 2020, reflecting a 1.14% increase. Forestland, water, and cropland emerged as the primary contributors to ESV in terms of each land use type, accounting for 43.27%, 36.94%, and 20.03% in that order. Among the remaining land types, the contribution of grassland declined slightly, and that of unused land remained stable. From the composition of land use, it was obtained that during the 20 years, construction land, forestland, and water areas showed different degrees of expansion, continuously encroaching on cropland, grassland, and unused land were all reduced to different degrees. However, the expansion of forestland and water area offset the construction land’s encroachment on cropland, resulting in a total ESV increase of CNY 28.89×10⁸.
Fig. 5 illustrates that there are obvious spatial differences in ESV intensity in Anhui Province, and the overall ESV intensity in southern Anhui Province is higher than that in northern Anhui Province. Level IV ESV intensity exhibits a broad distribution range, encompassing 39.8% of total grid numbers, primarily concentrated in areas like Dabie Mountain and southern Anhui Province. Main land use types include grassland and forestland. ESV intensity in the V interval accounted for a smaller proportion, comprising only 6.04% of total grid numbers, the main land use type for the waters, mainly distributed in the Chaohu Lake and other waters. Compared with other years, there is a significant increase of 50.18% in level Ⅰ grid from 2010 to 2020, and there is a phenomenon of transferring from level Ⅱ to level Ⅰ. Meanwhile, the level Ⅱ grid is mainly distributed in Huaibei Plain, with cropland and construction land being the primary land use types.
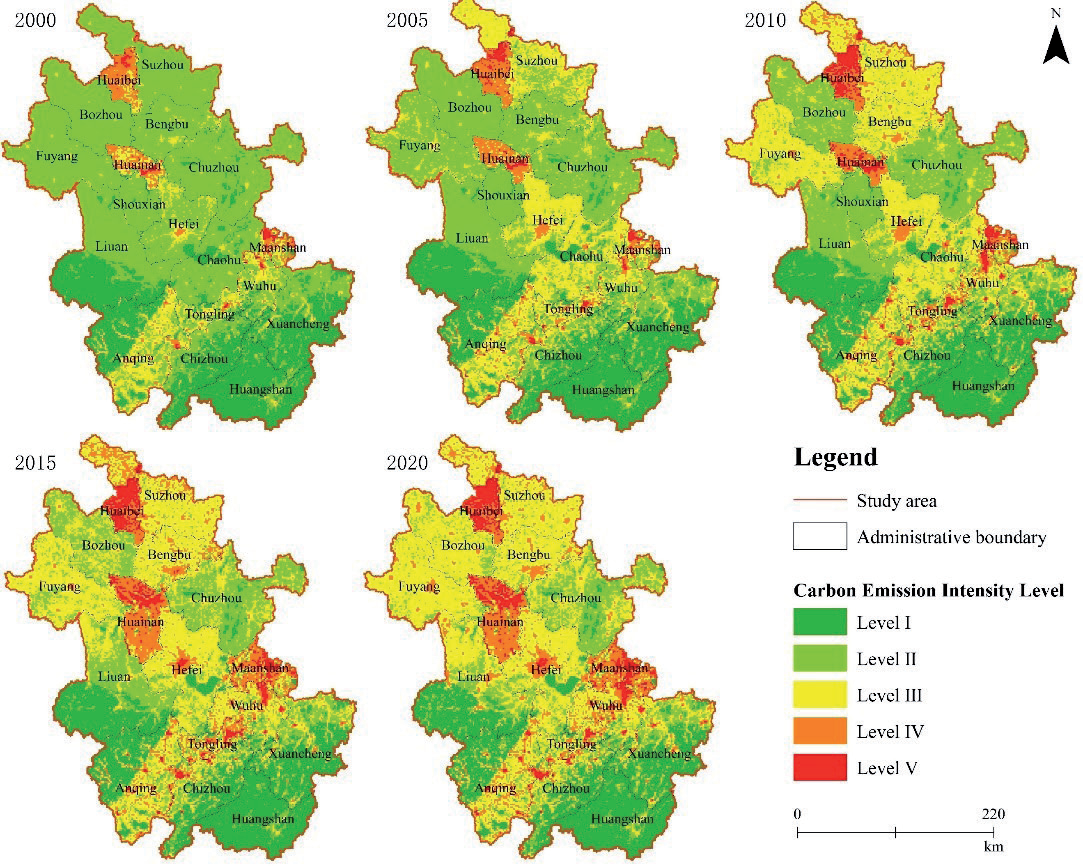
Table 8.
ESV statistics of Anhui Province.
Correlation Analyses
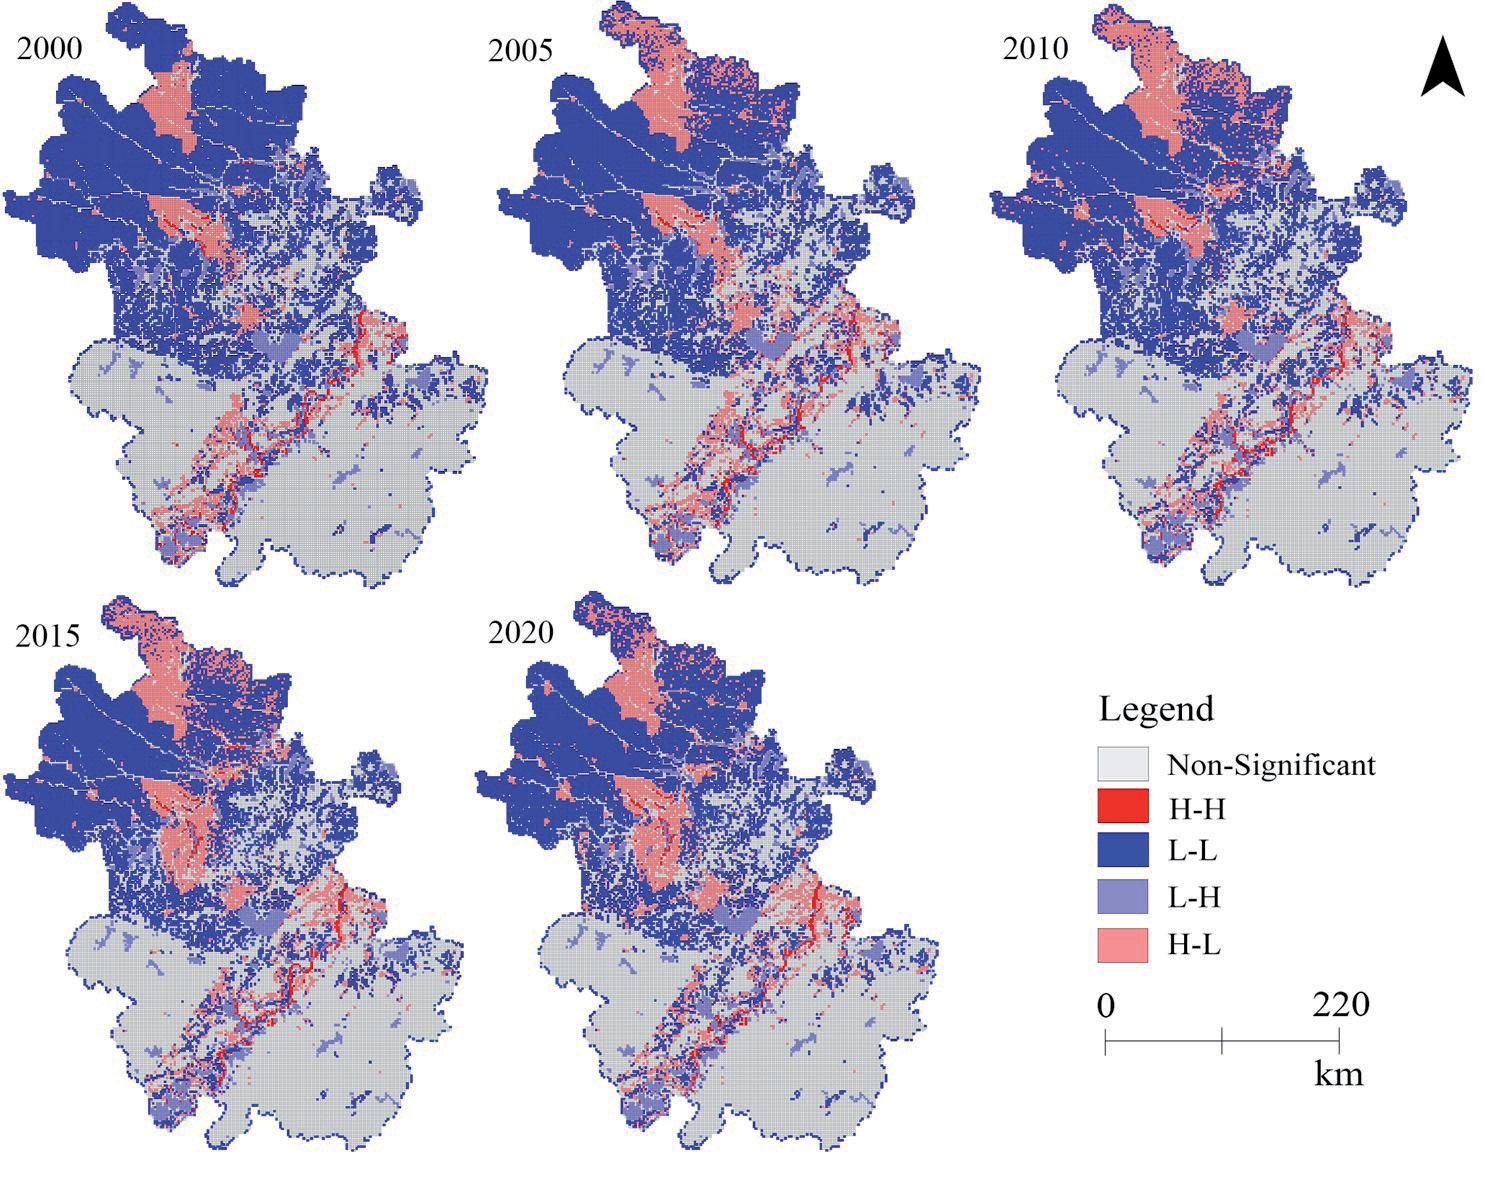
Table 9 reveals that the P-values of the correlation test results between ESV intensity and carbon emission intensity in Anhui Province are all below 0.001, and the global Moran’s I values are all negative. This highlights a significant negative spatial correlation between carbon emission intensity and ESV intensity in Anhui Province, where higher carbon emission intensity corresponds to lower ESV intensity. Furthermore, the decline in Moran’s I suggests a spatial transition from dispersion to concentration.
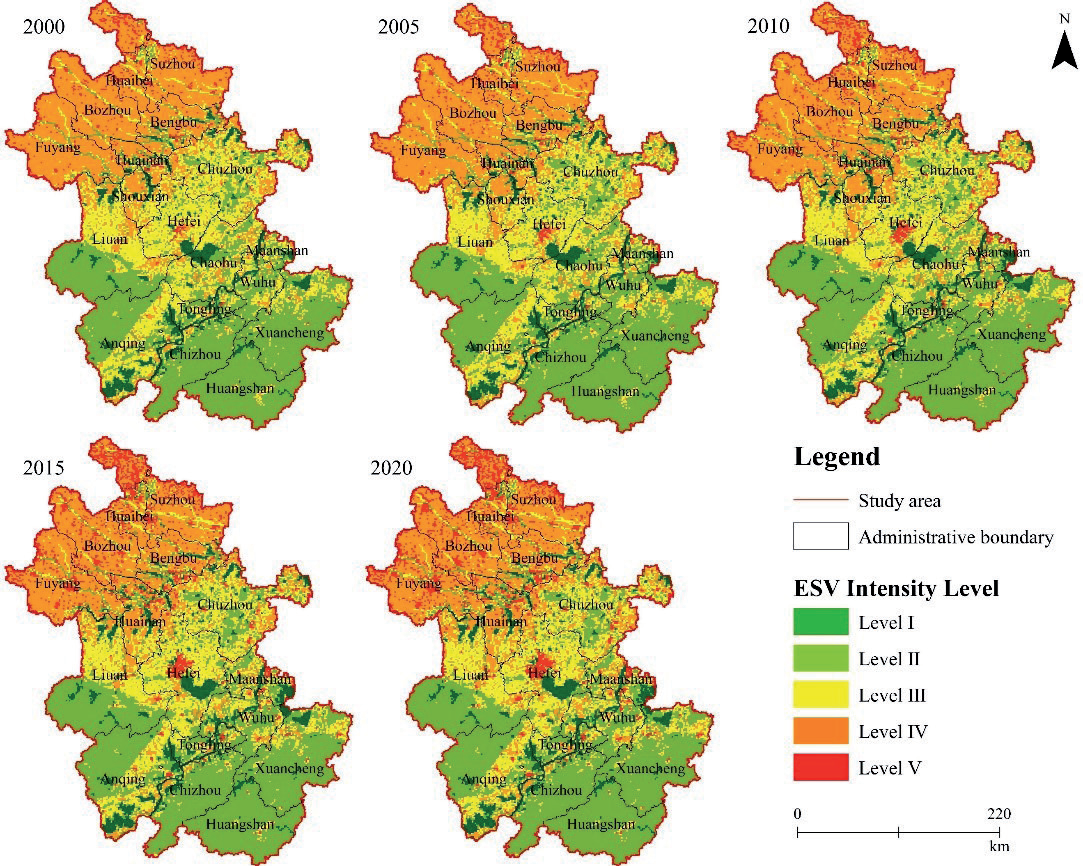
Table 9.
Bivariate global Moran’s I statistic.
| Variate | 2000 | 2005 | 2010 | 2015 | 2020 |
|---|---|---|---|---|---|
| Moran’s I | -0.062 | -0.095 | -0.100 | -0.104 | -0.115 |
| P-value | <0.001 | <0.001 | <0.001 | <0.001 | <0.001 |
| Z-value | -50.7757 | -78.182 | -83.569 | -88.871 | -97.460 |
Analyzing the LISA cluster graph (Fig. 6), it becomes apparent that there are distinct spatial clustering characteristics between carbon emission and ESV in Anhui Province. Strong correlations are primarily concentrated in the mining areas of the Huainan-Huaibei mining region and the plains along the river, while the local correlations in the rest of the surrounding areas are mainly L-L and non-significant. The H-H grid areas and L-H grid areas represent the smallest proportion of the total number of grids, accounting for 1.18% and 4.54% of the total number of grids, respectively, and are mainly along the Yangtze River for centralized and continuous development. The main reason is that this region has the Yangtze River, a natural water transportation hub, frequent economic activities, and large carbon emissions. Water bodies are ecologically important and capable of producing high ESV. The L-L grids area has the largest proportion of grids, accounting for 32.53% of the total number of grids, and is mainly distributed around the main urban areas of Huainan City, Huaibei City, and Hefei City. The main reason is that this area is located in the Huaihe River Plain, with gentle terrain dominated by cropland, low carbon emissions, and low vegetation cover, which contributes less to ESV. The number of grids in the H-L agglomeration area ranks second after the L-L agglomeration area, comprising 10.56% of the total grids. These grids are primarily situated in the main urban areas of Huainan, Huaibei, and Maanshan City, transitioning from decentralized to centralized agglomerations.
Discussion
The Relationship between Land Use, Carbon Emissions, and ESV
Existing studies primarily concentrate on administrative boundaries like national, provincial, and municipal levels [32–35], respectively studying the influence of land use changes on ESV or carbon emissions. However, there’s a lack of investigation into the spatial correlation between carbon emissions and ESV. The primary focus of this paper was to examine the spatial correlation and aggregation relationship between carbon emissions and ESV changes resulting from land use alterations in Anhui Province from 2000 to 2020 at the grid scale.
The change in land use mainly includes the change of utilization mode, the change of spatial pattern, and the change of management mode. Land use change affects the function, structure, and ecological process of the ecosystem by changing land type, vegetation cover, and resource distribution, and affects ESV [36]. In addition, land use change also has an impact on regional net carbon emissions by affecting the carbon source/sink structure and carbon cycle system [37].
During 2000-2020, LUCE in Anhui Province showed an obvious upward trend, increasing by 9,949.44×104 tons, with a growth rate of 357.05%. Construction land is the main source of LUCE. From 2000 to 2020, driven by the “integration” strategy of the Yangtze River Delta city cluster, Anhui Province’s urbanization level has increased rapidly, and the area of construction land and energy consumption has increased significantly, resulting in a significant increase in carbon emissions of construction land [38, 39]. In addition, the expansion of construction land in Anhui Province is non-linear with the increase of LUCE. Construction land in Anhui Province has always maintained expansion, and its proportion in the province has increased from 6.05% to 9.42%. However, LUCE showed a small decline in the 2015-2020 period, decreasing by 278.85×10⁴ tons, indicating that the increase in carbon emissions cannot be attributed to the expansion of construction land alone and that factors such as urbanization level and energy use efficiency also have a significant impact on carbon emission levels [40, 41].
ESV in Anhui Province shows an M-shaped growth trend between 2000 and 2020, with a slight increase of 1.14%. Despite the decline in cropland and grassland areas and the notable expansion of construction land, ESV continues to grow. This resilience is attributed to the high ecological service value of forestland and water [42]. In addition, the regional difference of the ESV supply-demand relationship in Anhui Province is obvious, and the ESV intensity in southern Anhui Province is higher than that in northern Anhui Province. Niu Junjun et al. believe that the differences in resource distribution and topographic characteristics of Anhui Province are the main reasons for this phenomenon [42]. Anqing, Huangshan, and Xuancheng in southern Anhui Province are mountainous, the expansion of construction land is not obvious, and the land use type is dominated by forestland and water, which play an important ecological regulatory role and provide 85%-94% of the ESV in Anhui Province [43]. In contrast, coal mining in the northern part of Anhui Province, particularly in the mining areas of Huainan and Huaibei, has resulted in surface subsidence and water accumulation [44]. This has led to an expansion of water bodies, a reduction in cropland area, and an overall increase in ESV.
An evident negative spatial correlation between carbon emission intensity and ESV intensity is observed in Anhui Province, with distinct clustering evident around the Huainan-Huibei mining area and cities along the river, including Wuhu, Tongling, and Maanshan. Similar to the spatial relation obtained by [45], take Chengdu-Chongqing urban agglomeration in China as the research object. The local spatial aggregation characteristics of the two are similar to the results of [46] research, which shows the development trend of dispersed to centralized. The province has developed coal industry chain clusters, primarily located in Huainan and Huaibei, aiming to enhance regional core competitiveness and achieve rapid economic development through the synergy of industry clusters [47]. In central Anhui Province, cities such as Maanshan, Wuhu, and Tongling have accelerated the process of new urbanization and industrialization through large-scale undertaking of industries in coastal cities and realized intensive urban development.
LUCE Prediction
The forecasting of carbon emissions in this paper employs the GM (1, 1) gray model alongside the PLUS land use prediction model. Additionally, employing the gray model directly for predicting carbon emissions from construction land helps prevent errors stemming from multiple predictions with IPCC energy conversion factors [10].
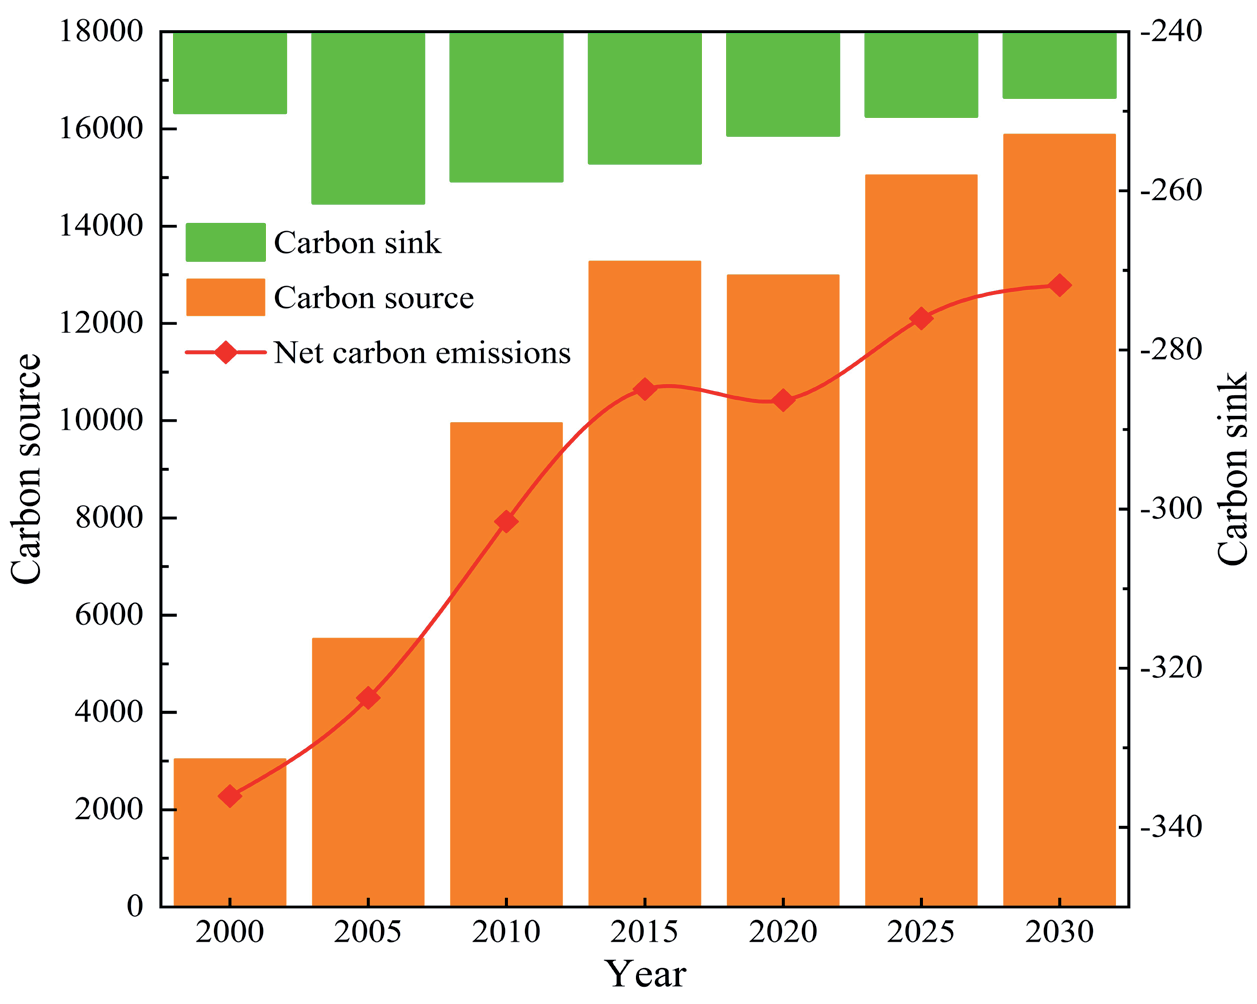
The forecast results show that LUCE in Anhui Province is in a state of constant growth and eventually stabilization, but it is difficult to achieve carbon emissions before 2030 (Fig. 7). Lu Yanfei et al. believe that Anhui Province is expected to achieve the carbon peak before 2040 under the condition of maintaining the historical development status [48]. However, the growth rate of LUCE in Anhui Province from 2020 to 2030 is significantly lower than that from 2010 to 2020. LUCE in Anhui Province increased from 12735.98×104 tons in 2020 to 15630.62×104 tons in 2030, with a total increase of 2894.64×104 tons, an average annual increase of 2.27%. The decrease in the external expansion rate of construction land is an important reason for the slowing down of the growth rate of LUCE. Since Anhui Province fully joined the Yangtze River Delta city cluster in 2019, intensive land management has been further strengthened [49, 50]. In the forecast results of this paper, construction land in Anhui Province will expand by 1371.80 km2 from 2020 to 2030, with an average annual growth rate of 1.04%, significantly lower than the 2.69% from 2010 to 2020.
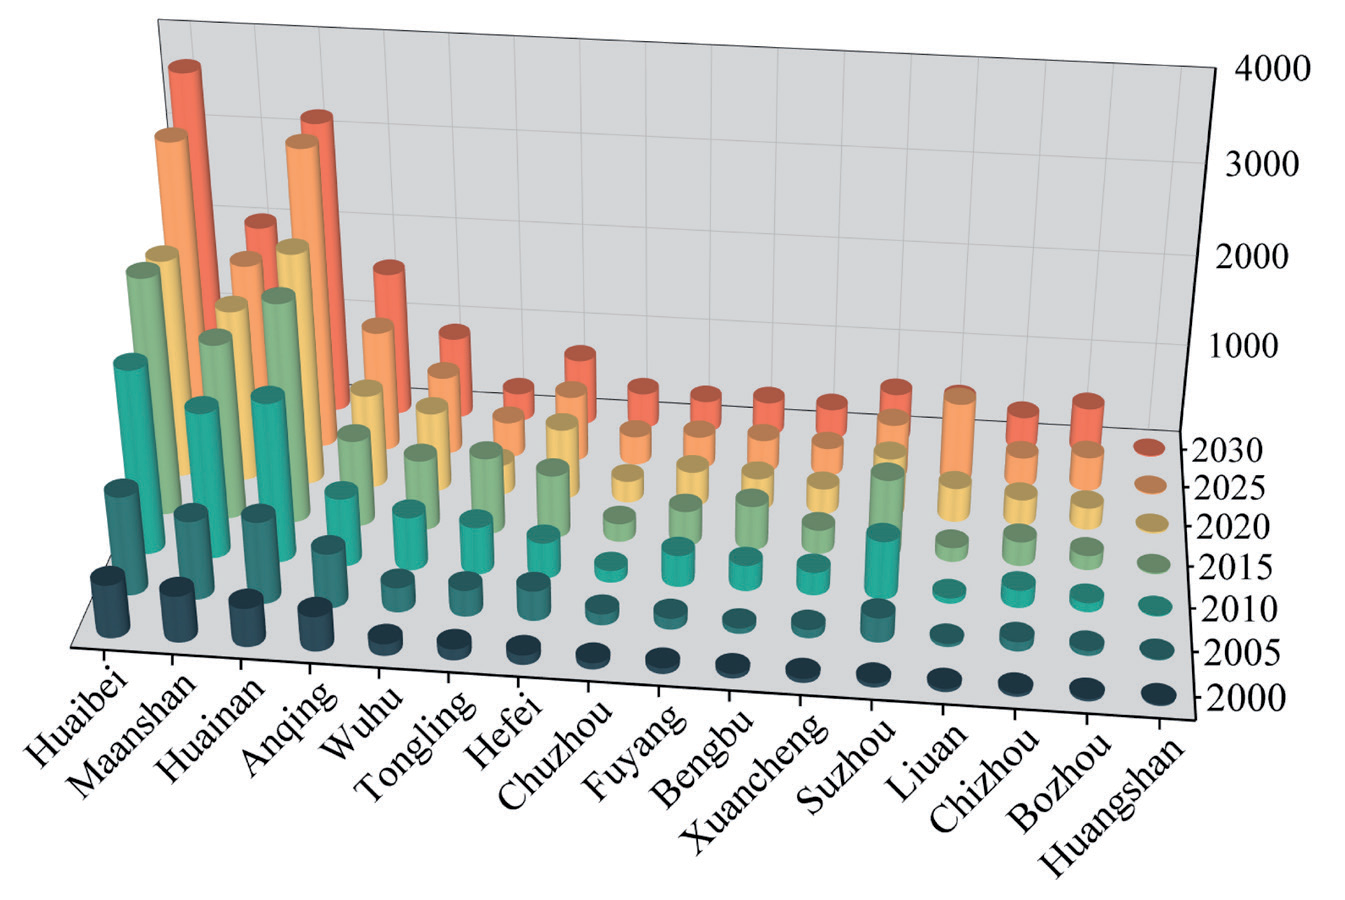
LUCE trend in Anhui Province’s prefecture-level cities from 2000 to 2030, indicating a general upward trajectory (Fig. 8). Industrial resource-based cities such as Huaibei City, Maanshan City, Huainan City, and Anqing City are the main carbon sources, accounting for 60.72%-71.98% of the net carbon emissions in Anhui Province. Consequently, regulating carbon emissions in resource cities becomes pivotal for achieving the dual-carbon target. The data reveals a varied slowdown in the growth rate of carbon emissions from resource cities between 2020 and 2030. Notably, Huainan and Maanshan cities exhibit the most significant reductions, with average annual carbon emissions growth rates declining to 2.66% and 0.85%, respectively.
The research indicates that by 2030, construction land, forestland, and water areas in Anhui Province will cover 10.41%, 25.58%, and 4.96% of the total area, respectively. Net carbon emissions are projected to rise, far exceeding carbon sinks. Meeting the target of peak carbon dioxide emissions by 2030 continues to pose a significant challenge. Regarding carbon emission spatial patterns, industrial resource-centric cities like Huaibei, Maanshan, Huainan, and Anqing emerge as primary carbon sources, contributing 60.72% to 71.98% of the province’s total emissions.
This paper proposes the following recommendations for the urban development traits in Anhui Province:
(1) To address the challenges posed by major carbon-emitting cities like Huainan, Huaibei, and Maanshan, predominantly industrial hubs, efforts should be directed towards restraining the expansion of construction land, optimizing land resource utilization, prioritizing the shift of resource cities towards eco-friendly industries, addressing historical resource depletion, and strategically enhancing water bodies and forest cover to bolster carbon sequestration. These measures aim to sustain economic growth, mitigate carbon emissions, enhance ESV, and advance high-quality regional development and the dual-carbon objective. (2) For low-carbon cities such as Huangshan, Bozhou, and Lu’an, where cultural tourism is the mainstay, we should continue to strengthen the protection of forestland and water areas, construct reasonable ecosystems, improve eco-efficiency, optimize the distribution of resources, and increase the ESV of the region so that we can better act as a guarantee of ecological security.
Prospect and Deficiency
The study has the following limitations: (1) The standardization of carbon emission coefficients across various land types, both domestically and internationally, remains incomplete. This paper draws on the research results of the IPCC and related scholars and combines large-scale statistical data at the provincial level to estimate the carbon emission coefficients, but due to the different realities, these results may have a certain degree of spatial heterogeneity. Future research should delve into the carbon emissions produced by various land use types in cities with diverse dominant industries and tailor carbon emission coefficients to suit each city’s characteristics. (2) When predicting future carbon emissions from construction land, this study encountered limitations in acquiring energy data. Only 10 types of energy data were selected for carbon emission accounting, overlooking policy regulations’ binding nature, such as carbon emission reduction. Therefore, more comprehensive models and methods can be selected in the future to take local policies such as carbon emission reduction into account.
Conclusions
(1) Various levels of transformation were observed among land types in Anhui Province from 2000 to 2020, totaling 11,374.77km2 in transferred area, constituting 8.12% of the study area’s total. Cropland and construction land are the main land types that undergo transfer changes, in which construction land area increases by 4726.91km2, and cropland contributes the most to the construction land area, accounting for about 98.34%.
(2) From 2000 to 2020, the net carbon emissions displayed an inverted “V” growth pattern, marked by nodes in 2010 and 2015. Initially, carbon emissions surged between 2000 and 2010, followed by a deceleration from 2010 to 2015, and subsequently a decline from 2015 to 2020. The carbon emission intensity was on the rise, with an overall spatial distribution increasingly concentrated. The core, centered around the Huainan-Huaibei mining area in the northern part of Anhui Province, exhibits a double-core circular distribution. Conversely, the southern part, aligned with the Yangtze River, demonstrates a belt-shaped aggregation, extending from east to south.
(3) From 2000 to 2020, the ESV in Anhui Province followed an M-shaped growth trajectory, with 2010 marking the trough point. Over this period, ESV experienced an overall increase of CNY 28.89×10⁸, representing a growth rate of 1.14%. ESV intensity in Anhui Province differs significantly from north to south, and the ESV intensity in the south of Anhui Province is higher than that in the north. The ESV intensity grid in southern Anhui Province is dominated by levels Ⅳ and Ⅴ, with a large ESV contribution rate, and is an important ecological regulation base in Anhui Province.
(4) In Anhui Province, there exists a notable adverse spatial correlation between the intensity of ESV and the intensity of LUCE. As carbon emissions rise, ESV diminishes accordingly. Spatially, these exhibit evident aggregation patterns, with high-concentration zones primarily situated within urban areas along the riverside city belt and insignificant aggregation in the surrounding areas. Additionally, H-L aggregation areas cluster around the Huainan and Huaibei mining areas, while L-L aggregation areas are dispersedly located around H-L clusters.
(5) From 2020 to 2030, there was a staged growth trend in net carbon emissions in Anhui Province, rising by 2,894.64×104 tons. The primary carbon sources are the industrial resource-oriented cities of Huaibei, Maanshan, Huainan, and Anqing, contributing 60.72% to 71.98% of the total CE in the province.

