

Introduction
Ecosystem services (ES) refer to the contributions of ecosystem structure and function to human well-being, encompassing various benefits such as the provision of food and goods, air purification, carbon storage, biodiversity conservation, and climate regulation [1- 2]. The ecological response to land use change and its impact on ES have increasingly become a central focus of land use change research and a prominent area within ecological research [3-5]. The evolving patterns of land use have profound effects on ES and present new challenges for sustainable economic and social development. As a result, it has garnered significant attention from scholars both domestically and internationally. Each ecosystem service, as a fundamental component of the biosphere, possesses a distinct value that cannot be substituted by other services [6-7]. These services play a crucial role in promoting the sustainable development of the environment and have gained growing recognition for their diverse benefits conferred by ecosystems.
The study of ESs and their economic value began in the 1970s, when researchers started exploring these concepts. In 1977, WESTMAN introduced the notion of "Nature's Services" and proposed methods for evaluating their value [9]. However, during that time, the lack of appropriate evaluation theories and methodologies hindered precise measurement of the value associated with most services provided by Earth's ecosystems, resulting in slow progress in research.
In 1997, Daily and Constanza, among others, synthesized research findings on ESs from various scientific journals, utilizing different methods. They categorized the global biosphere into 16 ecosystem types and identified 17 types of ESs [10-11]. In the same year, Pimentel et al. conducted a comprehensive review and analysis of international studies on the value of natural capital and ESs. They also conducted a comparative study on the economic value of biodiversity worldwide and in the United States [12-13].
Over the past three decades, ES valuation and assessment methods in China have primarily focused on land use and the impact of changes in food production and biodiversity on ESs [14-15]. In terms of ecosystem service value (ESV) assessment, Costanza et al. made significant contributions by pioneering the theory and providing ideas and methods for subsequent studies. Fu Bojie et al. [1] engaged in an important discussion on the concept, assessment methods, and ecological mechanisms of ESV. Xie Gaodi et al. conducted relevant studies based on Costanza et al.'s evaluation methods and proposed an equivalent factor table specifically applicable to ESV assessment in China [16]. Since then, many scholars have utilized this equivalent factor table to directly calculate the service value of different ecosystems at various scales [17-18]. Human activities, particularly land-use/land-cover change (LULCC), have a significant impact on the functioning of ESs [19-20]. LULCC is a key driver of landscape change in terrestrial ecosystems, and its ecological implications have garnered increasing attention from scholars worldwide [21]. The preservation of ESs is vital for achieving sustainable development. The findings of the Millennium Ecosystem Assessment (MEA) revealed that two-thirds of all ESs have deteriorated over the past 50 years, with these degradations likely to have substantial adverse effects on human well-being [22]. The negative impacts of LULCC on ESs are diverse and primarily result in imbalances between the supply of ESs and the demands of humans and other organisms [23]. Previous studies have played a crucial role in providing valuable insights and guidance for land and environmental managers, policymakers, and stakeholders in terms of optimizing ES provision and land-use planning [24]. In the past decade, numerous scientific papers have evaluated ESV by utilizing land-use data and exploring the relationship between land-use changes and ESV [25]. These studies have demonstrated that employing land-use data is an effective approach for estimating ESV [26-27]. However, there have been relatively few studies conducted on the relationship between LULCC and ESV at the regional level, particularly in the context of oasis-river-desert ecosystems, and even fewer on the estimation of ESV in arid areas with rivers and valleys.
The inland river in arid regions is a distinctive ecosystem unit and plays a fundamental role in supporting the survival and development of human populations in these arid areas.
In recent years, the arid oasis region has experienced rapid socio-economic development, leading to significant impacts on the ecological environment of lake basins. This impact stems from a combination of natural factors and human activities such as climate change, industrial development, agricultural practices, and water resource management [28]. These factors have greatly influenced the ecological health of the lakes in the region. Particularly in the Hotan oasis, the wetland ecological environment has undergone severe degradation due to accelerated human activity. This degradation is characterized by a significant reduction in wetland area, ongoing deterioration of marsh landscapes, a substantial decline in biodiversity, and a noticeable increase in water salinity [29-30].
These factors have had a significant impact on the structure, function, stability, and ecological security of the Hotan oasis. Situated on the southern margin of the Taklimakan Desert, the Hotan oasis faces a fragile ecological environment characterized by droughts and sandstorms. Furthermore, excessive land reclamation, water resource scarcity, and accelerated rates of salinization and desertification have further destabilized the ecological environment. This study aims to address the following questions: (1) To evaluate the long-term changes in land use of Hotan oasis. (2) Quantify changes in ESs by using value coefficients from 1980 to 2020 and assess the influence of socioeconomic progress on the time series ESV. (3) Examine the impact of arid land, river, and oasis land-use changes on the value of ESs in the Hotan oasis. (4) Identify the natural and social factors that influence the ESV in the Hotan oasis.
These quantitative analyses are of utmost importance as they provide valuable insights for land-use planning in arid land river basins. Furthermore, they offer scientific guidance for Eco-environmental protection and the sustainable development of the arid land in the Hotan oasis.
Materials and Methods
Study Site
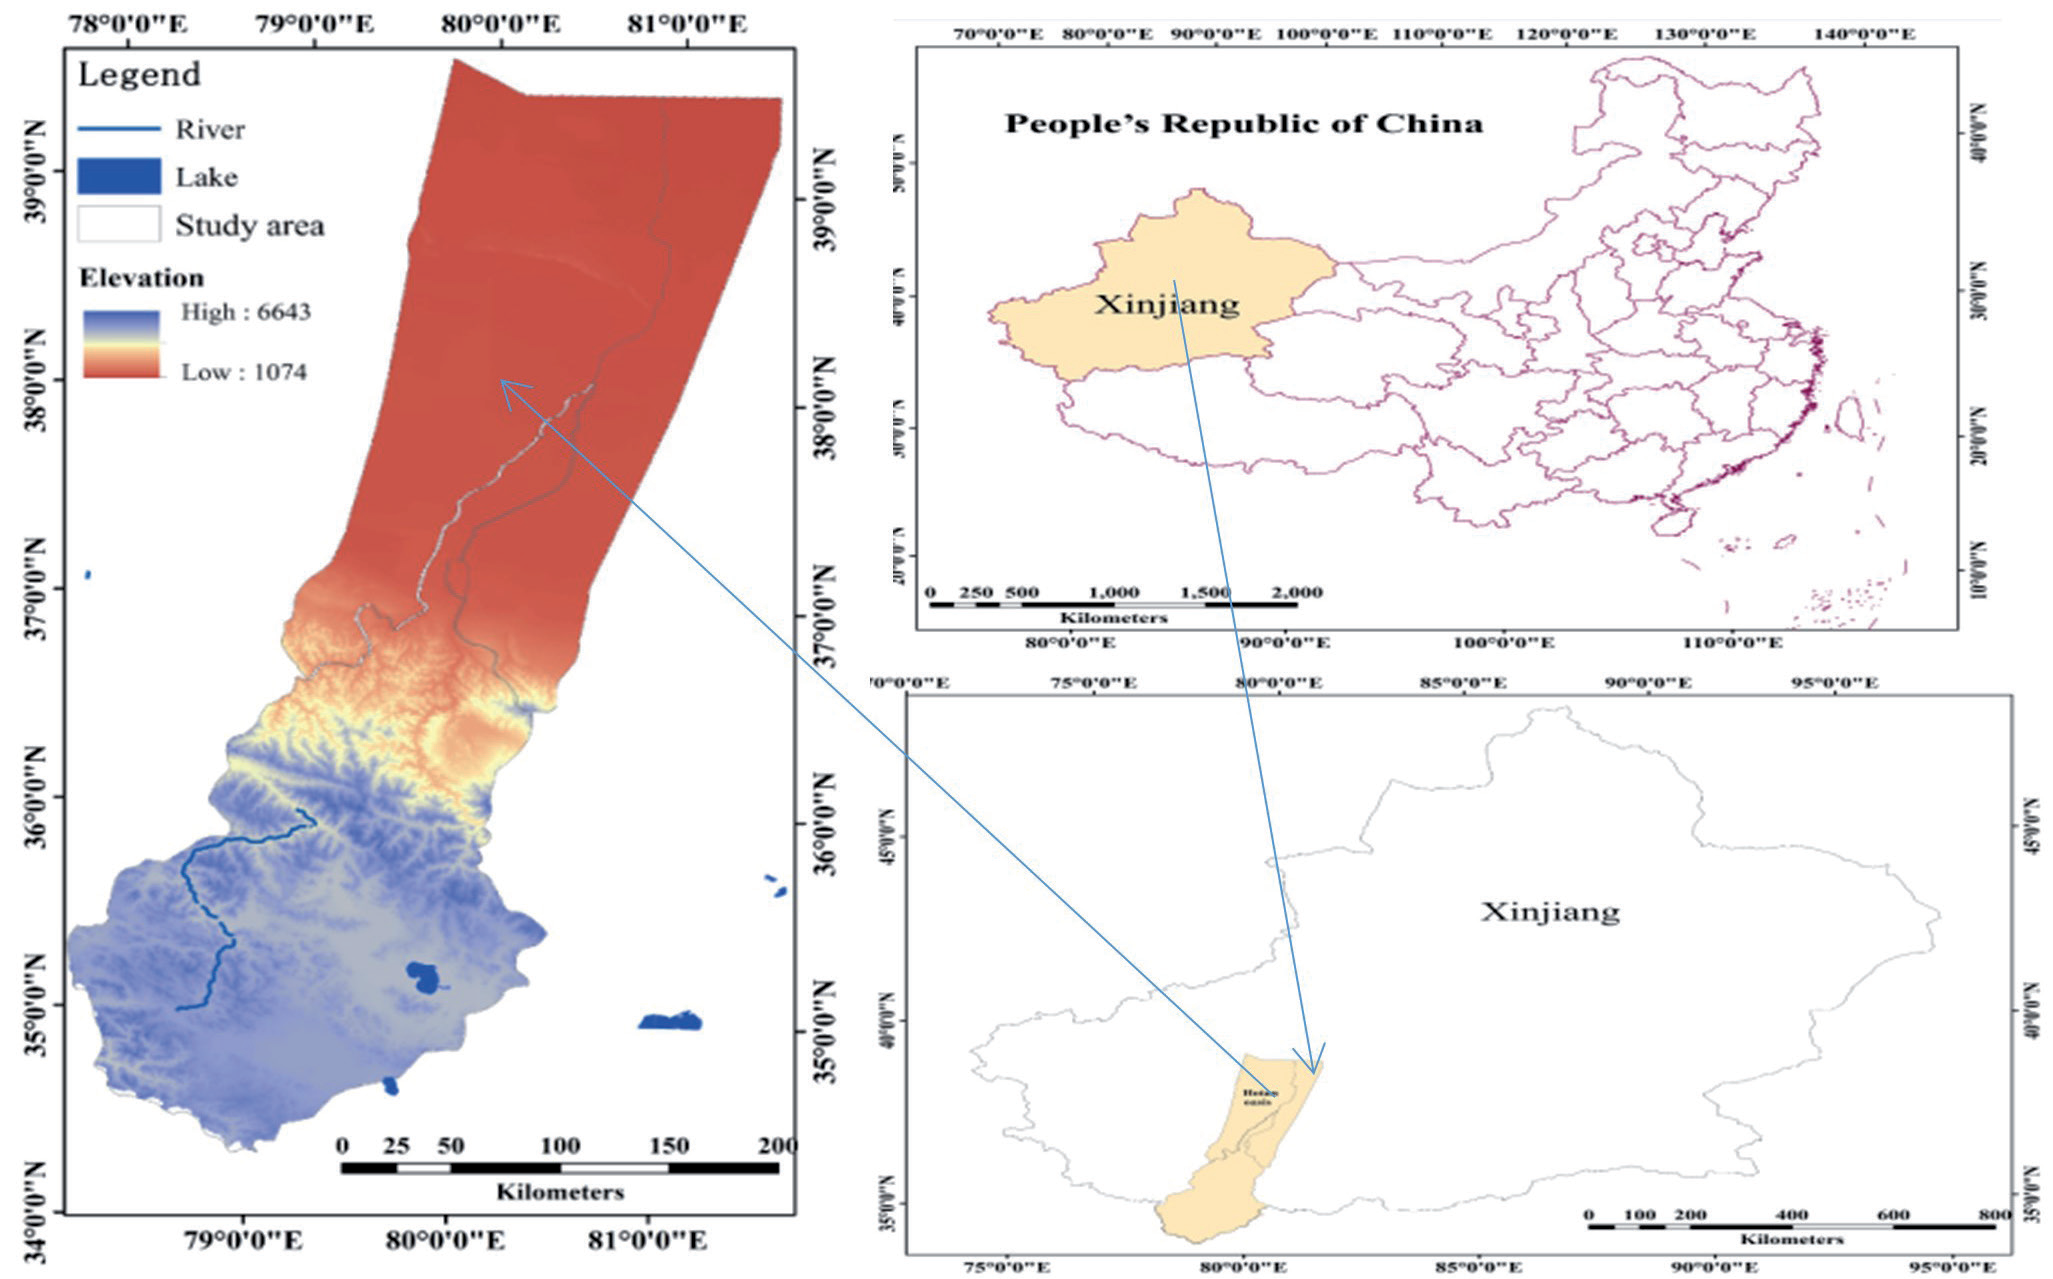
The Hotan oasis is situated in the Xinjiang Uygur Autonomous Region of Northwest China, spanning latitudes 34°22′N to 39°38′N and longitudes 78°01′E to 81°33′E. It covers an area of 7917.5 km2 and is located on the northern slope of the Kunlun Mountains and the southern margin of the Taklamakan Desert. The oasis encompasses the Hotan River and three counties: Hotan, Lop, and Krakax, as well as the city of Hotan (Fig. 1). The Hotan River represents the primary watercourse in this region and is an important tributary of the Tarim River [31]. In terms of topography, the Hotan oasis exhibits distinct features, with expansive mountain ranges dominating the southern part, narrow plains hosting oases in the middle-lower regions, and an extensive desert spanning the northern area. Climate-wise, the Hotan oasis experiences a typical inner-continental climate, characterized by an average annual temperature of 17.5℃ and an average annual precipitation of 41.8 mm [32]. The Hotan oasis exhibits a relatively low diversity of vegetation types, resulting in a relatively simple ecosystem structure. The majority of the population in the Hotan oasis is engaged in agricultural activities. The Yulongkash River and Karakash River, both of which are major tributaries of the Hotan River, are responsible for the formation of the entire oasis. This has resulted in a typical landscape system of artificial oases in the region. End of 2020, the total population of the study area was 173.03×10⁴ [33].
Data Collection
To conduct this study, we utilized land-use and land-cover (LULC) classification data derived from Landsat series images, including multi-spectral scanner (MSS), thematic mapper (TM), and operational land imager (OLI) images from 1980, 2000, and 2020. These images were freely downloaded from the United States Geological Survey (USGS) website. To support the analysis, various data sources were utilized, including socioeconomic data, climate data, hydrological data, an equivalent ESV coefficient, and local development policies. The socioeconomic data (time series: 1956- 2020) and local development policy materials were obtained from the Hotan region`s statistical yearbooks and relevant literature sources. Climate data (time series:1956-2020) were obtained from Meteorological data from the National Earth System Science Data Centre. Hydrological data from (time series:1956-2020) Tarim River authority.
Data Pre-Possessing
In this study, the remote sensing data underwent geometric corrections and masking using ENVI 5.3 image software, with the 1:10,000 topographic maps serving as a reference. To ensure spatial accuracy, all databases were re-projected to the Gauss-Krüger projection. Through geometric correction and geo-referencing techniques, the average location errors in the images were controlled to less than one pixel (30m). The LULCC data for the Hotan oasis were obtained from MSS/TM/OLI imagery. Considering the specific conditions of the study area, a supervised classification algorithm was employed, combining a maximum likelihood classification method with textural analyses. This approach allowed for the differentiation of various landscape categories during the image classification process [34]. To classify land use and land cover, we adopted an international land use and land cover classification system proposed by Di and Jansen (2000) [26], specifically designed for arid landscapes. Following this approach, the land use and land cover in the research area were predominantly divided into the following types: farmland, woodland, grassland, water bodies, construction land, unused land, and wetland. The correction of the results was validated based on the 1980 and 2000 LUCC maps, which were obtained from the Data Center for Resources and Environmental Sciences, CAS, and the 2020 result was validated based on a ground truth investigation, which was carried out by our research group. For each time period, 900 samples are selected for the evaluation of the classification results, and 100 samples are guaranteed for each land use type. In addition, one of the authors has conducted field investigations in the study area several times and has a rich experience of the landscape of Hotan oasis. The accuracy of the classification for the tree periods (1980, 2000, and 2020) was 89%, 92%, and 90.1%, and the Kappa coefficients were 0.881, 0.908, and 0.89, respectively, indicating that the classification results meet the accuracy requirement of land use classification.
LULC Analyzing Indices
The absolute dynamic index: The absolute dynamic index (ADI) is used to directly measure the change rate and magnitude of a single land use type and represents the variations between different classes in a region during a certain study period [35]. The general formula for ADI is:
where Rb and Ra represent the areas of a certain LULC class at the initial date and final date, respectively, and T indicates the study period.
Land use transfer matrix (Wij): Land use transfer matrix (Wij) is used to describe the dynamic transformation of each LULC type in the monitoring period [36]. It can be calculated as:
ESV Assignment
To assess the ESV of each of the seven land-use categories, we employed established research methods introduced by Costanza and Xie et al. [37]. These methods involved identifying the main representative biome in the research area. Based on this, we extracted the equivalent weight factor for ESs per hectare of terrestrial ecosystems in China. Subsequently, we made modifications to the value coefficient specific to the study area (Table 1). By utilizing these approaches, we aimed to quantify and evaluate the contribution of each land-use category to the overall ESV in the study area. The modified value coefficients allowed for a more accurate estimation of the ESVs associated with the different land-use types present in the Hotan oasis.
Table 2.
ESV of unit area of different land-use categories ($·ha−1·year−1). [6]
Calculation of ESV
In this study, ESVs and ecosystem service function (ESF) of total land use and land cover categories in the Hotan oasis were obtained using the following equation:
where ESVk, ESVf, and ESV refer to the ESV of land-use categories k, the ESF value of service function type f, and the total ESV, respectively; Ak is the area (ha) for land-use type k; VCkf is the value coefficient ($·ha-1·a-1) for land-use type k; and f is the ESF type. By calculating each LULC category in 1980, 2000, and 2020, the variation in ESV in the Hotan oasis was estimated [2, 6].
Sensitivity Analysis (CS)
As mentioned above, because the biomes used as proxies for our land use and land cover categories were not identical matches, uncertainties were associated with value coefficients according to previously published work. A further sensitivity test was necessary to analyze the percentage variation in the ESV for a given percentage variation in a value coefficient and to test how the coefficient value change influences the ESV change. As such, we used a CS to evaluate the ESV changes for each change in value coefficients according to the following equation: In this test, the coefficient sensitivity was calculated using the standard economic concept of elasticity [38]:
Where VC is the value coefficient, ESV is the estimated ESV, i and j refer to the original and adjusted values, respectively, and k refers to the land-use types. According to the sensitivity analysis, if coefficient sensitivity is smaller than 1, then the estimated ecosystem value is elastic with respect to that coefficient; however, if coefficient sensitivity is more than 1, then the estimated ecosystem value is considered to be inelastic [39].
Results
Dynamics of LULCC
The land-use change classification results for the Hotan oasis from 1980 to 2020 are presented in Table 2. The analysis of LULCC over the 41-year period reveals that unused land continues to dominate the land cover in the Hotan oasis. Its coverage increased from 74.62% of the entire area in 1980 to 75.33% in 2020. The second-largest cover type, grassland, decreased from 18.07% of the entire area in 1980 to 16.62% in 2020. Examining the LULCC classification results depicted in Fig. 2, it becomes evident that the most significant changes occurred in the central parts of the study area, where human activities exerted a substantial impact on the land cover of the oasis. Farmland witnessed a notable increase from 1.62% of the total land area in 1980 to 2.85% in 2020. Woodland initially experienced an increase, followed by a subsequent decrease, resulting in an overall increase from 0.37% of the total land area in 1980 to 0.4% in 2000 and subsequently declining to 0.36% in 2020. Conversely, water bodies decreased from 4.31% of the entire area in 1980 to 3.70% in 2020.
Table 3.
Patterns of land-use change in the Hotan oasis in 1980, 1988, 2000, 2008, and 2020.
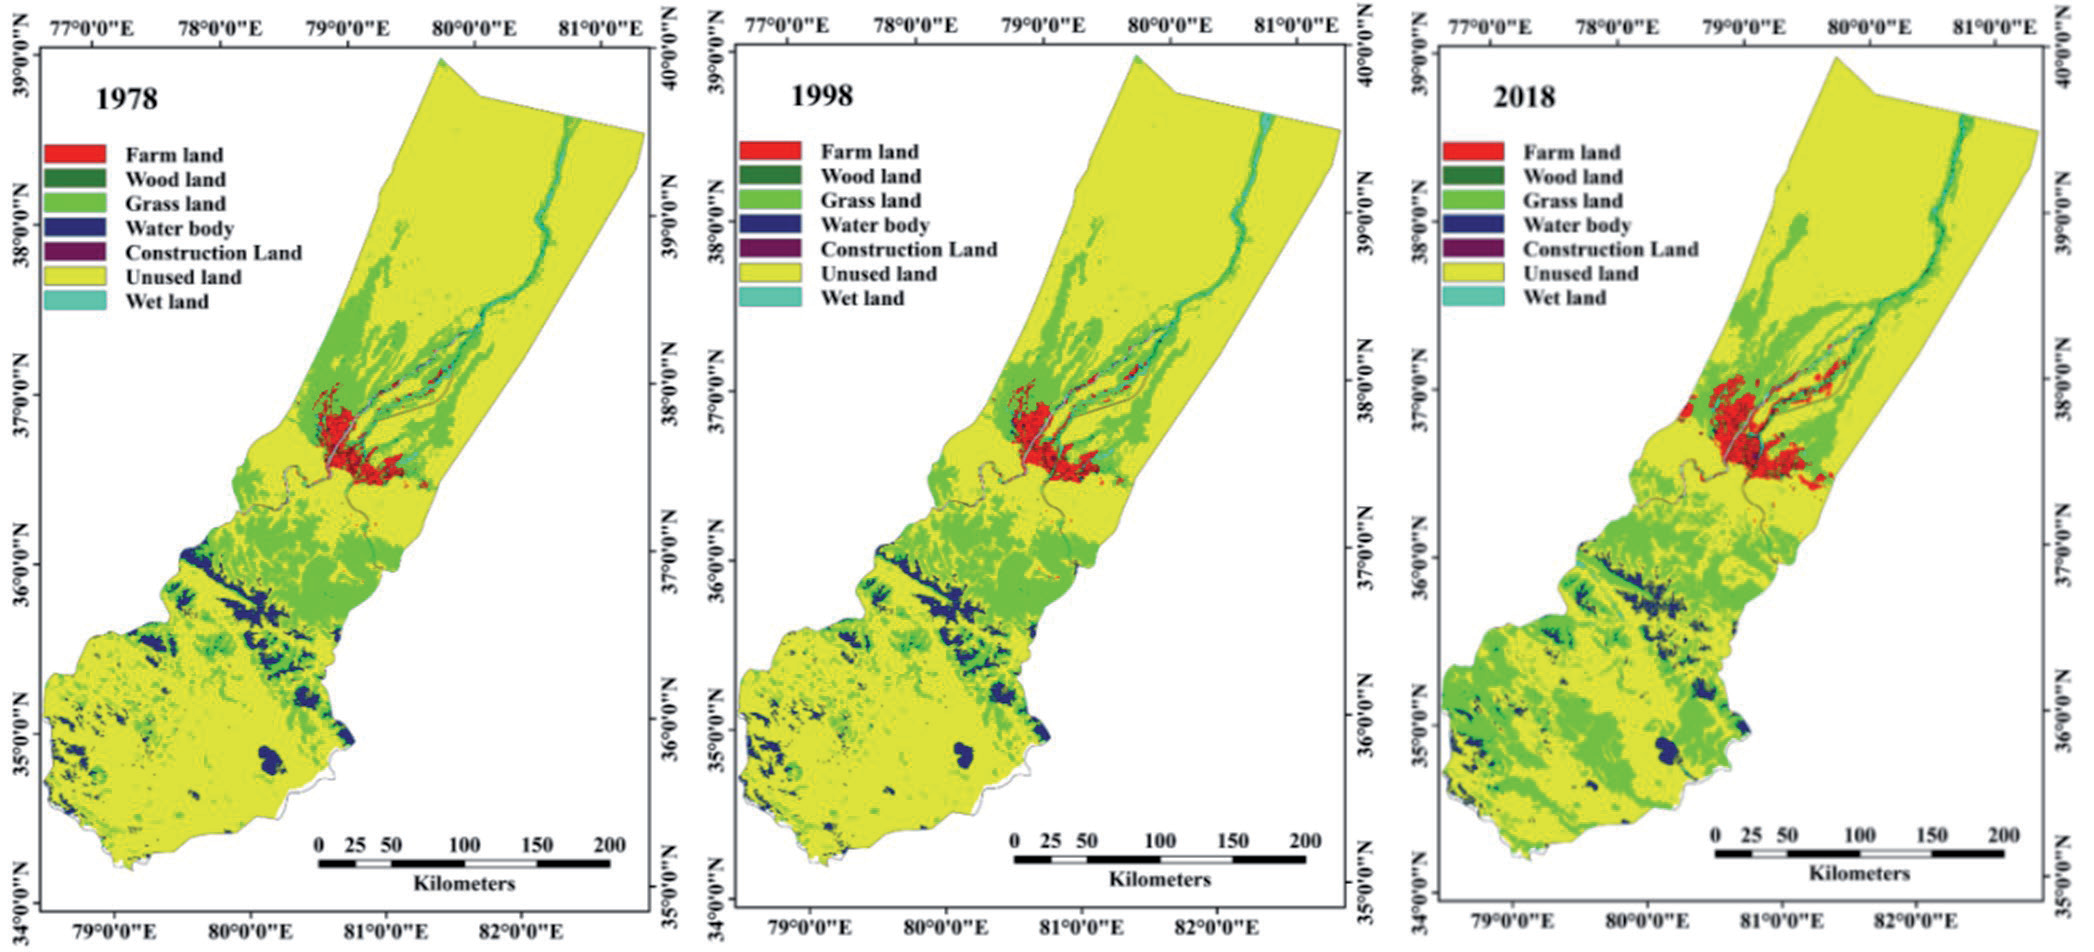
Construction land consistently increased, expanding from 0.27% of the total land area in 1980 to 0.44% in 2020. In contrast, wetlands exhibited a fluctuating pattern, initially increasing from 0.75% of the total land area in 1980 to 0.89% in 2000 and subsequently decreasing to 0.69% in 2020. Despite the relatively small areas they cover, wetlands and water bodies in the Hotan oasis play crucial roles in providing ESs and hold high service values. Although they only encompass approximately 4.8% of the total area, wetlands and water bodies contribute significantly to the overall ESV in the study area.
The significant changes observed in wetland and water bodies, as well as the simultaneous expansion of farmland, can be attributed to rapid agricultural development, inadequate regulations for wetland protection, and unsustainable management and utilization of water resources. These factors have had a profound impact on the landscape and ecosystem dynamics within the Hotan oasis.
Land-use Conversion
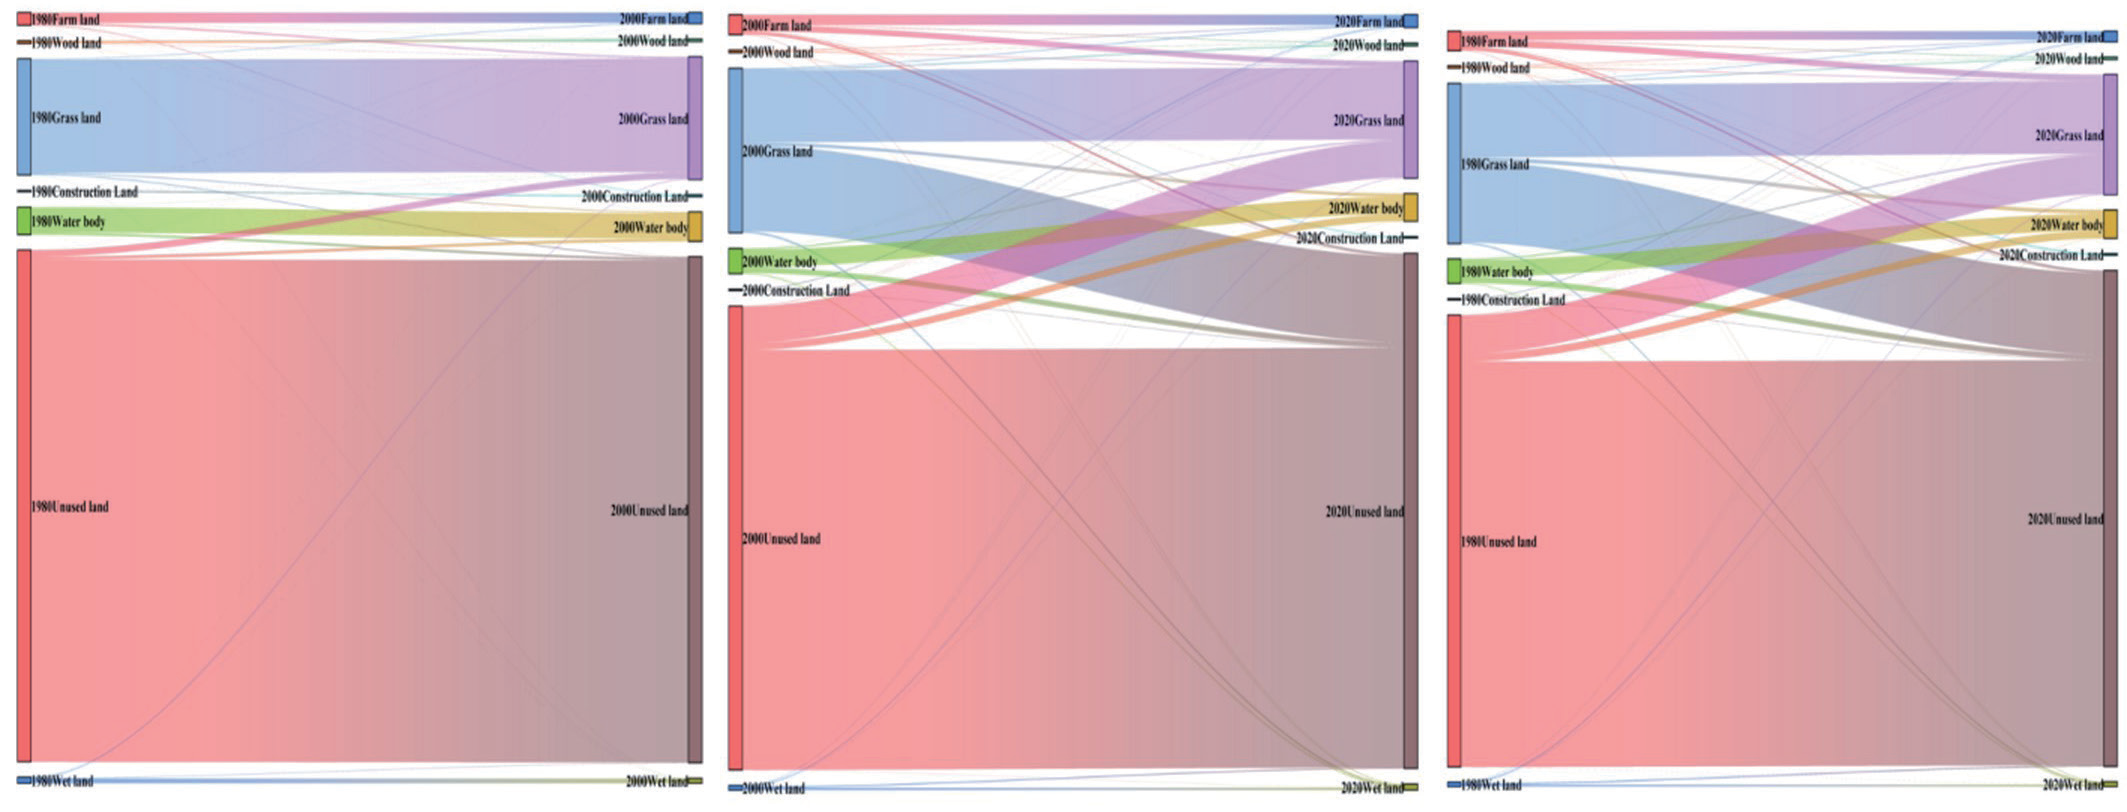
The land use/cover classification maps provide a vivid depiction of the notable changes that have taken place in land use within the Hotan oasis over the past 41 years (Fig. 3). Among these changes, one of the most striking is the substantial reduction of grasslands in the northern mountain areas since 1980. A significant portion of these grasslands has been converted into cultivated lands. Furthermore, in the oases situated in the middle and central parts of the Hotan oasis, there has been a noticeable expansion of cultivated land since 1980. These changes underscore the dynamic nature of the Hotan oasis landscape and the profound influence of human activities. The conversion of grasslands into cultivated lands signifies the intensification of agricultural practices and the utilization of available water resources for agricultural purposes. These transformations have likely had significant impacts on the ecological characteristics and the provision of ESs within the Hotan oasis throughout the study period.
ESV Changes
We estimated the total ESV for the Hotan oasis from 1980 to 2020 according to the ESV per unit area of different land-use types (Table 1) and total areas of different land-use types (Table 2). These results are displayed in Tables 3 and 4. According to Table 3, the total ESV of the Hotan oasis declined from $4,587.1 million in 1980 to $4,532.245 million in 2020. This indicates a decreasing process: approximate cumulative loss of ecosystem value of $342.679 million during the 41 years.
The decreasing change in ESV was mainly caused by the decreasing area of grassland, water body, and wetland, which provide more service value in the Hotan oasis. Overall, the changes in ESV that were mainly caused by the changing grassland, water body, and wetland area were about $443.26 million. The variations in the ESV of each land-use type corresponded to LULCC trends during 1980–2020. Although farmland, construction land, and unused land were ESV increasing types, their contributions to total ESV were less than the contributions of grassland (high coefficient value and large area), water body (high coefficient value and large area), and wetland (highest coefficient value) to the total ESV. Due to the relatively large area and high coefficient value, the ESV provided by water bodies was the highest among the seven land-use types, providing about 46.81% of the total value. Due to the comparatively large area with high service value, the value of ES produced by grassland was also relatively high, providing about 23.66% of the total value. Due to the highest coefficient value, the value of ESs produced by wetlands was third among the seven land-use types, accounting for 12.4% of the total value. Due to the large area, the value of ESs produced by unused lands was fourth among the seven land-use types, accounting for 12.1% of the total value. Together, grassland, water body, wetland, and unused land accounted for about 95.01% of the total ESV, implying that these land-use types play significant roles in the total ESV of the Hotan oasis.
Impacts of Land-Use Variation on Ecosystem Functions
To assess the impact of ecosystem functions within the Hotan oasis over a 41-year period, we also calculated the ESV provided by each individual function (Table 4). The contribution rates of these functions to the overall ESV were then ranked based on their calculated values in 1980, 2000, and 2020. The trend in the contribution rate of each ecosystem function to the total value of ESs is depicted in Table 4 using symbols: an upward arrow indicates an increasing contribution, a downward arrow indicates a declining contribution, and a dash represents no change.
Table 4.
ESV of the Hotan oasis in 1980, 2000, and 2020 (106 $).
Table 5.
Values of ES functions in 1980, 2000, and 2020 (106 $).
In summary, the variations in the contribution of each ecosystem function to the total service value were evident, although the rank order remained relatively stable. The overall ranking of ecosystem functions based on their contributions to the total ESV was as follows, from highest to lowest: waste treatment, water supply, biodiversity protection, recreation and culture, climate regulation, soil formation, gas regulation, food production, and raw material.
The analysis of the ESF composition revealed that the water supply and waste treatment functions were the two leading ecosystem functions in terms of their high service value. Together, they contributed 56% to the total service value. On the other hand, the food production and raw material functions had the lowest service value, making a combined contribution of approximately 3.01%. Interestingly, in this study, the value of the regulating service function of the Hotan oasis ecosystem was found to be significantly higher than that of the provision service function. This suggests that the ESF of the Hotan oasis primarily falls under the category of provision. Among the top-ranked ESFs, the contribution rates of gas regulation, soil formation, biodiversity protection, food production, and raw material functions increased between 1980 and 2020. Conversely, the contribution rates of climate regulation, water supply, waste treatment, and recreation and culture functions decreased over the same period. The hindered regulating function of the Hotan oasis led to a decrease in the total ecological service value of the study area.
ES Sensitivity Analysis
The results of the sensitivity analyses are presented in Table 5. It can be observed that the sensitivity index for all seven land types in the Hotan oasis was consistently below one and often close to zero. This suggests that the calculated total ESV in the Hotan oasis exhibited relatively low sensitivity to changes in the value coefficients. When compared to the values from 1980, the sensitivity index for grassland, water body, and wetland decreased, indicating a reduced influence of these land-use categories on the ESV.
Table 6.
Percentage variation of total ESV and coefficient sensitivity.
In conclusion, the impact of the ESV coefficient per unit area of water body, grassland, and wetland on the total ESV in the Hotan oasis decreased during the period from 1980 to 2020 (Table 6). On the other hand, the influence of farmland and woodland increased over the same period.
Discussion
Due to large‐scale land reclamation and unreasonable water resource exploitation after 1980, the hydrological condition and natural environment of the Hotan oasis have changed considerably, resulting in dramatic changes in the ESV of arid regions. Both human activities (continued population increase, rapid economic development, and socioeconomic-related policies) and natural factors (climate and hydrological changes) and their interactions have resulted in land-use changes and the exploitation of water resources.
Factors Driving LULCC
Effects of Regional Climate Change on LULCC
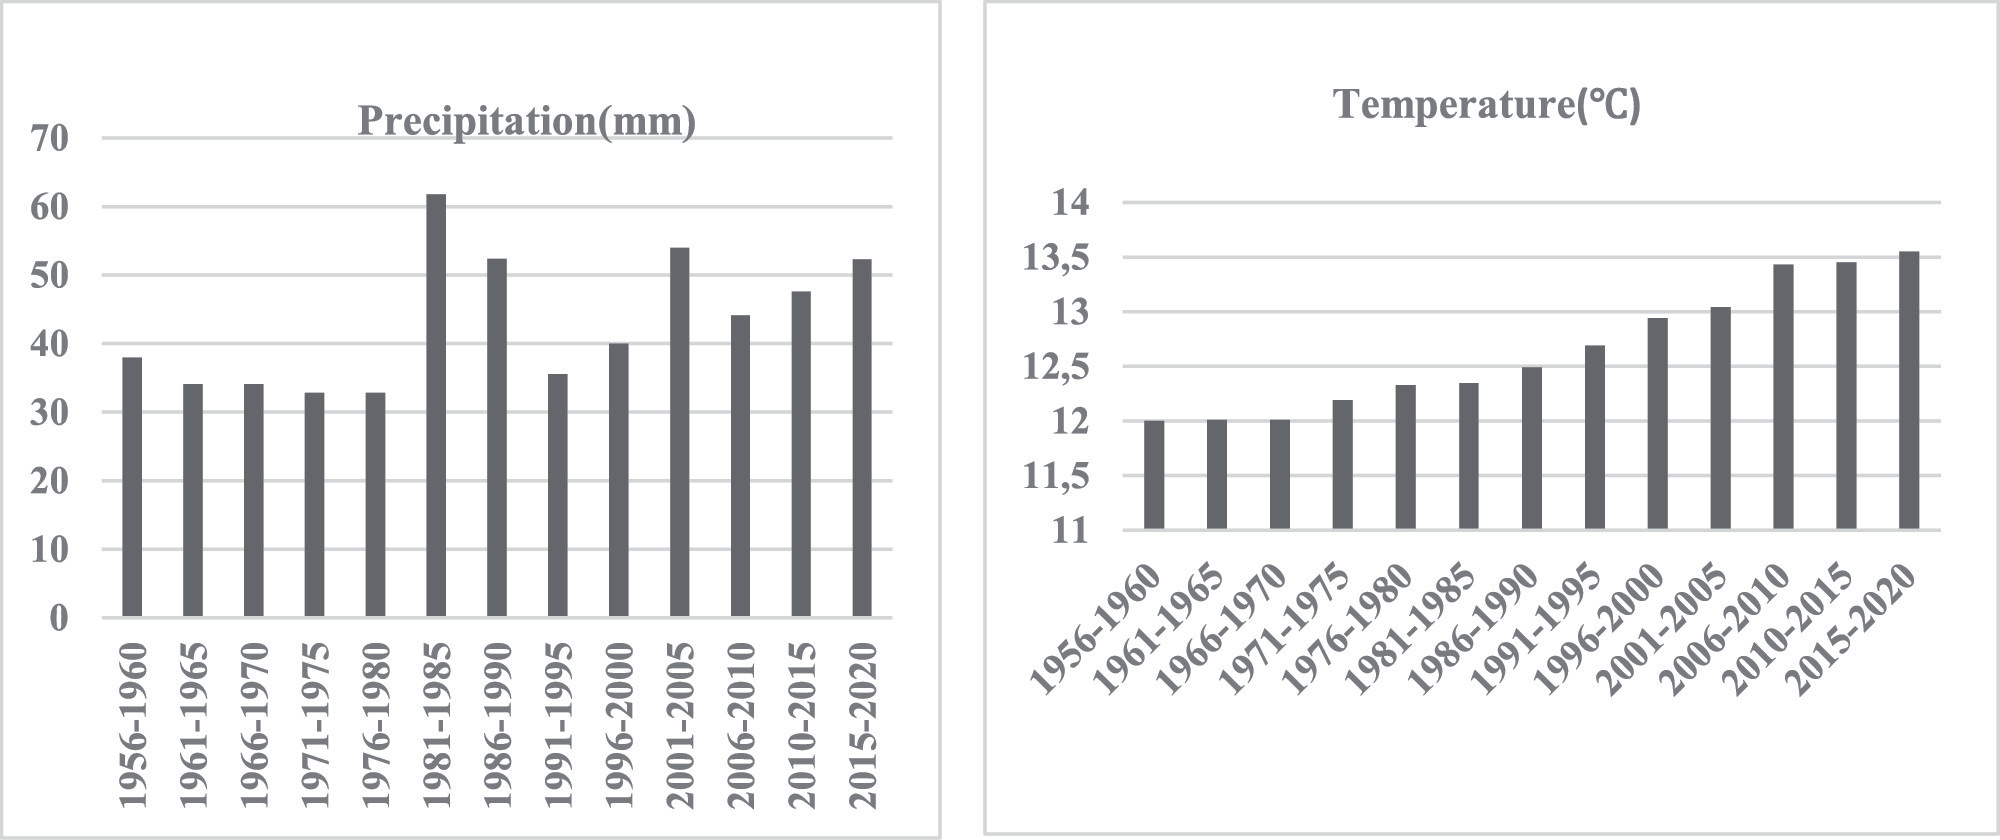
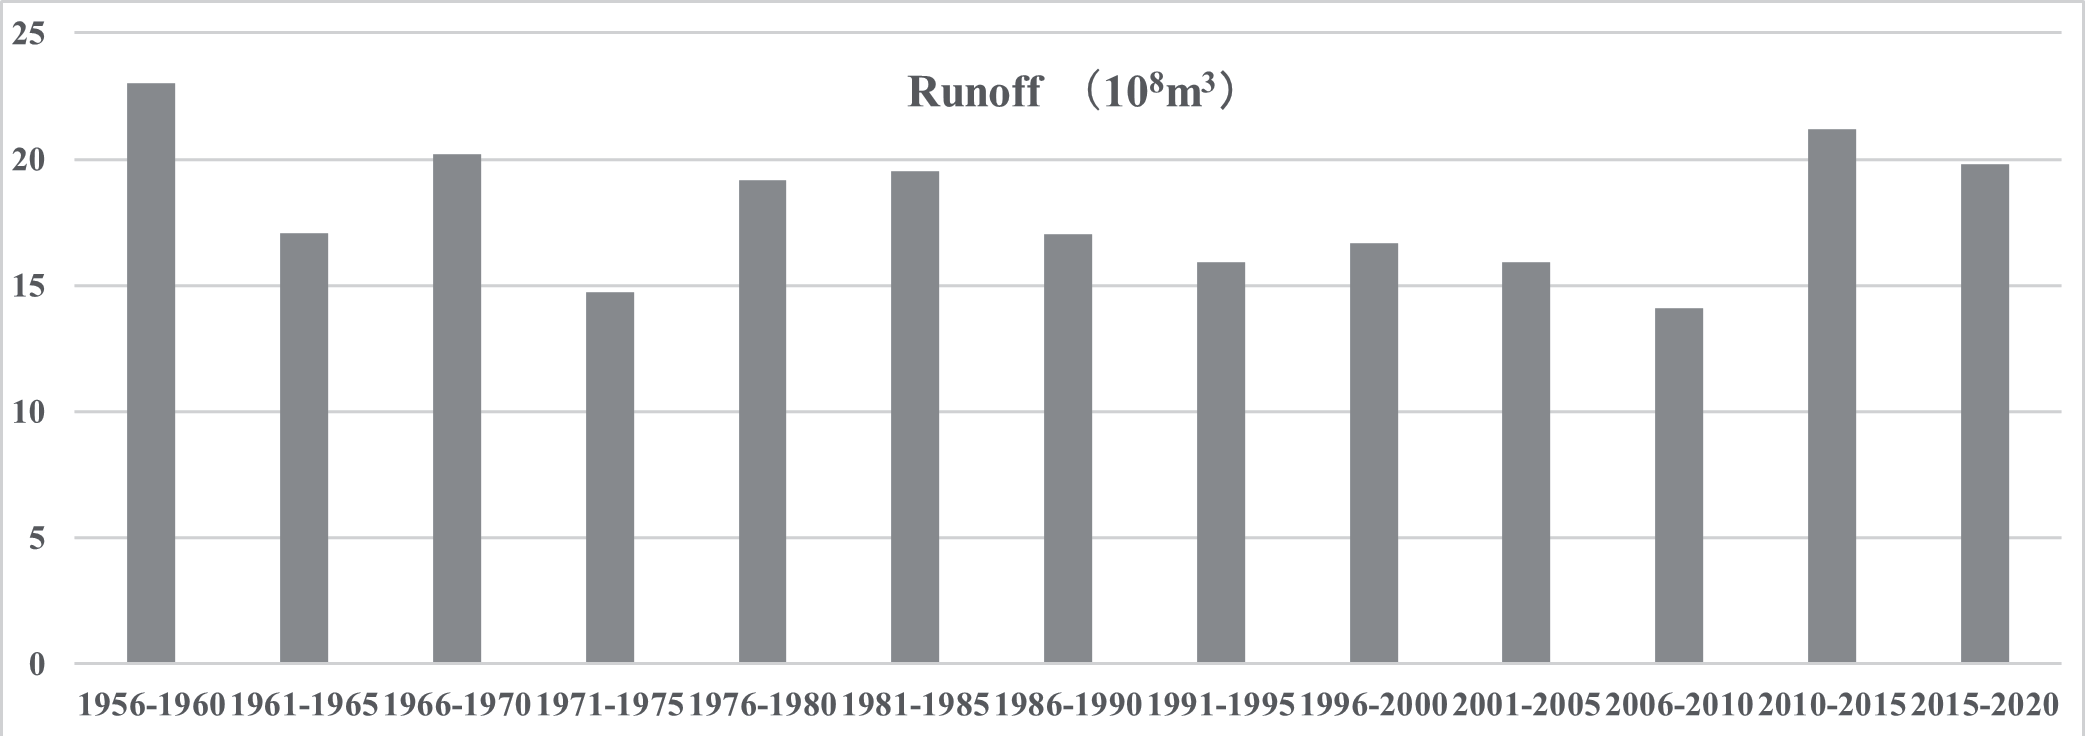
The LULCC in the Hotan oasis in Northwest China is greatly influenced by the total amount and spatial distribution of water resources. Natural factors such as temperature, precipitation, and topography also play a significant role in shaping land use and land cover patterns. In Northwest China, the mountainous areas contribute to precipitation and runoff, while the plains in the central and northern regions act as dissipative zones. With the backdrop of global climate change, the runoff in the Hotan oasis has undergone noticeable changes, and the rate of runoff is a key factor affecting LULCC. Fig. 4 illustrates the temporal changes in climate in the Hotan oasis from 1980 to 2020. The study area has experienced an increase in temperature, particularly since 1985. Over the period from 1980 to 2020, there has also been a slight upward trend in precipitation across the entire study area. The increase in precipitation has had two main effects in the region. Firstly, it has posed significant challenges to both the human system and the natural ecosystem, as increased precipitation can intensify competition for water resources between these two systems. Secondly, the warming trend and increased precipitation have accelerated the melting of snow and glaciers, leading to increased downstream runoff. The abundance of water in the upstream mountainous areas has provided humans with more opportunities to manage and allocate water resources. The influence of temperature on LULCC is primarily observed through fluctuations in melt-water runoff in arid lands.
In Northwest China, the availability of runoff is heavily dependent on glaciers. The melting of glaciers plays a crucial role in the overall water resources in this region. Fig. 5 illustrates that the runoff of the Hotan rivers has increased from 1980 to 2020. The variation in runoff has two significant impacts on LULCC. Firstly, it directly affects the water demand for agricultural irrigation and ecosystem maintenance. As the runoff increases, there is a greater availability of water for agricultural purposes and sustaining the ecosystem. This has implications for the growth and productivity of agricultural activities and the overall health of the natural environment.
Secondly, the variation in runoff also has a direct impact on groundwater recharge. When the river has a substantial amount of water, it helps maintain relatively high groundwater levels. This condition proves beneficial for the growth of desert vegetation. The availability of sufficient water resources supports the growth and survival of vegetation in arid regions. Therefore, changes in runoff have both direct and indirect effects on LULCC, influencing water availability for agriculture, ecosystem maintenance, and groundwater recharge, ultimately contributing to the growth and sustainability of desert vegetation.
Anthropocentric Driving Factors
Compared to natural driving factors that may take longer to manifest their effects, anthropogenic activities have significant and direct impacts on LULCC. Over the 41-year study period, the Hotan oasis has witnessed rapid expansion of human activities, leading to various water resource management engineering projects such as dams, wells, and reservoirs. Among the driving forces behind LULCC, population growth plays a crucial role and can also be a response to environmental changes. The population of the Hotan oasis has increased from 71.3×10⁴ in 1980 to 173.03×10⁴ in 2020. This population growth directly contributes to the intensive expansion of farmland and construction land areas. The increasing population has two main effects on LULCC. Firstly, the growing population requires more land to meet settlement demands and basic needs, including daily food and living space. Secondly, the desire for higher economic development among the population necessitates additional land for agricultural production. As a result, large areas of farmland have been utilized for cultivating economic crops such as cotton, which helps increase the income of local farmers. With the continuous growth of the population, significant changes have been observed in the farmland area. Unused land, wetlands, and natural grasslands have been reclaimed for cultivation, leading to drastic changes in land use patterns. This conversion of land for agricultural purposes has been driven by the increasing population and the economic objectives of the region. Therefore, anthropocentric activities, particularly population growth and the associated demand for settlement and economic development, have had significant impacts on LULCC in the Hotan oasis. These activities have led to the expansion of farmland, conversion of unused land, wetlands, and natural grasslands for cultivation, and other changes in land use patterns.
LULCC Effect on the ESV.
The Hotan oasis has experienced significant population growth and rapid economic development, leading to the expansion of farmland and construction land. This expansion has resulted in deforestation and increased cultivation of grass, altering the landscape structure and causing degradation of ecosystem functions. From 1980 to 2020, there have been continuous changes in the areas of different land-use categories in the Hotan oasis. Farmland and construction land areas have increased, while grassland, water bodies, wetlands, and woodlands have decreased. Table 3 presents the change in ESV for regional land use between 1980 and 2020. The data indicate a decline in ESV for woodland, grassland, water bodies, and wetlands. The overall ESV of the study area has significantly decreased, potentially as a result of increased urbanization and city planning in the Hotan oasis during this period. Considering that the value coefficient of construction land areas is almost zero, the conversion of grassland to farmland and farmland to construction land is believed to be detrimental to the ESV in the Hotan oasis. Based on the research results, the total ESV in the Hotan oasis decreased by 8.07% between 1980 and 2020 due to changes in land-use categories. This decrease was primarily driven by an 8.70% reduction in grassland, a 16.44% reduction in water bodies, an 8.06% reduction in wetlands, and a 39.83% increase in construction land areas. The significant expansion of construction land has had a negative impact on the ecological environment of the study area throughout the entire study period. These findings highlight the importance of considering LULCC in the formulation of policies, particularly in prioritizing the protection of wetlands. In conclusion, LULCC has exerted a significant influence on the ESV in the Hotan oasis. Therefore, in future planning and policy-making, it is crucial to prioritize LULCC policies and the protection of wetlands to mitigate the negative impacts on ESs.
Innovative Aspects and Limitations of the Paper
The innovative aspects of this paper are temporal and spatial scales. Studies can vary in the temporal and spatial scales at which they analyze LULC changes and assess ecological services. They might focus on short-term or long-term changes, small or large study areas, or specific time intervals. In our study, we have chosen Hotan Oasis as the study area, which is characterized by a fragile ecological environment and is susceptible to human activities. The choice of temporal and spatial scales can affect the understanding of the dynamics and relationships between LULC and ecological services in oasis.
The limitations of this paper are: (1) the measurement of ESV in the region relies on the benefits transfer method, which assesses the total amount of ESV but lacks reflection on the provision of ecosystem services that are most urgently needed by the region and most representative of local characteristics. (2) the future research should employ various ecosystem service measurement models to simulate and examine specific services, thereby shedding light on the driving mechanisms behind them.
Conclusions
Based on the land-use classification data in the Hotan oasis from 1980 to 2020, the following conclusions can be drawn regarding the changes in ESV:
(1) The total ESVs of the Hotan oasis were approximately $4587.91 million, $4532.25 million, and $4245.23 million in 1980, 2000, and 2020, respectively. This indicates a net loss in ESV of about $342.68 million from 1980 to 2020. The ESV contributed by water bodies, grasslands, and wetlands accounted for around 88% of the total value. This highlights the significant roles that these land-use types play in providing ESs in the study area.
(2) The water supply and waste treatment functions emerged as the top two ecological functions, providing a high service value and contributing 56% to the total ESV. On the other hand, the food production and raw material functions were found to have the lowest service value. These findings suggest that the ES functions of the Hotan oasis primarily fall under the category of regulating service functions. The overall ranking of each ecosystem function, based on their contribution rate to the total ecosystem value, can be summarized as follows, from highest to lowest: waste treatment, water supply, biodiversity protection, recreation and culture, climate regulation, soil formation, gas regulation, food production, and raw material.
(3) The sensitivity test results indicated that the coefficient sensitivity in the Hotan oasis was significantly below one and close to zero. This suggests that the total ESV in the Hotan oasis displayed a relatively low sensitivity to variations in the value coefficients. Consequently, the estimation of the total ESV in the Hotan oasis can be considered robust, even when there are uncertainties associated with the value coefficients. However, considering the fragile nature of the study area, we recommend exercising caution when engaging in anthropocentric activities in the Hotan oasis.
To protect and develop the Hotan oasis ecosystem, it is advisable to shift from environmentally negative human activities to environmentally positive ones. This transformation would prove beneficial not only for economic progress but also for the sustainable development of the region's ecosystems. Such a trend is crucial for ensuring the long-term well-being of both the environment and the local communities.

