

Introduction
Water resources are closely related to human survival and social and economic development. However, due to the development of socially productive forces and changes in human lifestyles, the problems of water shortage and water pollution are becoming more and more prominent. Water resources are increasingly becoming a limiting factor for social and economic development, making it increasingly urgent for human beings to accurately measure the actual use of water resources. In order to solve these conflicts and problems, the concept of a water footprint (WF) was introduced into water resources management at the beginning of the 21st century.
The concept of a water footprint was proposed by Professor Hoekstra from the University of Twente in the Netherlands by analogy to the concept of an “ecological footprint” [1], which refers to the invisible water consumed by the public while consuming products and services in daily life. The concept of a water footprint extends the water problem to the social and economic field. It is an ideal indicator for measuring the impact of human activities on the water resources system. At the same time, water footprint is an indicator of water consumption related to people’s production and consumption. Combining water footprint with the availability of water resources can reveal water resources dependence or crisis status and provide an essential basis for water security strategy research.
In recent years, water footprint has gradually become one of the research hotspots in the field of water resources management. At present, the research on water footprint mainly focuses on analyzing the water footprint content of a single product [2, 3], analyzing water footprint at the regional or national level [4, 5], defining the scope [6-8], and method [9, 10] of water footprint accounting, and researching the influencing factors of water footprint [11].
In terms of the analysis of the water footprint content of a single product, Hoekstra and Chapagain have published several research results on the analysis of the water footprint content of a single product since 2002. Chapagain and Hoekstra [12] evaluated the “water footprint” of global cotton consumption. Since this is the initial study on the water footprint, it is not mature in terms of theory and method. After further improving the water footprint theory and method, Boulay et al. [13] assess the quantity of water used for livestock systems and recommend specific assessment methods for water productivity and water scarcity. Water productivity assessment is further advanced by quantifying and reporting fractions of green and blue water consumed.
In addition to the water footprint content analysis of individual products, the regional or national water footprint analysis is also the focus of water footprint research. At present, many scholars have calculated and analyzed the water footprint of the Dutch [14], India [15], China [16, 17], Pakistan [18], UK [19], Germany [20], Indonesia [21], and other countries [9, 22, 23].
The analysis of water footprint status at different regional or national levels can clearly show the water resources management and governance status, provide a theoretical basis for regional or national water resources management and decision-making, and further enrich the theoretical basis in the field of water footprint research. In the context of globalization, a large amount of water is traded implicitly between regions, making the responsibility of water far beyond national borders. However, most water policies have failed to address this issue from a national perspective, and there is still a lack of water policy plans beyond regional boundaries [24]. The lack of data and analysis that can determine the responsibilities of countries in water trade and consumption is one of the main factors that make it difficult to develop effective water policies and subsequent agreements between countries. Therefore, the global water footprint analysis has also received extensive attention from scholars [25].
In the water footprint accounting scope research, water footprint can be divided into blue water footprint, green water footprint, and gray water footprint according to the type of water consumption. Blue water footprint measurement is used to assess the consumptive use of land and surface water flow [26]. 57% of the global blue Water Footprint (WF) is unsustainable, and nearly 70% of the global blue WF is unsustainable in part due to the production of five crops: wheat (27%), rice (17%), cotton (10%), sugarcane (8%), and feed (7%). These crops have a large unsustainable blue WF component [26]. Green water footprint refers to the total amount of water resources stored in soil rainwater by evaporation from farmland [27]. Environmental sustainability evaluation shows that the green footprint is not sustainable [28]. Gray water footprint represents the indirect consumption of water resources by human sewage activities, and gray water footprint represents the amount of water required to dilute pollutants [29]. Water footprint integrates water of various “colors” (blue water, green water, gray water) together, making up for the shortcomings of traditional water resources accounting that only pays attention to blue water and contributes to a more comprehensive review of the sustainability of water resources. Therefore, many authors worldwide have studied different types of water footprints, such as Hekmatnia et al., who conducted a spatially significant quantitative study of green, blue, and gray water footprints for all crops in Iran during 2016- 2018 [30]. Adeoti estimated dry onion production’s blue, green, and gray water footprints, providing important information for stakeholders such as policymakers and planners [31].
There are two main accounting methods for water footprints: the “top-down” method and the “bottom-up” method. The “top-down” method, through the country, region, group, individual, and regional overall input-output situation, is used to analyze the consumption of water resources. “Top-down” is widely used in regional water footprint research, mainly including the single regional input-output model (SRIO), multi-regional input-output model (MRIO), and the interregional input-output model (IRIO). For example, Zhao et al. conducted a quantitative analysis of the scale and structure of interregional water stress footprint in China based on the MRIO model [32]. The “bottom-up” method calculates the water consumption of each process of product production to obtain the water consumption in the life cycle of the product and then measures the overall water footprint of a region, multiple regions, and a country. Based on the bottom-up methods of the standard water footprint analysis method [33], evaluated the water footprint of energy production and supply in a specific region, calculated the water footprint at different periods, and proposed ways to promote reliable energy supply by limiting the use of water resources in energy production in a specific region. Agnusdei and Coluccia [2] assessed the water footprint of fruit and vegetable loss in the Italian agricultural supply chain from the perspective of the life cycle and found a high proportion of water loss in grapes and the sustainability of tomatoes in water loss.
In terms of research on water footprint influencing factors, the authors of different countries have conducted in-depth studies on the water footprint, and the research shows various factors influence the water footprint; the effect of economic activities has the largest positive contribution to the growth of the water footprint, followed by the population effect and diet structure effect. The change in precipitation and temperature due to climate change will also cause an increase in the water footprint [34]. In addition to the above factors, the choice of crops and irrigation methods can also affect the water footprint. Hai and Long [35] directly compared the water footprints of different crops from an economic perspective, and the results show that the feasibility and effectiveness of agricultural water use can be controlled by increasing technology input and crop crops in the face of future climate change. Zhuo and Hoekstra [36], taking winter wheat in northern China as an example, found that deficient irrigation has effectively improved the utilization of blue water and reduced the footprint of blue water.
Currently, a large number of articles on WF have been published, but only a few researchers have reviewed or retrospectively studied it [37]. Indeed, very few scholars discuss this issue from a visual perspective. This paper aims to clearly reveal the new trends and recent developments in the field of WT research. The knowledge base, research hotspots, frontiers, and structural relationships in these research areas were visualized using the CiteSpace and VOSviewer visualization tools.
Materials and Methods
The drawing of the scientific knowledge map in this paper relies on the database and analysis software, and the data samples are selected from the WEB OF SCIENCE database. CiteSpace, developed by Chen Chaomei, and VOSviewer, developed by Nees Jan van Eck, were used as analysis tools to draw a knowledge map in the field of water footprint research. The map drawn by the analysis tool clearly and intuitively shows the basic fields covered by the literature, avoids the influence of subjective factors, and overcomes the shortcomings of traditional literature review to a certain extent.
Materials
The definition of water footprint is relatively clear: it refers to the total amount of freshwater resources required to produce goods and services consumed by the population in a certain country or region. Therefore, the search item is determined as “water footprint”, and the data sample is selected from the WoS database. In the core collection of WoS, with “subject” = “water footprint” and “document type” = “article”, a total of 1156 search results were obtained, and the search results were deduplicated. After deleting irrelevant entries, 1140 related works distributed from 2006-2023 were finally sorted out.
Research Methods
Under the joint promotion of scientometrics, big data, and data visualization technology, scientific knowledge graphs (Mapping Knowledge Domains, abbreviated as MKD) have become an emerging and active research direction in recent years [38]. Literature visualization is considered a useful mathematical and statistical method to describe the productivity of science, technology, and the developmental trend of research [39]. It can usually evaluate and predict the relative research with graphic variation in outputs and findings. At present, the mainstream knowledge graph software tools include CiteSpace, Thomson Data Analyzer, VOSviewer, BibExcel, Gephi, Ucinet, and Pajek, among others. The above analysis tools have their own advantages and disadvantages. Compared with other software, CiteSpace has better functions and compatibility for foreign language document analysis, good adaptability to the literature citation data of WoS, and can provide more analysis parameters and a more complete diagram, including network mediation center degree, with a timing analysis function. It has certain advantages in revealing the dynamic development law of the discipline and discovering the research frontier of the discipline, while VOSviewer can avoid the mutual coverage of important nodes and labels and pay attention to the main information display of the data set. It has a comparative advantage when the relationship is clearly presented or when the amount of data is very large.
Results and Discussion
Research Focus
Time Distribution of Literature
The growth law of scientific knowledge is closely related to the growth law of literature, so the change in literature quantity is an important indicator to measure the amount of scientific knowledge in a certain field. Through searching, we found that the WoS database from 2006-2023 included 1140 articles related to water footprint. A preliminary understanding of water footprint research can be formed based on the total annual number of publications of relevant research literature from 2006-2023. Fig. 1 shows that the evolution of literature quantity can be divided into three stages: 2006-2013 (embryonic stage), 2013-2021 (rapid rising period), and 2022-present. From 2006-2013, the number of water footprint documents showed an overall upward trend, but it hovered at a low level in the early stage and showed a slow growth trend in the late stage. This stage’s total number of documents accounted for 12.78% of the total papers. Since the concept of a water footprint was put forward, researchers have also closely watched relevant water footprint meetings. In 2011, Professor Hoekstra released the Water Footprint Assessment Manual (WFAM) for the first time worldwide, providing governments, enterprises, and other relevant researchers with measurement methods and evaluation of water footprints. Although research on water footprints has been paid attention to by the academic community since then, the content of water footprints at this stage has not been widely recognized, so the number of literature studies has grown slowly. In the second stage, from 2013-2021, the literature rose sharply, and it continued to break through the peak and was in the stage of accelerated growth. In 2015, the United Nations Climate Conference was held in Paris. As an important part of the earth’s circle, the hydrosphere has a very special effect on climate change, so studying water footprints is very important. It can be seen that the study on water footprint has received attention from the international academic community and has set off a climax of water footprint research. After experiencing rapid growth in the previous stage, research papers on water footprints have entered a downward trend starting in 2022. This phenomenon conforms to the growth curve of most research fields. This indicates that water footprint research has entered a relatively stable period, and important issues in this field have been addressed.
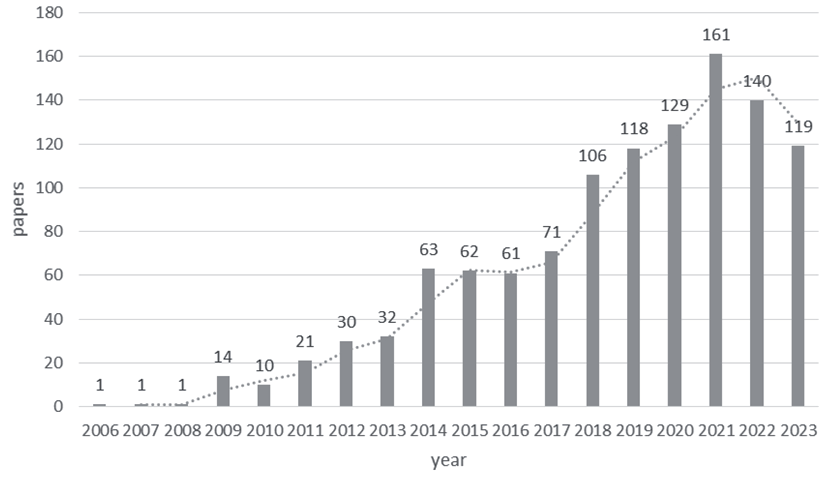
According to Everett Rogers’ S-curve theory on the development of new things, the development of new things is initially slow, then enters a relatively stable critical value, and then accelerates diffusion. It can be found that the number of documents in Fig. 1 barely increased between 2016-2017 after a sharp increase in 2015. However, since 2018, literature has entered a phase of rapid growth. The research on water footprints has entered a new period. During this period, the research on water footprint is in a period of rapid growth, and the research theory and research method of water footprint are gradually maturing.
Country Analysis of Literature
The international cooperation of research results shows the degree of internationalization of the country’s research in this field. It is also an important aspect of the research field’s international influence. Different countries have published articles on water footprints, and the research on water footprints and the published literature reflect the importance and academic influence of the country in this field. The 20 countries with the largest number of publications and the corresponding number of publications are shown in Table 1. It shows that the country with the largest number of publications is the People’s Republic of China, followed by the United States of America, the Netherlands, Italy, Spain, Iran, Germany, England, Australia, and South Africa. The United States of America, the People’s Republic of China, and the Netherlands are the three most influential countries in this area of research.
In terms of international cooperation, China, the United States, Iran, Australia, New Zealand, and Italy are at the core of the whole research network because the number of collaborative publications between these countries is higher than in other countries. In this respect, they will benefit from the knowledge transfer between the fields of water footprint research. In addition, cooperation among countries presents certain regional characteristics. For example, France, Italy, Greece, and other European countries cooperate closely; the United States cooperates more with Canada and other countries.
Table 1.
Top 20 countries with the highest number of publications.
Institutional Analysis of Literature
Analyzing the distribution of research institutions in the literature can show the academic level of the institutions in the research field as well as the information exchange and cooperation among the institutions. Some key institutions are shown in Table 2, and it can be seen that the Chinese Academy of Sciences and the University of Twente perform very well, with 38 and 30 published papers, respectively, far more than other institutes. From this perspective, they are the two strongest organizations in the field of water footprint research. Furthermore, most prolific research institutions are based in China, such as the Chinese Academy of Sciences, Hohai University, Beijing Normal University, Northwest A&F University, and Beijing Forestry University. This indicates that the research achievements of Chinese research institutions in this field have reached a certain scale.
Meanwhile, statistical data, which is downloaded from the WoS database, displays that some research institutions, such as the Chinese Academy of Sciences, Beijing Normal University, Northwest A&F University, Beijing Forestry University, University of Twente, and Hohai University, are located at key connection nodes. They are the core institutions in terms of cooperative networks. This indicates that these institutions have played an important role in facilitating knowledge transfer in water footprint research on a global scale through frequent collaboration with other institutions. Concurrently, there will be more frequent cooperation between institutions that are composed of geographical proximity and cultural origins, such as the Chinese Academy of Sciences, Beijing Normal University, Hohai University, and Beijing Forestry University. These research institutes all come from China. This reveals that geography and political factors somehow restrict cooperation among institutions.
Table 2.
Top 20 organizations with the highest number of publications.
Emerging Trends and New Developments
Hot Spot Analysis
Keywords are the author’s highly concise research theme and the core content of the paper. The occurrence frequency of keywords can reflect hot spots in the selected research field. The top 20 keywords with the highest frequency are shown in Table 3. The water footprint is clearly the most frequently occurring keyword in this research field, followed by “life cycle assessment” and “sustainability”. Life Cycle Assessment (LCA) is the core evaluation method for water footprint, so it is a key content in this research field.
Life cycle assessment is a methodology that aims at quantifying potential environmental impacts generated by human activity on a wide range of environmental issues. The purpose of the water footprint lifecycle assessment is to analyze the correlation between human activities or specific products and water scarcity and pollution issues and consider how to make these activities and products more sustainable from a water perspective. Existing literature has conducted a large number of practical case studies using water footprint LCA, such as sugar beet production in Valladolid, Spain. It is worth noting that water footprint assessment is only a tool for understanding the complex relationship between society and the natural environment, focusing on using freshwater resources under limited supply, and cannot solve water-related problems unrelated to water scarcity.
Research on water footprint is often associated with sustainable development. Water footprint is an important measure of a company's sustainable development and social responsibility performance. Immediately following these two keywords are “water scarcity” and “climate change”, which show that climate change and the water shortage caused by climate issues have also attracted more attention from all walks of life. The rise in global temperature is an important environmental threat that human society will face in the future. In order to reduce global greenhouse gas emissions, mainstream countries have formulated corresponding carbon reduction plans. This trend will further increase scholars’ attention to the related field of water footprint.
Other keywords, such as “blue water”, “virtual water”, “gray water footprint”, and “green water”, are also important focuses in the field of water footprint research. In fact, the “water footprint” framework is developed based on “virtual water”, and according to resource types, the water footprint can be subdivided into three types: blue water footprint, green water footprint, and gray water footprint. Therefore, the above content has naturally become an important research topic in this field. Furthermore, by observing the top 20 keywords, it can be observed that China has received a high level of attention. The possible reason is that, in recent years, China has significantly increased its emphasis on environmental protection and governance, and water footprint analysis is an important means of water ecological environment protection. This can be further verified by the number of publications from institutions in the field of water footprint research.
Moreover, it can be seen that “virtual water” and “water footprint” involve not only a form of natural resources research but also a form of social and economic research. It expands the research on water resource problems from the field of natural resources to the field of social economy, broadens the solutions to water resource problems, and makes the application of the concept of sustainable development in water resource problems more diversified.
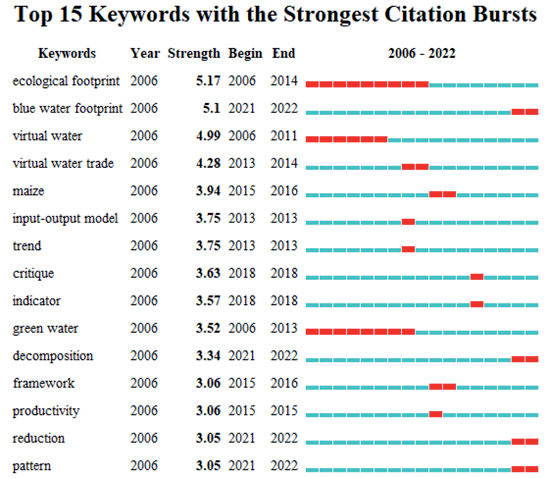
Burst detection refers to the phenomenon in which the keyword to be investigated transitions quickly, emphasizing mutation. We can understand the dynamic changes of research hotspots by analyzing keyword mutation. Fig. 2 shows that the top 15 keywords with the strongest burst intensity were in the field of water footprint research during 2006-2022. From the mutational keywords in the water footprint research literature (Fig. 2), the emergent intensity of “ecological footprint” is 5.17, higher than that of other keywords in the same period. By studying the literature of corresponding important nodes, it is found that the literature with “ecological footprint” as the keyword is mainly reflected in the empirical research of different influencing factors, the research on sustainable development based on the Ecological Footprint Model, and other related aspects. The emergent intensities of “blue water footprint” and “virtual water” are 5.1 and 4.99, respectively. It is analyzed that the main reason for the increase of the intensities of “blue water footprint” and “virtual water” in this period is that the concept of water footprint is put forward based on virtual water, and the research of virtual water accompanies the research of water footprints. In addition, the latest research hotspots in this field include maize, input-output model, trend, critique, indicator, green water, decomposition, framework, productivity, reduction, and pattern. Considering the growing awareness of environmental protection, it seems that some topics about the ecological environment and water resources, especially the concept of sustainable development, will receive more attention and produce more papers in these fields.
Table 3.
Top 20 keywords with the highest frequency of occurrence.
Trend Analysis
In 2011, the Water Footprint Network (WFN), led by Professor Hoekstra, released the water footprint assessment manual for the first time globally, laying a foundation for governments and enterprises to carry out water footprint accounting and evaluation. Water footprint has gradually become one of the research hotspots in the field of water resources management. On the one hand, the scope of water footprint research continues to expand, which is reflected in the expansion of the types and scope of water footprint research, which basically covers all kinds of ecological resources and national plans. In addition, the scope of the water footprint research field continues to expand and is no longer limited to qualitative research such as theoretical introduction and importance analysis. Quantitative research on the synergistic effect of water footprint has gradually become mainstream, and researchers have gradually combined the simple fields of natural resources and social economy to study the problem of water resources, which makes the application of the concept of sustainable development in the problem of water resources more diversified.
Future research hotspots and trends of water footprint may include: By analyzing the top 15 research hotspots in the literature and the ranking changes of various keywords, this paper determines two research hotspots in the future: (1) In terms of research topics, research keywords are mainly related to sustainable development. For example, water scarcity, water quality, water pollution, fresh water, sustainable agriculture, and water conservation are research hotspots. According to the 2018 World Water Resources Development Report, the global demand for water resources is growing at an annual rate of 1%, which will accelerate significantly in the next 20 years. At the same time, human beings mainly rely on freshwater resources. The freshwater resources on earth account for about 2% of its total water, and the total amount of freshwater that human beings can use accounts for only 3/100000 of this, accounting for 0.34% of the total freshwater storage. However, in real life, people lack the concept of saving water and protecting water resources. With the continuous development of industrialization, water pollution is becoming more and more serious, and water quality is deteriorating gradually. (2) In terms of collaborative research, the current shortages of water resources, food security, and energy have become the three major problems perplexing the stable economic and social development of all countries in the world. Therefore, the coupling of “water, food, and energy” is a possible research hotspot in the field of water footprints in the future. The research on the coupling relationship between the three plays an important role in promoting the comprehensive management of water and energy, alleviating the current situation of resource scarcity, and realizing sustainable development. Researchers in water footprint will follow this trend and give full play to the unique advantages of the water footprint in solving water resources problems.
Conclusions
Through the visual analysis of the ecological compensation research literature, four conclusions are drawn: (1) From the time distribution series, it is summarized that since the 21st century, the study of water footprint has experienced three stages: embryonic stage, stable rising stage, and rapid rising stage.
(2) Countries with important influence in this field include the People’s Republic of China, the United States, Iran, the Netherlands, and Italy, and the People’s Republic of China is the country with the most published literature. National cooperation shows regional characteristics. (3) This paper summarizes the main research institutions of water footprint and their temporal and spatial distribution and cooperation characteristics: First, from the perspective of output quantity, scientific research institutions such as Twente, the Netherlands, the Chinese Academy of Social Sciences, Hohai University, and Beijing Normal University have a large number of papers and strong strength; second, from the perspective of spatial distribution, the institutions carrying out water footprint research are mainly distributed in Europe, North America, and North and Central China; third, from the perspective of institution types, the institutions carrying out water footprint research are mainly water conservancy, normal university, and resource research institutions; fourth, from the perspective of cooperation networks, the Chinese Academy of Sciences, Beijing Normal University, Twente University, and Hohai University play a leading role in the cooperation network in the field of International Water Footprint Research and are the key nodes of the whole cooperation network.
(4) The hot spots and research frontiers of global water footprint research are detected and analyzed. Results display that water footprint, virtual water, water use efficiency, and climate change are the current research focuses and hotspots of water footprints. The coupling of water scarcity, water quality, water pollution, freshwater, sustainable agriculture, water conservation, and water food energy will become the frontier hotspots of water footprint research.
The increasing tension over water resources has posed new challenges to water footprint research. There is still room for improvement in future research on water footprints in the following aspects: (1) Since the concept of water footprint was formally introduced, significant progress has been made in global water footprint research. However, most studies focus on empirical research and basic applications. Water footprint is not yet considered a complete discipline, lacking a unified theoretical framework. The main research areas and directions remain fluid. Additional indicators are needed to fully understand the water footprint.
(2) The water footprint concept broadens the scope of regional water resources evaluation. However, the systems used for these evaluations vary significantly. The lack of a unified and comprehensive system results in inconsistent evaluation outcomes across different regions. Therefore, water footprint assessment should be used alongside other analytical tools to fully understand and address various related issues in decision-making.
(3) The water footprint concept emerged in 2022. Initially, assessments focused on regional levels, with corporate and government adoption coming later. There are still too few relevant case studies.
Future water footprint research should focus on four key areas: (1) Enhance basic theoretical research by integrating theory with local practices to effectively enrich and apply water footprint concepts. In the future, the standards for water footprint evaluation need to be further refined, especially in terms of improving guidance for evaluating actual cases. Simultaneously, practical examples are crucial for enhancing water footprint evaluation, particularly in analyzing and assessing the water footprint of enterprise products.
(2) Water footprint assessments should extend beyond freshwater resource analysis to integrate insights from environmental, economic, and social disciplines. This includes examining the impact of freshwater use on biodiversity, health, welfare, and equitable distribution.
(3) Expand research into water footprint accounting for marginal industries to broaden the field and produce more diverse results. Current water footprint research encompasses global, national, regional, watershed, product, and corporate footprints. Most studies emphasize water footprint accounting, with few addressing all stages of water footprint evaluation.
(4) Enhance the integration of water, ecological, carbon, and other footprint assessment methods. Each “footprint” evaluation method offers unique insights, and future research should focus on unifying these concepts into a cohesive framework for comprehensive analysis.

