

Introduction
The report of the 20th Party Congress states that technological innovation should be utilized in all aspects of modernization to activate innovation as an economic engine fully. Technological innovation drives a country or region’s sustained and healthy economic development, and natural resources and the environment are essential symbols of its sustainable development [1]. The Fifth Plenary Session of the 18th Central Committee paid great attention to environmental issues. It introduced the concept of green development, and the 75th United Nations General Assembly of China put forward the goal of carbon peak and carbon neutrality. To realize the transformation from high-speed development to high-quality, sustainable development, green transformation and upgrading is the way to go. The high-tech industry is a strategic industry for China’s economic development and is leading China’s high-quality development and industrial transformation; as with traditional technological innovation, technological innovation in the high-tech sector leads to economic growth but also has the potential to bring about problems such as environmental pollution, energy consumption and so on [2]. Therefore, the development of green innovation in high-tech industries should not only consider the problem of innovation ability but also consider how to improve environmental quality and reduce energy consumption while improving efficiency.
In recent years, high-tech industries have been increasing R&D investment, establishing various types of high-tech industrial parks, and expanding the scale of enterprises. At the same time, provinces have encouraged enterprises to transform into green and ecological enterprises to improve green innovation. Among them, the R&D expenditure in the R&D investment stage of high-tech industries has risen from 144.9 billion yuan in 2011 to 464.86 billion yuan in 2020 (see Table 2). However, the economic benefits in the transformation stage of the results have yet to be substantially improved. This indicates that the continuous expansion of enterprise scale does not dramatically improve its innovation efficiency. Instead, it leads to inefficient resource utilization, structural redundancy, and severe environmental pollution, failing to improve the efficiency of green innovation significantly [3]. Instead, it makes resource utilization inefficient, structure redundant, and environmental pollution severe, resulting in green innovation efficiency not significantly improved [4]. In addition, enterprises often need help with obstacles such as high cost and high risk due to government regulations when they carry out green innovation activities, which also indirectly leads to the weak innovation capacity of China’s high-tech industry. Therefore, improving efficiency by increasing R&D investment without considering the efficiency of transforming green scientific and technological achievements will inevitably lead to wasting resources [5]. The following are some of the reasons for this. Then, it is worthwhile to explore which parts of the enterprise in the process of carrying out innovation activities could be more problematic, leading to inefficiency, and the reason.
Currently, research on technological innovation is relatively extensive, with many findings exploring influencing factors and measuring and evaluating efficiency. However, there is a complete theoretical framework on innovation efficiency, especially green technology innovation efficiency, which needs to be further improved, and there needs to be more literature on government regulation as an input indicator. Therefore, designing more accurate and suitable evaluation indexes for green technology innovation to assess and measure the innovation level of green technology, analyzing its differences in the development process, digging into the specific reasons for the differences, and supplementing and deepening the evaluation theory of the efficiency of green technology innovation has essential theoretical value for the innovative development of high-tech industries, and also provide transformational ideas for the green development of enterprises.
Literature Review
The concept of green technological innovation originated in Western countries and was first proposed by Braun E and Wield D [6], they believed that if the innovation process can reduce environmental pollution or energy consumption, whether it is technology, product, or process, it can be called green technology innovation. With the continuous consumption of resources by economic development, some Western countries have begun to take the initiative to adjust their technology to the direction of green technology; for example, Ghisetti C., Rennings K. [7] that the reduction of carbon dioxide in the output or the removal of energy consumption in the innovation process belongs to the energy resource efficient innovation, and if the enterprise can reduce the water pollution, air pollution, land pollution and so on in the innovation process belongs to the externality weakening type of innovation. China’s research on green technological innovation is developed based on foreign research; He Xiaogang [8] believes that green technological innovation requires enterprises to efficiently utilize limited resources to create revenue, protect the environment, and realize the double leap of resources and the environment. Zhang Feng, Ren Shijia, and Yin Xiucheng [9] believe that green transformation enterprises should focus on the research and development of green technology and develop green products through green technology, so the focus of green technology innovation should be placed on the research and development of green technology to reduce environmental pollution while realizing the improvement of economic benefits. Based on existing literature, this paper argues that green technology innovation should generate knowledge-based innovations and create as many financial benefits as possible but also uses innovative technology to reduce pollution emissions and realize energy saving and environmental protection. As resources and the environment are constantly emphasized, people pay more attention to the impact of pollution of resources and background on innovation efficiency and gradually shift from pure research on technological innovation efficiency to green technical innovation efficiency. Most scholars focus on green technology innovation efficiency from the perspective of inputs and outputs; Luo Liangwen and Liang Shengrong [10] use the total inputs used in production compared with the total outputs finally obtained to express the green technology innovation efficiency. That is the efficiency of the maximum desired output and the minimum non-desired output obtained by considering the inputs of resource elements such as personnel and capital, examining whether the existing resources are fully utilized and whether the allocation of various factors is used rationally, etc.
Green Technology Innovation Efficiency There are two main methods to measure efficiency: stochastic frontier (SFA) and data envelopment analysis (DEA). Wang Yan, Gong Xinshu, and Li Jinjin [11] use the SFA model to measure the technological innovation efficiency of Xinjiang equipment manufacturing industry; because SFA needs to set up an estimation model, there are constraints in using this method to measure the efficiency, so subsequent researchers have more often used DEA method to measure the efficiency. He Wei [12] evaluated the input and output efficiency of agricultural science and technology parks using the traditional DEA method; Lu Y.H., Shen C.C., Ting C.T. [13] evaluated the R&D efficiency of 194 high-tech enterprises in Taiwan using the traditional DEA method. The conventional DEA only considered the initial and final outputs and did not consider the impact of the links existing in the middle on the efficiency and the problem of slackness between inputs and outputs. To solve this problem, many researchers have proposed network DEA and SBM models [14, 15]. The former divides inputs and outputs into several stages, and relevant intermediate indicators connect each step. At the same time, the latter can consider the slackness neglected by traditional DEA. Luo Wenliang and Liang Shengrong [10] constructed an indicator system using a two-stage DEA model to evaluate the efficiency of green technology innovation of Chinese regional enterprises. Zhu Honghui, Yang Shuqi [16] Using a two-stage DEA model, the innovation capacity of patent-intensive and non-patent-intensive manufacturing industries at each stage was analyzed comparatively. However, the SBM cannot further compare the decision-making units whose efficiency is already 1. Tone [17] continues the research on this model and proposes a super-efficient SBM model that can more accurately compare the efficiency values. Li Hui, Li Wei, and Yao Xilong [18] Measured the total factor carbon emission efficiency of Chinese provinces with a super-efficient SBM model. Xu Yingqi, Cheng Yu, and Wang Jingjing [19] then used the super-efficiency SBM model to measure the carbon emission efficiency of 68 cities in China that have implemented low-carbon pilots. For the defect that the super-efficient SBM model can only estimate the static efficiency at each stage, but cannot measure the dynamic trend, Yan Huafei, Xiao Jing, and Feng Bing [20] think that the Malmquist model can compensate for it. Lai Yifei, Xie Panjia, Ye Liting et al. [21] measured the dynamic efficiency of science and technology innovation in provinces and cities by using the SBM-Malmquist model. Chen Wei, Zhang Changxiao, and Li Chuanyun [22] measured China’s high-tech service industry’s innovation efficiency by combining the DEA and the Malmquist-Luenberge index. Zhang Likun, Zhang Yaping, Liang Yuan [23] Analyzing Chinese industrial enterprises’ green technology innovation efficiency with the Malmquist-Luenberge model.
In evaluating indicators, scholars choose different hands, but basically, they are selected after considering inputs and outputs. Zhao Qiaozhi, Liu Jonas Xuan, Cui, and Rui [24] chose funding and personnel as inputs in the knowledge stage and used the Internet penetration rate as a particular factor input and the sales revenue of new products as the final output. Jaffe A.B., Palmer K.L. [25] chose R&D personnel expenses as the measurement index. At the same time, Sun Yanming and Chen Simiao [26], based on the previous research and considering the resource demand situation, used the total amount of industrial water consumption, the total amount of industrial electricity consumption, and so on to indicate the inputs of resources. With the increasing ease of obtaining patent data, scholars began to use the number of patents to measure innovation performance, Scholars such as Ley M., Stucki T., Woerter M. [27], and Popp D. [28] used the number of patent applications to identify the innovation quality of innovation subjects. Li Dandan [29] believes patents can effectively respond to the transformation of innovation results, so the number of patent applications is an output indicator. Xu Yingqi, Cheng Yu, and Wang Jingjing [18], on the other hand, believe that in the construction of indicators, pollution to the environment should be considered, and when analyzing the carbon emission efficiency of low-carbon test cities, capital, labor, workforce, etc., are used as inputs. GDP is used as expected outputs, and CO2 is used as unintended outputs. In terms of research objects, most of the existing literature focuses on industrial enterprises, heavy polluting enterprises, and pollution-intensive industries, such as Zhang Liao and Huang Leiqiong [30], eliminating other external influencing factors to measure the actual green technology innovation efficiency of industrial enterprises, Sun Yanan, Fei Jinhua [31] On the other hand, it is believed that heavy polluting enterprises should pay more attention to green technology innovation, so the creation efficiency of serious polluting enterprises is measured.
Through combing the relevant literature at home and abroad found that the existing research has the following shortcomings: 1) most of the research methodology uses traditional DEA, the efficiency of more than 1 decision-making unit cannot be further compared, and only focus on static efficiency, ignoring the analysis of dynamic efficiency; 2) the research content ignored the problems brought about by environmental pollution and resource depletion, and also ignored the impact of ecological regulatory policies on the efficiency of green technological innovation; 3) In the selection of indicators, scholars have not reached a broad consensus on the choice of needles, and fewer scholars have selected indicators closely related to green technology innovation efficiency; 4) The relevant research objects are concentrated in the enterprise level, and there is a lack of research on other industries, such as high-tech industries. Therefore, based on previous studies, this paper adopts the super-efficiency SBM method, combined with the Malmquist-Luenberge index, to analyze the inter-period dynamic analysis of green technological innovation efficiency, which can more accurately dig into the reasons for the differences; In addition, according to the theory of Porter’s hypothesis, in the process of long-term development, the reasonable environmental regulation policy will make enterprises pay more attention to R&D and actively transform into green production enterprises. In addition, according to the theory of Porter’s hypothesis, in the long-term development process, reasonable environmental regulation policies will make enterprises pay more attention to R&D, actively transform into green production enterprises, and improve their level of green innovation [32]. Considering that different types of environmental regulation have other effects on the efficiency of green technological innovation, this paper introduces command-and-control, market incentive, and public participation environmental regulatory policies as input indicators; previous scholars have used ordinary patents to indicate the output of innovation results but to reflect “green,” this paper, based on the previous research, uses the WIPO Green List to analyze the production of green technology innovation and uses the WIPO Green Inventory as an input indicator. To better reflect the “green,” this paper, based on the previous research, uses the WIPO Green List to screen out the green patents, including green invention patents and green utility model patents, as the innovation output. And the entropy value method is used to calculate the comprehensive environmental index of wastewater, exhaust gas, and general waste solids as the non-desired output-related index, which further enriches and improves the green technology innovation index. The high-tech industry is an essential strategic industry in the national economy, so it is crucial to take the high-tech industry as the research object, use the super-efficiency SBM model and Malmquist model, including non-expected output, measure the static efficiency and dynamic efficiency of green technological innovation under the two-phase perspective, analyze the reasons for the differences in each state, and put forward targeted countermeasures, which has a paramount practical significance for the realization of the sustainable development of the economy. This is of great practical relevance for realizing sustainable economic growth.
Measurement Model and Indicator Selection
Measurement Models
Super-Efficient SBM Modeling
The DEA model is a typical representative of the nonparametric method, which is an evaluation method that calculates the relative efficiency by taking the optimal functional equation as a criterion. However, the traditional DEA does not consider the effect of the difference between the respective changes of inputs and outputs in the research object on the efficiency value or whether it is input-oriented or output-oriented. Therefore, Tone [17] has studied the traditional DEA model. Finally, based on the DEA model, it proposes a method model that does not need to consider the differences in the changes of inputs and outputs and does not need to predetermine the dominant direction in advance, i.e., the SBM model. The SBM model breaks the problems of the differences in the changes of inputs and outputs and the selection of the dominant direction of the traditional DEA model. The results are relatively more accurate, and the formula of the SBM model is:
and subject to the following conditions:
The value of z in the above Equation (1) denotes the efficiency value of the decision variable; S + denotes the slack variable of inputs, S – denotes the slack variable of outputs, and both of them should be greater than or equal to zero; m denotes the number of inputs; xi0 denotes the value of inputs of the decision unit, yr0 denotes the value of outputs; s denotes the number of outputs, and s denotes the number of outputs, the number of outputs, and so on. λ denotes the weight vector. Where a value of 1 for the efficiency value z indicates that the decision variable being evaluated is efficient, while when the value of z is less than 1, the decision variable is inefficient.
When solving the efficiency value according to the SBM model method, the efficiency value of the decision variable is generally less than 1. Still, at the same time, there will be a situation where there are many decision variables in the research object whose efficiency values are all 1, in which case it is not possible to use the efficiency value of the decision variable to determine the efficiency of the research object. It is necessary to use the Super-SBM model, also known as the super-efficiency model, which can further compare the efficiency value of the decision-making unit that has already reached efficiency. The formula of the super-efficiency SBM is as follows:
1 m a
∑ i
m̄i=1x
Z* = min i0
(3)
(3) where m, n, k represents the number of input indicators, desired output, and non-desired output indicators, respectively. xi0 denotes the input value, yr0 denotes the desired output value, pl0 denotes the non-desired output value, j denotes the province and city, a b, and c all represent the slack variables, λ is the weight vector, z* green technology innovation efficiency value, z* the larger, representing the higher level of green technology innovation efficiency.
Malmquist-Luenberger Index
ML indices allow for dynamic analysis of efficiency, and the one used in this paper is the global Malmquist-Luenberger index proposed by Oh [33] et al. This index defines the production frontier of each decision unit in period t as. Pt(xt) = {(yt, bt)|xt capable of producing (yt, bt)}, t = 1, 2, ....T, and the global production frontier as. PG(x) = P1(x1)∪P2(x2)∪PT(xT), where x = (x1, x2, ..., xN), x∈RN+ represents inputs, and y = (y1, y2, ..., yN), y∈RM+ represents desired output, and b = (b1, b2, ..., bJ), b∈RJ+ represents non-desired output. The direction vector is defined as g = (gy, gb), g∈RM+ ×RJ, In this paper, we refer to Y.H., Chung [34] and set the direction vector as g = (y, b), According to the definition of the global production technology set, the ML index of international reference is constructed as follows:
(4) where Eq. D0s(xt, yt, bs; yt, bs) is the directional distance function, indicates the probability that an increase in desired outputs will be accompanied by a decrease in non-desired outputs, the D0s(xs, ys, bs; ys, bs) = {β:(ys + βs, bs – βbs ∈ PG(xs)}, s = t, t+1, The ML index can be decomposed into the technical efficiency index (EC) and technological progress index (TC):
(5)
included among these:
(6)
In the above equation, the TEs represents the change in production efficiency, and TPGG,S represents the current production frontier of the decision unit PS and the global production frontier PG, EC represents the improvement of technical efficiency, when EC>1, it indicates that the technical efficiency has been improved, and vice versa, it will be reduced; TC represents the technological progress; if TC>1, it suggests that there is apparent technical progress, and vice versa, it indicates regression; ML>1 demonstrates that the efficiency of green technological innovation is improving, and vice versa, it means that the efficiency of green technological innovation is decreasing.
Selection and Description of Indicators
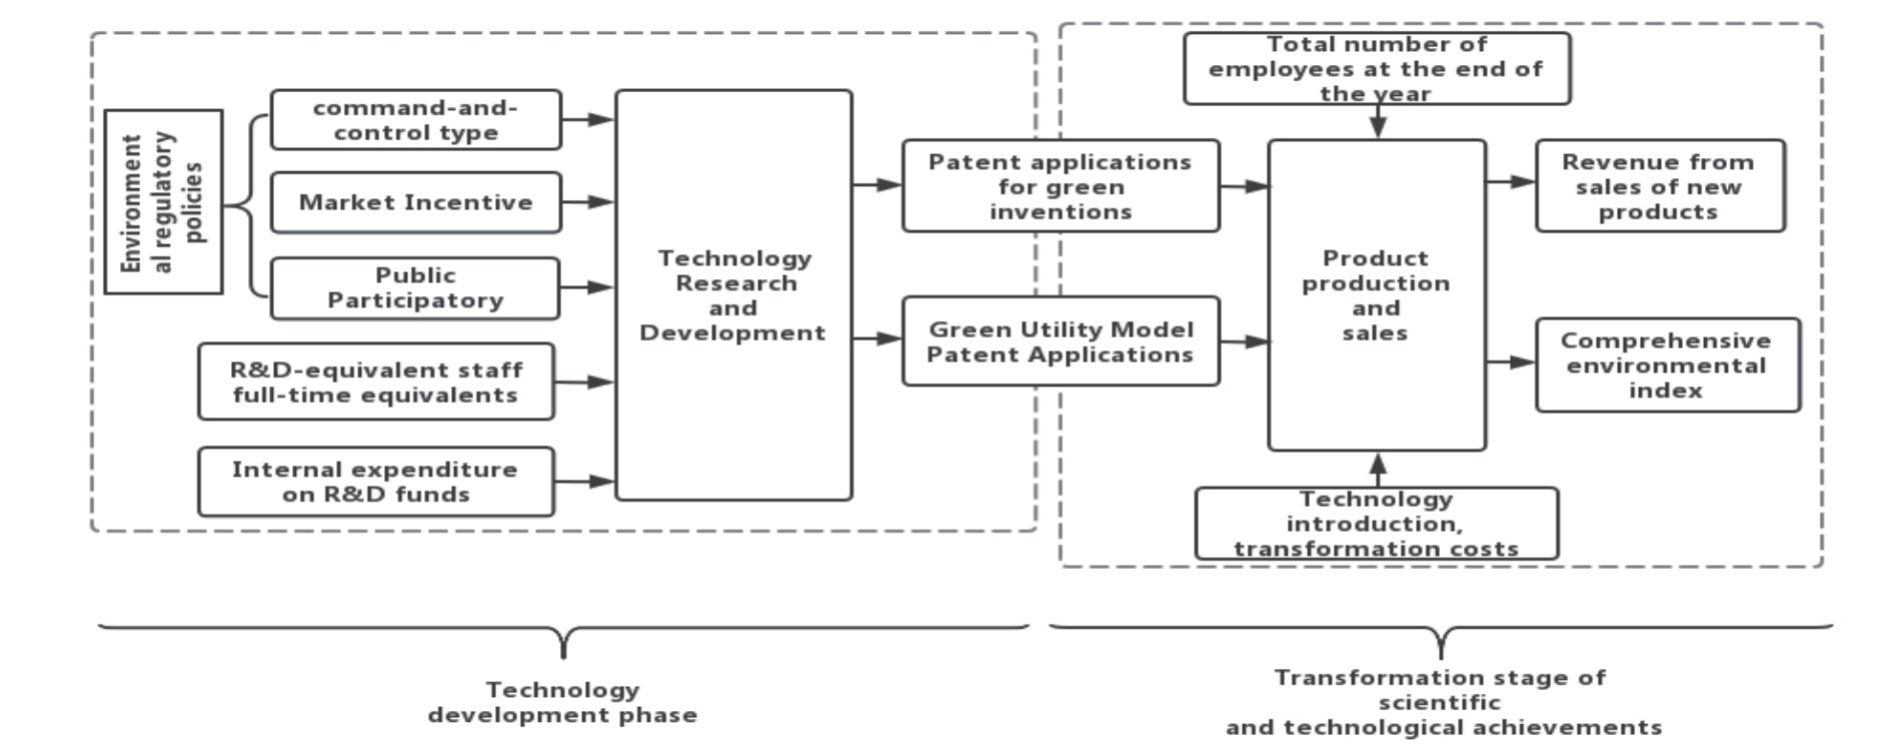
Under the perspective of the innovation value chain, the process of innovation activities of enterprises can be further staged, dividing innovation activities into the stage of technology research and development and the location of transformation of scientific and technological achievements, which can explore and discover the efficiency of each step and its changes in a more detailed way – process diagram of two phases of green technology innovation 1 Shown.
Input and Output Indicators for the R&D Phase
(1) Input indicators: R&D investment is a decisive factor for enterprises’ green innovation output, and R&D expenditure and R&D personnel are commonly used to measure the level of enterprises’ R&D investment. Because of the lack of data specializing in green innovation personnel and green R&D expenditure, this paper draws on the practice of Xiao Renqiao, Shen Lu, and Qian Li [35] to express green innovation personnel in terms of R&D personnel converted to full-time equivalents, and green R&D expenditure in terms of internal spending in R&D expenditure. This is mainly due to the difficulty distinguishing between ordinary and green innovators and the fact that the outputs of many non-green technologies also bring some environmental and economic benefits.
When enterprises carry out innovative activities, they are often affected by the government’s environmental regulatory policies, and there is no unanimous conclusion on the impact of environmental regulation on green technology innovation, and different types of ecological regulatory policies have other effects on innovation efficiency. In the process of innovation activities, the rules issued by the government have a solid binding impact on enterprises, forcing them to improve in the direction of green technology and reduce environmental pollution behaviors; therefore, this paper draws on the approaches of Li Bin, Milani S, et al. [36, 37] scholars, considering that regulations have a continuous impact, the number of local environmental protection laws, regulations, and standards are accumulated year by year to represent the command-and-control environmental regulation; as the public becomes more and more concerned about environmental issues, the government and enterprises will take the lead in assuming the responsibility of environmental protection, which will lead to a better public image and lower social governance costs. Therefore, this paper draws on the practice of Shim Shack J.P., Ward M.B. [38] and uses the number of sudden environmental events to represent the public participation type of environmental regulation. The number of sudden environmental events refers to the number of ecological events involving public safety that occur suddenly, cause or are likely to cause significant casualties, major property damage, and pose a considerable threat and damage to the economic and social stability and political stability of the whole country or a specific region, and have a significant social impact. In addition, Testa, Iraldo, and Frey [39] found that economic incentive-based environmental regulation means will reduce the financial profit of enterprises, market incentive-based environmental regulation requires enterprises to pay for the purchase of sewage rights, which is an additional cost burden on enterprises. It will have a crowding-out effect on the green development of enterprises. Hence, this paper adopts the amount of sewage charge levy to indicate the market incentive-based environmental regulation.
Output Indicator: In the R&D stage, enterprises invest green personnel and capital, and their outputs are mainly in the form of patents and other scientific and technological knowledge. The number of patent applications can better reflect the actual performance of enterprises in technological innovation. Among all patents, invention, and new-type utility patents are characterized by solid innovativeness and high social recognition, representing an enterprise’s scientific and technical output capacity. This paper selects the number of green invention patent applications and green utility model patent applications as output indicators [40]
.
Input and Output Indicators for the Transformation Phase
(1) Input indicators: Technological transformation is how an enterprise transforms the scientific and technical results developed into tangible assets. The input indicators of this stage include innovative inputs and non-innovative inputs. Creative inputs are represented by the outputs of the R&D stage, i.e., patents because in the two-stage perspective, the outcomes do not immediately exit the enterprise innovation system but continue to contribute to the innovation process as a new input. In addition, using patents as an indicator of information in the technology transformation stage is enough to verify the extent to which patents are transformed in the innovation system and whether the socio-economic benefits, they bring are favorable. In addition, to transform patents into practical economic value, some non-innovative inputs need to be added, such as the introduction fee of technological transformation and participating personnel. Therefore, based on the formation of green patents by green technological innovation, this paper draws on the practice of Wu Zenghai and Li Tao [41] and selects technological transformation, introduction fees, and end-of-year employees to represent the non-innovative inputs for technological change in this industry.
(2) Output indicators: The goal of green technology innovation is to realize economic growth and environmental quality improvement at the same time. Hence, this paper selects the expected results in terms of economy - new product sales revenue, and the unintended results in terms of environmental benefits - the comprehensive environmental index Therefore, this paper selects the expected result in terms of economy - new product sales revenue, and the unanticipated consequence in terms of ecological benefit - comprehensive environmental index, which are used to measure the result of green technology innovation. Among them, the new product sales revenue is the economic performance of the enterprise’s green innovation results, which can reflect the financial contribution of green technology to the enterprise. The comprehensive environmental index is a one-dimensional measure of industrial wastewater emissions, industrial sulfur dioxide emissions, and general waste solid disposal using the entropy method. Overall, the lower the emissions of these wastewater, waste gas, and solid waste, the higher the efficiency of the enterprise’s green technology innovation. The more it can reflect the eco-efficiency of that innovation project [11]. The system of green invention two-stage indicators is shown in Table 1. The two-stage indicator system of green innovation is shown in Table 1.
Data Sources
In this paper, panel data of input and output indicators of high-tech industries in 30 provinces (autonomous regions and municipalities directly under the central government) (excluding Tibet region and Hong Kong, Macao, and Taiwan region due to missing data) from 2011 to 2020 are selected to measure the efficiency of green technological innovation in high-tech industries. And the 30 provinces are categorized into three major regions: east, central, and west, as explained by the National Development and Reform Commission (NDRC). The data of the technology R&D stage and the transformation of the scientific and technological achievements stage are mainly obtained from the China Science and Technology Statistical Yearbook, China Environmental Statistical Yearbook, and the statistical yearbooks of each city in the corresponding years for supplementation, and the intermediate output indicators, green invention patent applications, and green utility model patent applications are obtained from the CnOpenData database.
Measurement Results and Analysis
Static Efficiency
Based on the panel data, China’s high-tech industries’ green technology innovation efficiency was measured, and its characteristics and change trends were analyzed. The results are shown in Table 2. In terms of the mean value, the mean value of green technology innovation efficiency of China’s high-tech industries increased from 0.4688 in 2011 to 0.5740 in 2020, showing a relatively small increase; the national mean value was 0.5277, and during the ten years, there were six years in which the efficiency value was higher than the national mean value and four years in which the efficiency value was lower than the national mean value; the efficiency value of provinces was classified into different grades by using the natural breakpoint method [42]: Low efficiency (0~0.4), medium-low efficiency (0.4~0.6), medium-high efficiency (0.6~0.8), and high-efficiency (more than 0.8). Among the 30 provinces, there are far more low-efficiency provinces (21) than high-efficiency provinces (9), which shows that China’s green technological innovation in high-tech industries is overall lower, and there are significant differences between areas. In the future, the focus will be on improving efficiency and the coordinated development of regions. In the end, the focus is not only on how to improve efficiency but also on regional coordinated development. From the inter-provincial level, Guangdong Province (1.4771) and Tianjin Municipality (1.1265) are the two regions with the best green technological innovation efficiency. Among them, the green technical innovation efficiency of Guangdong Province only slightly decreased from 2013 to 2016 and then steadily rebounded, indicating that the structure of inputs and outputs in Guangdong Province has gradually become reasonable; Tianjin Municipality has only had an efficiency of less than 1 in two of the ten years, indicating that in these ten years, the efficiency was less than 1 in the past ten years. This demonstrates that Tianjin can make better use of resources and maintain the unity of economic development and environmental protection in the process of growth during this decade and that Tianjin, as a first-tier city in China, with a high degree of marketization, abundant talent, and perfect technological development and supporting facilities, is a favored place for hi-tech enterprises, which pay great attention to both scientific and technical R&D inputs as well as technological transformations; followed by Beijing, Jiangsu, and Henan, etc. Secondly, Beijing, Jiangsu, and Henan rank high in green innovation efficiency. The average value of efficiency exceeds the national average, which shows that the level of green technology and enterprise management in these provinces is better, among which Beijing and Jiangsu are economically developed regions in China, which are also the concentration of talents and science and technology, with a perfect governance system and an optimized innovation environment, such as Beijing, which has already explored a synergistic development path of green development and scientific and technological innovation and has taken advantage of its strengths to attract talents extensively.
Table 1.
Two-stage indicator system for green technology Innovation rate.
Table 2.
Green technology innovation efficiency of China’s high-tech industries, 2011-2020.
Jiangsu Province, as a significant manufacturing province in China, has continuously strengthened digital green transformation, accelerated the technological innovation of green change, and strengthened the synergistic cooperation between enterprises and the manufacturing industry so that the efficiency of green technological innovation has been maintained at a high level. Henan is located in the middle and lower reaches of the Yellow River. It is an essential center of the nation’s people, logistics, and information flow, and it can flexibly adjust the direction of technological development during the enterprise development process; however, its neighboring provinces, such as Shaanxi, have poor outcomes of green technological innovation. However, its adjacent regions, such as Shaanxi, could be doing better in developing green technological innovation. This shows that Henan has yet to give full play to its leading role and to radiate to its neighboring provinces. It should accelerate the formation of a continuous development trend and agglomeration development effect while developing itself in the future. The lower rankings are Ningxia, Xinjiang, Inner Mongolia, Guizhou Province, Heilongjiang Province, etc. These areas are remote, lack scientific and technological talents, are relatively backward in terms of education and economic level, and the foundation of the green technology industry needs to be stronger, thus bringing poor returns on technological inputs.
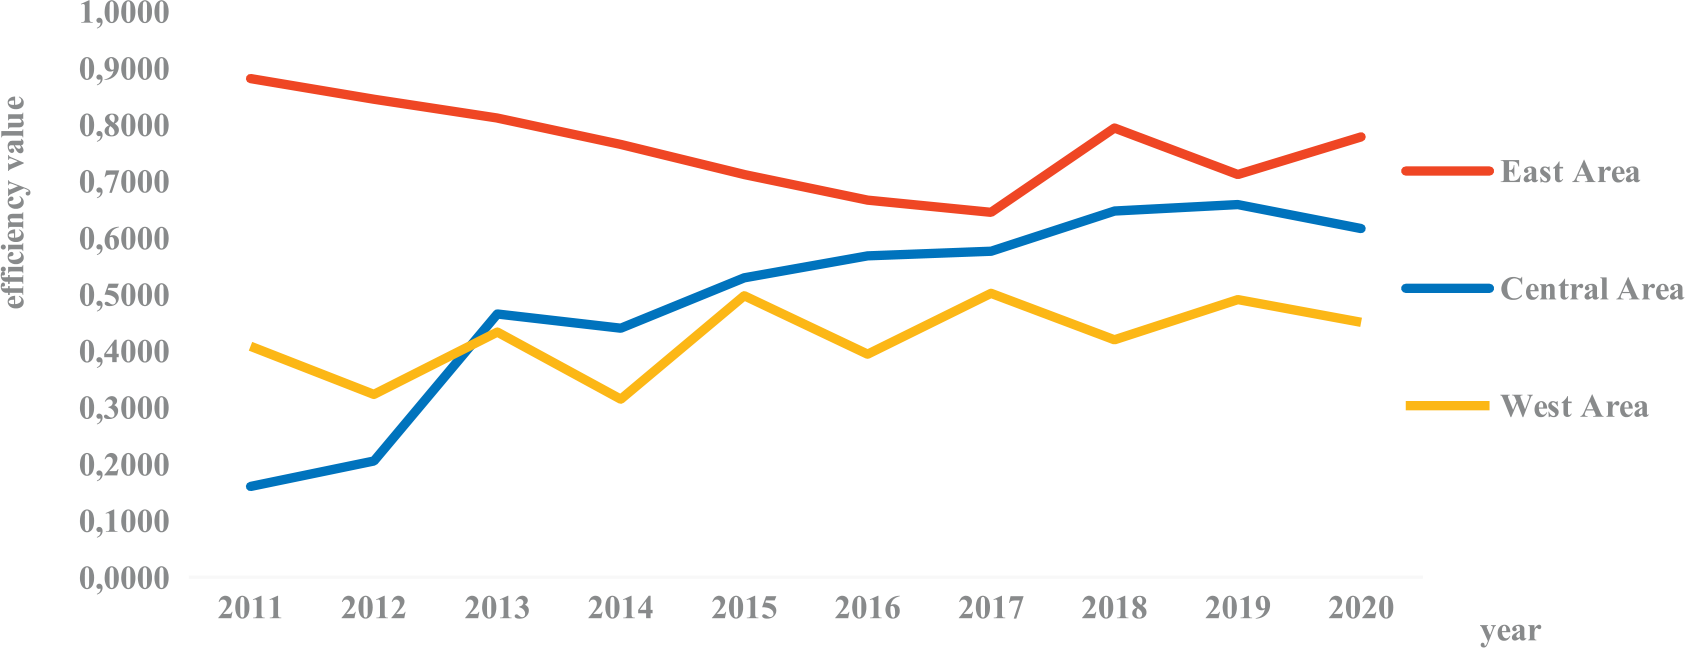
The curves in Fig. 2 reflect the efficiency values of the eastern central and western regions at different times. An efficiency value above 1 indicates that the region’s green technology innovation efficiency is effective. The average value of green technology innovation efficiency in the eastern region is 0.7782, leading the other two regions. Overall, the green technology innovation efficiency is highest in the east, followed by the center. Finally, the west and the three regions show a spatial distribution pattern that decreases from the east to the center to the west. From the perspective of each region, the green technology innovation efficiency curve of high-tech industries in the eastern region can be roughly divided into two segments, the first segment is from 2011 to 2017, the innovation efficiency fell from 0.8816 to 0.6449, a decline of 36.8%, the curve shows a downward trend year by year, and the second segment is after 2017, it shows a slow and unstable rebound, and the value of the efficiency in 2020 rebounded to 0.7782, which It shows that the input-output efficiency of the eastern region gradually tends to stabilize; the central region shows the characteristics of rapid and stable rise, from 0.2056 in 2011 to 0.6162 in 2020, rising faster than the other two regions, especially after 2017, the efficiency value of its green technological innovation and the east has not much difference, which shows that the central region has received extensive attention in recent years, and can use the government regulation policies, rationally arrange the input of resource elements, maximize the use of their own advantages, and constantly approach the direction of resource protection and economic development; the western region has experienced many rises and declines, showing a wavy trend of change, with a small increase in the efficiency value during the 10-year period, from 0.4081 in 2011 to 0.4505 in 2020, and reaching a peak in 2017 (0.5020), the unstable green technology innovation efficiency means that this region needs to be focused on in the future; overall, although the efficiency of the central and western regions is lower than that of the east, the growth of both is larger than that of the east, and after the development in recent years, the level of green technology innovation in the central and western regions is constantly approaching the east, which indicates that there is a huge potential for high-tech industries in the central and western regions in improving the efficiency of green innovation, especially in the central region, which has been gradually (Note: According to the general classification method, the level of green technological innovation in the central and western regions has been converging with that in the east. (Note: According to the general division method, the east includes Beijing, Liaoning, Tianjin, Hebei, Shanghai, Jiangsu, Zhejiang, Fujian, Shandong, Guangdong, and Hainan; the center includes Shanxi, Anhui, Jiangxi, Henan, Hubei, Hunan, Jilin, and Heilongjiang; and the west includes Inner Mongolia, Guangxi, Chongqing, Sichuan, Guizhou, Yunnan, Tibet, Shaanxi, Gansu, Qinghai, Ningxia, and Xinjiang)
Fig. 2.
Trends in green technology innovation in high-tech industries in three major regions, 2011-2020.
According to the results of existing research, considering the official implementation of the new environmental law in 2015, 2016 is the first year of the acceptance of the results of the environmental protection law, in order to be more able to reflect the current stage and future trends of the regions, the data of 2016 and 2020, the last year of the examination period, were selected for comparison, see Table 3, in the period of the examination, Guangdong Province and Henan Province have been steadily ranked in the high-efficiency ranks in the last five years, Jiangsu Province and Tianjin Province are located in the high-efficiency row column in the rest of the years except for 2017 in the medium-high-efficiency row; Beijing has risen from the medium-high-efficiency row in 2016 to the high-efficiency row in 2021, which can be seen that Beijing has permanently attached importance to the green technological innovation; Zhejiang Province has risen from the low-efficiency to the high-efficiency row in the five-year period, and its development is remarkably rapid, because in recent years, Zhejiang Province is vigorously encouraging the research and development of green technology and actively exploring the “Internet + energy saving and environmental protection” new model, and constantly improve the policy guidance mechanism, vigorously promote the green development of the manufacturing industry, the number of patents on green technology has increased year by year, only located in Jiangsu, Beijing and Guangdong after. Jiangxi, Shanghai, and Chongqing are consistently among medium and high-efficiency ranks. The stability of their green innovations cannot be separated from the support and guidance of policies, such as during the 13th Five-Year Plan period, Jiangxi Province has continuously improved the subsidy mechanism for clean electricity and then increased the subsidy standard for new energy vehicles; Hubei has been upgraded from medium and low efficiency to medium and high efficiency, and the number of provinces belonging to the medium and high efficiency has been changed from four to five. Most of the regions with high and medium efficiency originate from the east and center of the country, which is consistent with the previously obtained conclusion that the east and center of the country are relatively more efficient.
From 2016 to 2020, there was a gradual increase in the number of medium and low-efficiency provinces, from 4 to 6, of which Fujian, Gansu, Jilin, Yunnan, and other regions have risen from the previous low-efficiency to medium and low-efficiency, indicating that the overall efficiency of green technological innovation of China’s high-tech industries has been improved by a small margin in the period under investigation. The number of inefficient provinces has decreased by three during the five years. The low-efficiency sections mainly originated from the less-developed regions in the west, of which Guizhou, Qinghai, Guangxi, Xinjiang, Inner Mongolia, and other places have been in the low-efficiency areas. However, these places have superior ecological environments. The environmental protection and the pollution caused by the industrial process are contradictory to this problem but also need to be solved, such as Guizhou, a large coal mining province in the west, in the process of exploiting many mineral resources, caused severe pollution of the environment, resulting in green technological innovation is not efficient, the previous section can explain this analysis. This analysis can explain the specific reasons for the low efficiency of the western region obtained in the last area; Heilongjiang Province located in the northeastern area of Liaoning Province has also been in the low efficiency level, a possible reason is that as the main heavy industrial base of the country, the northeastern region gives priority to the development of heavy industry, making a significant contribution to the economy, at the same time, high energy-consuming and high-polluting industries to the environment has brought about a great deal of pressure, along with the reform of the economic system and the transformation of the industrial structure, the investment structure of the With the reform of the financial system and the change of industrial form, the distortion of the investment structure in the post-industrial era of the drawbacks are more prominent, and its level of economic development is more and more lagging behind, which in turn leads to a large number of talent outflow. Northeast China should seize the opportunity of the national revitalization of the old industrial base in Northeast China, quickly adjust the industrial structure, optimize the scientific research system, relax political authority, encourage local research institutes to research and development of green technology, retain local well-known and efficient talents, and continue to absorb innovative skills from all over the country, to achieve historic innovation. In conclusion, due to the large scale of China’s territory, the economy, geographic environment, and historical factors leading to the unbalanced development between provinces and cities [43], the performance of green technology innovation efficiency between regions is not the same; therefore, to make the balanced and coordinated development of the provinces and reduce the differences between the sections is the direction of China’s efforts in the future.
Table 3.
Distribution of Green Technology Innovation Efficiency Levels.
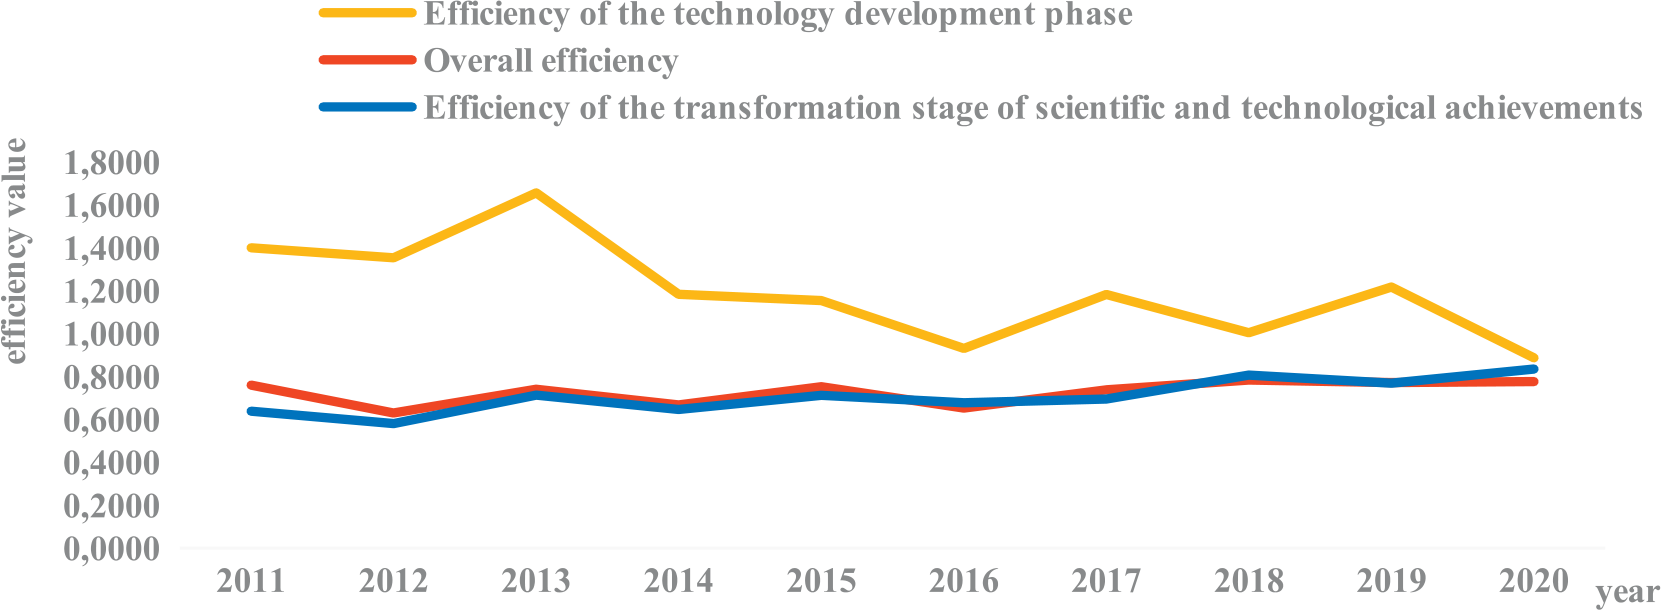
Fig. 3 reflects the changes in the efficiency of the technology R&D stage, the efficiency of the science and technology achievement conversion stage, and the overall efficiency between 2011 and 2020. First, the efficiency of the technology R&D stage reached its highest in 2013 and then showed a wave-like increasing and decreasing state, and the efficiency value is greater than 1 in all the years except for 2016 and 2020, which are less than 1. The decrease and increase in the scientific and technological achievements conversion stage are smaller, but the increase is more significant than the decrease, so the overall shows a wave-like upward trend; comparing the curves of the two phases, we can see that the input and output efficiency of the technology R&D stage is higher than the Input and output efficiency of the stage of transformation of scientific and technological achievements. In the examination period, the gap between the efficiency levels of the two phases is gradually narrowing and converging to a consistent state. Secondly, from the figure, we can see that the fluctuation trend of the overall efficiency curve and the fluctuation direction and amplitude of the angle of the transformation stage of scientific and technological achievements are almost the same, which can be seen that the transformation stage of scientific and technical achievements has a more significant impact on the overall efficiency. The difference between the two efficiency values is optional, indicating that we should maintain the advantages of research and development in innovation activities and pay more attention to synergizing the relationship between the two stages of efficiency transformation. In conclusion, the analysis, on the one hand, shows that in China’s high-tech industry, green technology innovation two-stage efficiency level, there is still ample space for development; on the other hand, can be seen that the two stages of efficiency together affect the overall efficiency of the change, therefore, should maintain the R & D stage of the efficiency of the advantages of the high efficiency at the same time, pay more attention to scientific and technological achievements into the efficiency of the enhancement of the efficiency.
Dynamic Analysis of the Malmquist-Luenberger Index
The dynamics of green technology innovation can be well reflected by the Malmquist-Luenberger index [44], and its decomposition value can be used to explore the deep-rooted reasons affecting the changes in the ML index, see Table 4.
From a general point of view, the average value of China’s ML index reaches 1.0719, which indicates that China’s green technological innovation level is in a state of progress; among the 30 provinces, 19 provinces have an ML index greater than 1, accounting for 63.3%, of which 16 areas have an ML index more significant than the average value, accounting for 53.3%, indicating that the overall change in the efficiency of green technological innovation in China’s high-tech industries in the various provinces is better. However, due to the significant differences in the spatial layout, economic development level, emphasis on policy and technology level of each section, the inter-provincial changes in innovation efficiency are also substantial; further analyzing the decomposition value of ML, it can be seen that there are 22 provinces with a technical efficiency index greater than 1, and there are only eight provinces with a technological progress index greater than 1, which indicates that most of the provinces pay more attention to the improvement of technical efficiency, and neglect the technological progress on the impact of green technological innovation.
The regions with more obvious growth in the ML index include Henan and Jilin, and Jiangxi, indicating that these three regions have been exploring how to allocate resources, manage personnel, optimize the whole innovation process, and have invested a lot of human resources and material resources in the past ten years, and have achieved corresponding benefits and reduced non-expected outputs; the ML index of Sichuan, Tianjin, Chongqing, and Shanghai also grew faster, indicating that the overall development trend of these provinces has been good. The ML index of Sichuan, Tianjin, Chongqing, and Shanghai also grows faster, meaning that the general development trend of these provinces is good, which may be due to the favorable geographic locations of Sichuan and Chongqing and the concentration of scientific and technological talents in Tianjin in recent years, which should continue to maintain a fast and stable development in the future. In addition, the ML index of Zhejiang, Anhui, Hubei, and Shanxi reaches more than 1, indicating that reforming the science and technology management system in these areas has been effective. After the ML decomposition, the index of technological efficiency in these places is greater than 1, but the index of technological progress change is less than 1. These provinces should take advantage of their strengths and, based on stably making progress, lay out the structure of inputs and outputs more efficiently and reasonably and invest more human resources into innovation management. Human resources into the innovation management process to promote technological progress while keeping the characteristics of technological efficiency growth in good play. Guangxi and Guangdong’s ML indexes have also reached more than 10%. Still, the EC is less than 1, thus hindering the improvement of the ML index, and these two places should focus on strengthening the improvement of technical efficiency. The growth of technical efficiency and technical progress indexes in Jiangsu and Beijing are relatively balanced, and both positively promote the advancement of green technology innovation efficiency. The provinces with an ML index less than 1 are Liaoning, Yunnan, Inner Mongolia, Hebei, Qinghai, Shandong, Ningxia, Hainan, Heilongjiang, Xinjiang, Gansu, and other 11 provinces, which can be seen through the ML decomposition, among which, the provinces of Yunnan, Inner Mongolia, Hainan, and Heilongjiang have EC more significant than 1. The TC is less than 1, which indicates that the ML index of these provinces is less than 1, mainly because the change in technological progress is too low. Even if technological efficiency is effective, technical progress negatively affects its effectiveness. The two decomposition values of the ML index of the remaining provinces are all less than 1. The improvement of the ML index of these provinces is not only affected by the decline of technological progress but also negatively affected by technological efficiency, so it can be learned that the input-output layout of these provinces is not too reasonable, and the investment in the cultivation of high-end innovative talents and innovative technology is not enough.
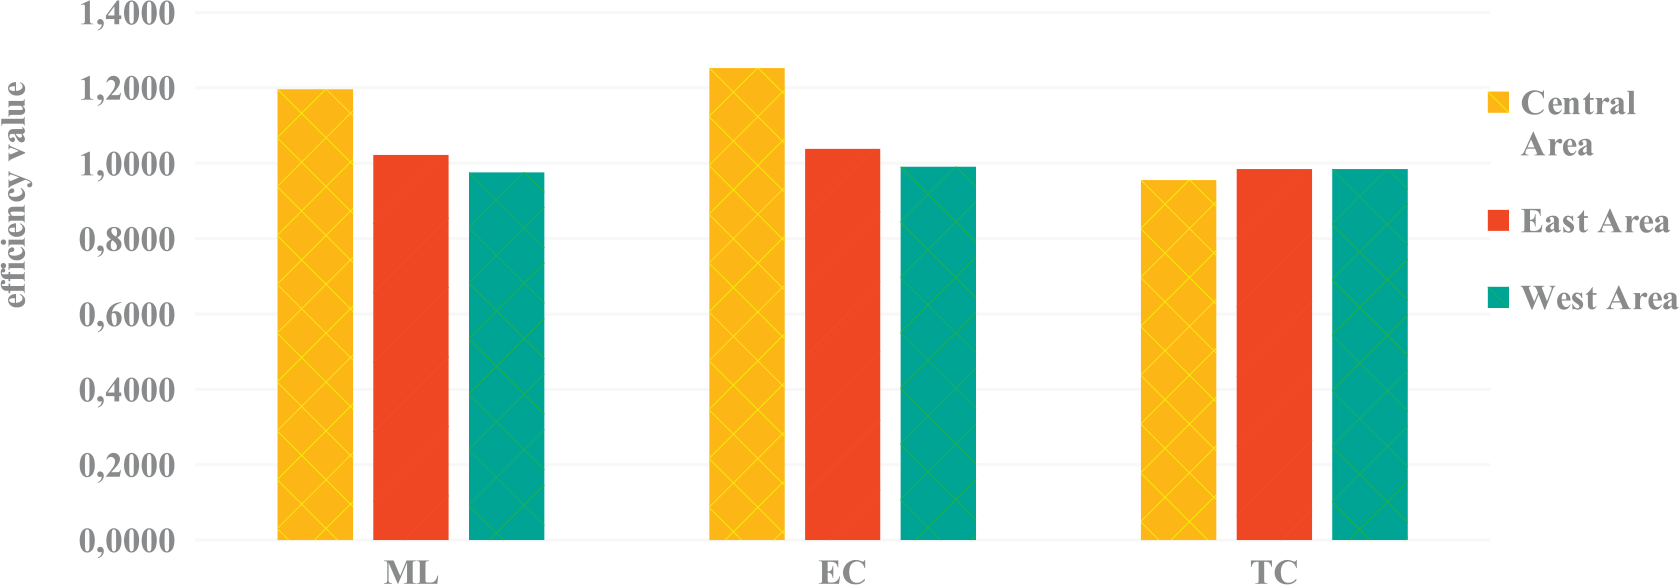
Fig. 4 reflects the ML index and its decomposition value in the east, center, and West. As can be seen from the figure, the growth of the ML index in the eastern region mainly relies on the development of technical efficiency (EC), which is similar to the conclusions of most scholars [45], indicating that the management concepts and technological input conditions in the eastern region are more compatible with the size of the area, such as Beijing and Shanghai located in the east part of the country, which have a large number of renowned colleges and universities and scientific research institutes that constantly contribute to the green technological innovation; at the same time, the central region’s ML index growth also relies mainly on the addition of technical efficiency (EC) progress, the efficiency of green technological innovation has been optimized to the greatest extent possible, and even if technological progress is in decline, innovation efficiency is still growing. The probable reason is that with the development of the industrial structure adjustment accelerated, high-tech industries began to transfer to the central region. The industrial cluster effect makes the main part of high-tech industry technology green technology innovation level has dramatically improved, and the technical efficiency index significantly improved; In contrast, the western region ML index is subjected to the negative impact of the decline of technical efficiency (EC) and technological progress (TC), which makes the region ML index Only 0.9755; the western part is located in the remote area, resources, and energy are relatively limited, educational conditions, economic development model is relatively backward, the lack of scientific and technological innovation talents, technological innovation consciousness is not high, its innovation environment and resource conditions are relatively backward, making the development of green technological innovation slow. Overall, the best change in green technological innovation is in the central region, but the technological progress index in the main area is the lowest; the reason for this phenomenon is that the effect of the increase in technical efficiency in the central region offsets the impact of the decline in technological progress; in green technological innovation, the increase in technological efficiency (EC) is an essential factor to promote its role. The middle east and west decrease characterize the ML and EC indexes.
Table 4.
Malmquist-Luenberger index and its decomposition of green technology innovation efficiency in China’s high-tech industries.
As can be seen from Table 5, from 2011 to 2014, the ML index of the R&D stage was less than 1. From 2014 to 2019, the ML index of the technology R&D stage was more significant than 1, of which the growth rate of the ML index reached more than 10% in 2014- 2016 and the growth rate got more than 20% in 2016- 2018, which indicates that the efficiency of the R&D stage of China’s high-tech industry has been continuous improvement, and the efficiency of the R&D stage may be reduced from 2019 to 2020 due to the impact of the epidemic; the efficiency of the transformation of scientific and technological achievements during the ten years is only occasionally greater than 1 in recent years, which, on the one hand, indicates that the efficiency of the transformation of scientific and technological achievements in China is generally low, which is also a cause of the low efficiency of the overall green technological innovation.
Table 5.
Two-stage ML and its decomposition values.
On the other hand, the high-tech industry has continuously improved the efficiency of the achievements transformation and has seen the first results in recent years. From the perspective of efficiency decomposition, the R&D stage has TC and EC less than 1 in 2011-2013, and EC is greater than 1 in 2014-2018, while TC is greater than 1 in only one year during this period, indicating that the technology R&D stage mainly relies on the improvement of technical efficiency, and technological progress plays a minor role; during the period of examination, the results transformation stage has TC greater than 1 in 2012-2013, 2014- 2016, and 2017-2020 all have EC more remarkable than 1, while TC is only greater than 1 in 2019-2020. The growth of efficiency in the stage of transformation of scientific and technological achievements also relies mainly on the growth of the EC index. Vertically, during the examination period, the ML index of China’s high-tech industry’s technology research and development stage is generally growing. The ML index of the transformation of scientific and technological achievements step still needs to be more effective. Still, it is also improving, and the efficiency change of the technology research and development stage is higher than the efficiency change of the transformation of the scientific and technological achievements stage. The gap between the efficiency of the two phases is decreasing.
Conclusions and Recommendations
The static and dynamic analysis of the green technology innovation efficiency of China’s high-tech industries has led to the following preliminary conclusions:
(1) Although China’s green technological innovation efficiency shows a positive trend, the gap between provinces is large, and the overall efficiency is not high, and there is still a lot of room for improvement in the future; (2) The green technological innovation efficiency of the eastern, central and western regions is ranked from high to low, and the differences among the three major regions are not only reflected in the spatial pattern, but also in the growth rate, and the central region is growing particularly fast; (3) China’s green technological innovation inefficient provinces are gradually decreasing, indicating that the level of green technological innovation in China’s high-tech industries is constantly improving, and the inter-provincial differences are constantly shrinking; (4) During the investigation period, the ML mean value of the green technological innovation efficiency of China’s high-tech industries is greater than 1, indicating that its overall development is in a state of progress; (5) From the viewpoint of the three major regions, the improvement of the ML index in the eastern and central parts of China is mainly due to the increase in technological efficiency, and the (5) From the perspective of the three regions, the increase of ML index in the east and center of China is mainly due to the improvement of technical efficiency, while the decrease of ML index in the west of China is affected by the joint decline of technological progress and technological efficiency; (6) From the perspective of the two-stage perspective, the efficiency of the technology research and development stage is higher than the efficiency of the stage of transformation of scientific and technological achievements, and the inefficiency of the stage of transformation of achievements is mainly affected by the inhibition of technological progress. The above conclusions imply the following insights:
(1) Different provinces have different economies, cultures, and resource allocations, leading to differences in green technological innovation efficiency. We should accelerate the rapid and balanced development of the economy, optimize the level of resource allocation, and at the same time, strengthen environmental protection and pollution control, formulate inclined policies for the central and western parts of the country, and improve the efficiency of the research and development stage and the transformation of scientific and technological achievements, to improve the efficiency of green technological innovation in all provinces and cities and all regions.
(2) China’s high-tech industry should strengthen the management level of technological innovation, improve the utilization rate of resources, enhance the awareness of the integration of green technology into the R&D of enterprises, improve the conversion output of green innovation, actively promote the exchange of green technology, strengthen the integration of industry, academia, and research, and encourage the investment in the R&D of green technology, and at the same time, constantly adjust its technological direction, closely integrate green technology with social needs, and develop towards environment-friendly enterprises.
(3) The government should play an active role in enterprises’ green innovation activities and set more flexible and applicable environmental regulation policies to guide enterprises’ green technological innovation in all aspects of green inputs, energy consumption, environmental protection, and transformation of achievements, and at the same time, increase the regional synergistic development, pay more attention to the regions with low efficiency of green innovation, to tilt the resources to the inefficient areas, and incorporate the environmental regulation and pollution indexes into the evaluation index system of green technological innovation efficiency-technology innovation efficiency evaluation index system, to realize the typical leap of economic growth and environmental protection.

