

Introduction
Environmental protection is becoming an increasingly important issue in global development, and China is also actively participating in it. A series of comprehensive policies has been implemented, such as to develop green and low-carbon industries and advocate green consumption to promote the formation of green and low-carbon production methods and lifestyles. Capital plays an important role in supporting the development of the real economy, and financial support can prevent and resolve corporate debt risks and promote the development of enterprises, which is the key to “stabilizing enterprises and ensuring employment”. Hence, the development of green finance can not only inject vitality into China’s low-carbon transformation but also be an important measure to stabilize and expand employment. Therefore, vigorously promoting the development of green finance is an important way for China to achieve high-quality economic development.
Green financial product tools and market systems have been continuously improved and enriched. A multi-level green financial product and market system includes green credit, green bonds, green insurance, green funds, green trusts, and other carbon financial products [1]. China’s financial system is dominated by banks, and green credit is the main force of China’s green finance. At the same time, green credit is also the most direct financial tool to alleviate corporate financing constraints and promote the transformation of corporate green development. In July 2007, the General Administration of Environmental Protection, the People’s Bank of China and the China Banking Regulatory Commission (CBRC) jointly issued the “Opinions on Implementing Environmental Protection Policies and Regulations to Prevent Credit Risks”, indicating that green credit has become an important means of pollution reduction in China. More than 20 provincial and municipal environmental protection departments and local financial regulators have jointly issued implementation plans and specific rules on green credit.
On February 24, 2012, the China Banking Regulatory Commission issued the “Green Credit Guidelines”, commonly referred to as the “Guidelines”. This event marked a significant milestone in the promotion of green credit. The “Guidelines” emphasize the need to enhance financial support for the green economy, low-carbon economy, and circular economy while mitigating environmental and social risks. It also includes the following four supporting measures:
Construct green credit statistics system, in order to strengthen the monitoring and evaluation of green credit implementation.
Establish specialized guarantee mechanisms to support the development of green credit through measures such as re-lending.
For projects supported by green credit, financial discount support can be applied according to regulations.
Take green credit into the MPA framework, and take the evaluation results of key indicators of the implementation of green credit.
In 2014, the “Key Evaluation Index of Green Credit Implementation”, specifically tailored for green credit, was introduced into commercial banks. It clearly identified a list of “two high and one surplus” industries. Subsequently, the “Green Credit Performance Evaluation Scheme for Banking Deposit Financial Institutions” was introduced in 2018. This scheme, which incorporates incentives and constraints, provides comprehensive evaluation of the green credit performance of banking financial institutions.
Currently, green credit is experiencing rapid development. By the end of 2022, China’s green loan balance reached EURO 3 trillion, representing a significant year-on-year increase. This remarkable growth positions China’s green credit stock as the largest in the world.
The impact of economic green transformation on the labor market is related to the most basic survival problems of employees in traditional high-carbon industries. Green transformation has created new jobs. Some unemployment directly caused by technology may be partially compensated by decarbonization measures, and it has also led to some changes, such as the skill demand of many jobs. Environmental regulation, fiscal policy, and monetary policy all represent important ways to guide the low-carbon transformation of enterprises. In the previous literature, there are many studies on the impact of the first two ways – of closing polluting enterprises and collecting sewage charges – on the labor market. There are few studies on the impact of monetary policy on the labor market, which only focus on the impact on heavily polluting enterprises. There is little research on the impact of green enterprises. The loan interest rate of green credit is about 3.55%, which is significantly lower than the average interest rate of corporate loans. Taking the perspective of the monetary policy of green credit, this study explores its impact on the labor market, which is an important supplement to the existing theory. After the implementation of the green credit policy, and compared with polluting enterprises, green enterprises can acquire more capital, purchase advanced and environmentally friendly production equipment, and realize the rapid development of enterprises, which brings about changes in the labor demand and transformation of labor to green employment. Studying this issue not only helps us to clarify the impact of green finance on the structure of social employment but also helps in providing policy recommendations for high-quality development of the real economy under the dual background of developing green finance to help enterprises achieve low-carbon transformation and stabilize employment expansion.
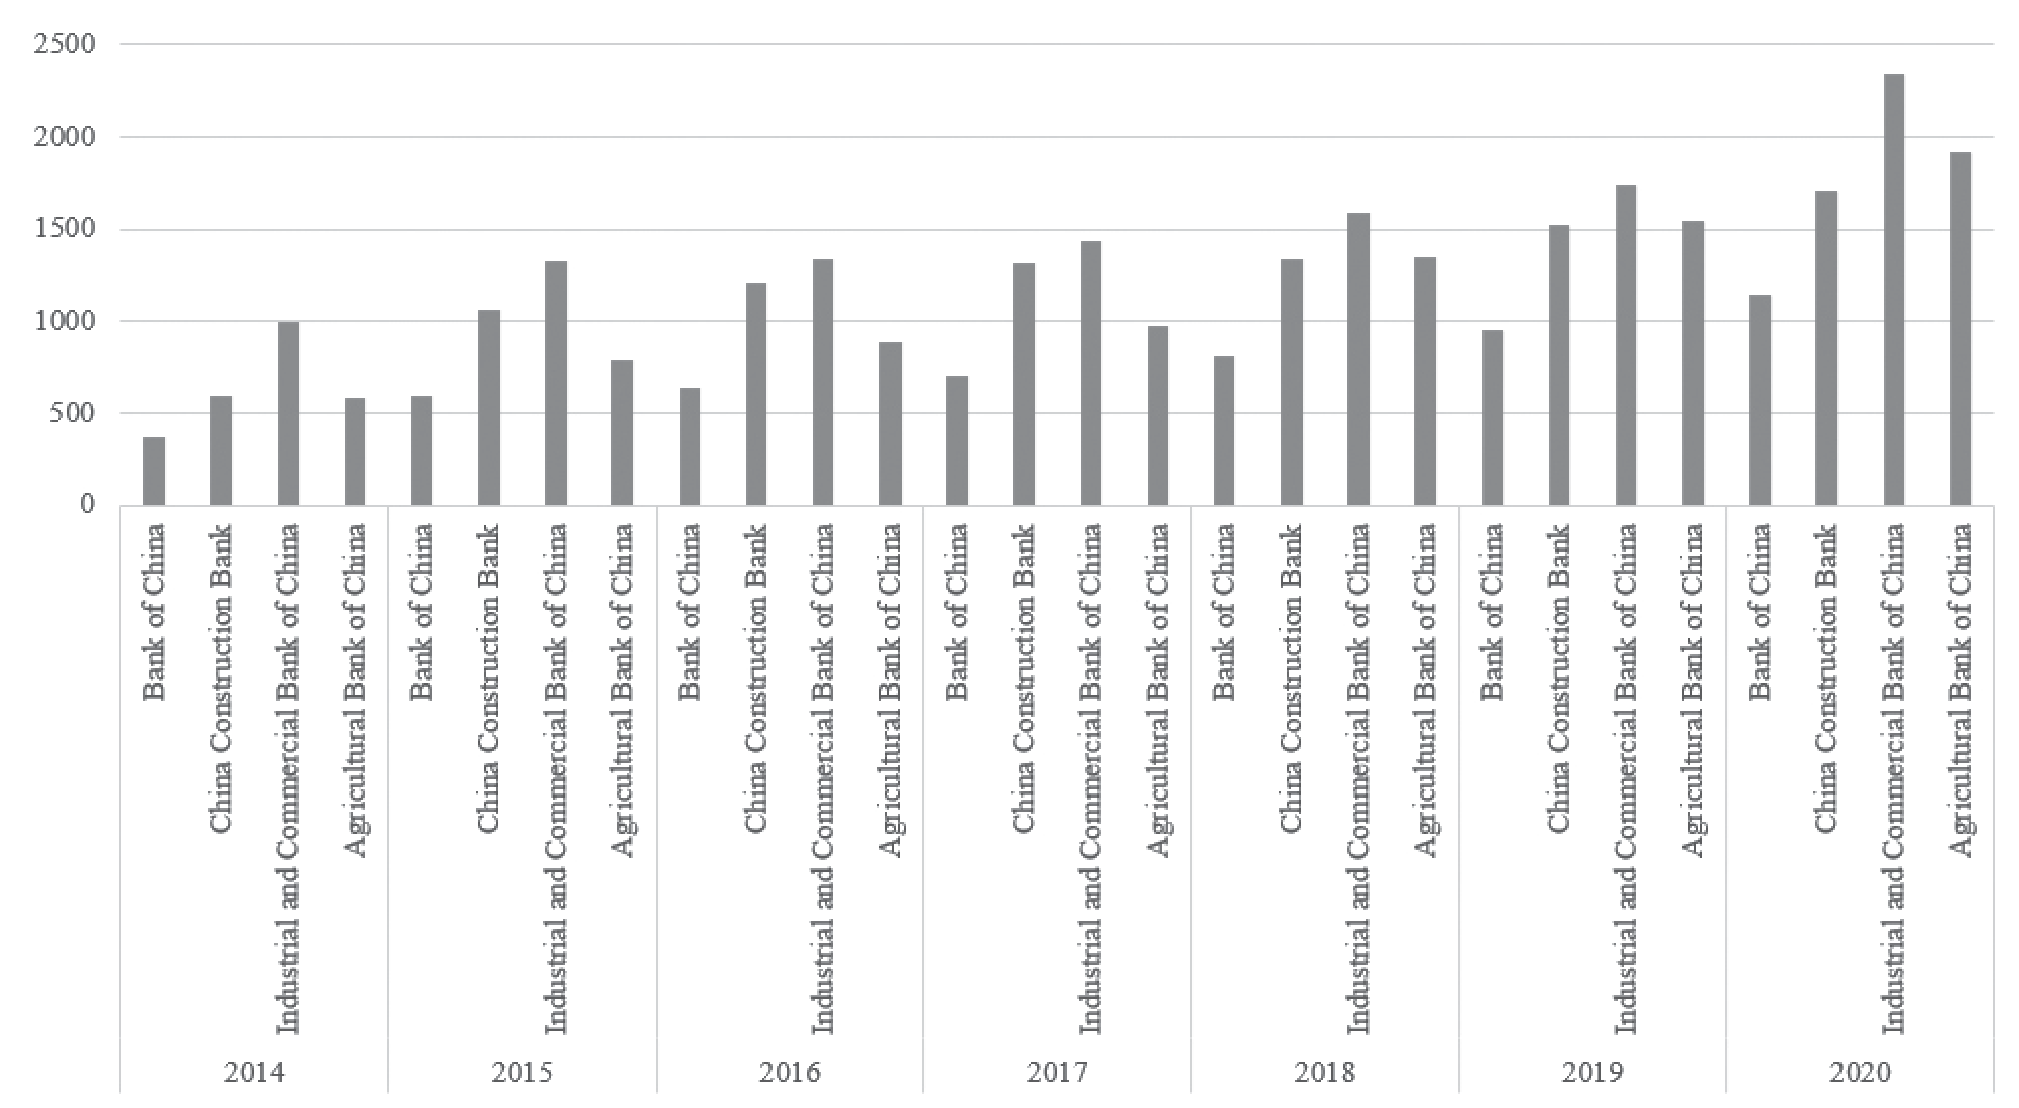
The main conclusions of this paper are as follows: First, the implementation of green credit has led to the reallocation of labor between polluting and green industries. After the implementation of green credit, the number of employees in traditional high-carbon industries has increased less than that in green low-carbon industries. From the perspective of structure, the proportion of highly skilled labor is increasing faster in green industries than that in polluting industries. Green credit supports the rapid development of green enterprises, which is of great significance for the transformation of employment.
Secondly, the impact mechanism of green credit on the labor market includes positive and negative components. On the one hand, due to capital–skill complementarity and the fact that the complementarity between capital and highly skilled labor is stronger, green enterprises will focus on increasing the employment of highly skilled labor. On the other hand, green credit reduces the loan cost of enterprises, so the long-term loans of green enterprises increase, and more debt will reduce the demand for labor. However, the former plays a stronger role, so capital – skill complementarity is an important mechanism for green credit to affect changes in labor demand and demand structure.
Finally, green credit has a differentiated impact on different enterprises. State-owned enterprises and private enterprises have great differences in decision making. In the case of obtaining green credit, state-owned enterprises focus on the quantity of labor, while private enterprises pay attention to the quality of labor. They tend to absorb more highly skilled workers and thus increase the proportion of skilled workers. Therefore, green state-owned enterprises can stabilize employment, and green private enterprises play an important role in alleviating the employment pressure of highly skilled talent. Therefore, green credit is an important measure to stabilize and expand employment in low-carbon transformation. Regional heterogeneity analysis shows that in the eastern and central regions with relatively high economic development, green credit has a greater effect on increasing the number of jobs in green industries. In the northeastern regions, green credit has an impact on increasing the proportion of highly skilled jobs in green industries; that is, improving the quality of employment.
Different scholars have evaluated the impact of numerous policies on labor demand, including employment volume and employment structure. The research perspective is divided into two aspects: on the one hand, the use of industrial robots [2] and artificial intelligence [3] brought by technologies will have a certain impact on the employment. On the other hand, green policy has also led to labor reallocation. A large number of scholars have evaluated the impact of different green policies, including environmental regulation, low-carbon city pilot, and other means, on employment. The research found that environmental regulation has a negative effect on employment [4] and that and low-carbon city pilot policies (LCCPPs) enhance enterprises’ labor demand by forcing enterprises to engage in front-end environment governance (changes in the production process) [5]. The carbon tax has had a strong negative impact on energy intensity and electricity use, but no statistically significant impacts are found for employment [6]. Implementation of the Clean Air Act (CAA) in China generated job destruction in polluting industries and their downstream industries, as well as job creation in clean industries [7]. Differently from the above-mentioned environmental regulation and other green policies such as taxation, green credit uses monetary policy to adjust interest rates and affects the labor demand of enterprises by affecting corporate capital.
Since the implementation of green credit policy, a large number of examples in the literature have begun to evaluate the impact of green credit policy on enterprises from a micro perspective. For example, green credit has significantly reduced firm performance [8], research and development (R&D) intensity and total factor productivity (TFP) in heavily polluting industries [9], improves green total factor productivity (GTFP) in green industries [10]. For the impact of green credit on labor, there are only the following related studies: the “Guidelines” have significant crowding-out effects on the labor demand of high-polluting enterprises. One explanation is that the “Guidelines” inhibit labor demand by increasing the productivity of high-polluting enterprises [11]. Another explanation is that high-polluting firms are challenged with higher financial costs and financial constraints [12]. This effect is greater for capital-intensive and high-wage industries. Green transformation not only has a certain impact on the total employment of enterprises but also changes the skill composition of many jobs. However, the impact of green credit on the skill composition of workers has not been specifically evaluated by scholars.
Capital and labor are two major input factors of enterprise production, and the relationship between them is very important. The existing literature focuses on how capital affects labor from the perspective of debt and financing costs. Since labor depends on the bank’s credit support, the expiration of long-term loans has a negative impact on corporate employment [13]. Raising financing costs will reduce employment and wages. In the face of interest rate shocks, companies which is small or with higher leverage ratios are less likely to hoard labor [14], so they are more sensitive to exogenous financial shocks, adjust labor more quickly, and have greater short-term labor demand elasticity [15]. The above research focuses on the company level.
The existing literature shows that interest rates, as capital prices, have an important impact on labor, but the mechanism of how interest rates affect labor employment is not clear. We use the theory of traditional capital-skill complementarity, from the perspective of enterprise demand, in combination with the emerging hot topic of green finance to explore the impact of green credit on the total employment and structure of enterprise labor.
This paper presents the following three innovations. First, in terms of research perspective, the existing literature only studies the relationship between interest rate, debt, and the number of employees from the perspective of corporate finance, or only studies the impact of green policy on the labor market from the perspective of the environment. This study combines finance, the environment, and the labor market in studying the impact of green finance, a quasi-natural experiment, on the labor market. Secondly, in terms of the analytical framework, both green and polluting industries are included in the research and analysis framework at the same time. By comparing and analyzing the total labor force and structural changes in the two industries before and after promulgation of the green credit policy, the process of labor reallocation among different industries is demonstrated. Third, in terms of impact mechanism, from the perspective of enterprise demand, we explore the positive and negative mechanisms and find that under the premise of capital-skill complementarity, the positive mechanism of capital increase plays a greater role, which is a more important reason for the change in labor quantity and structure.
Material and Methods
Theoretical Analysis
We construct a two-layer nested CES (constant elasticity of substitution) production function. There are three ways to combine capital, skilled labor, and unskilled labor, represented by the skilled-unskilled and capital combination, capital-unskilled and skilled combination [16], and capital-skilled and unskilled combination [17, 18]. We draw on the last form to explain changes in the total employment and employment structure of corporate labor caused by green credit. The reason is that we assume that capital and highly skilled labor are more complementary. This assumption is based on capital and highly skilled labor having less elasticity of substitution than that of capital and lowly skilled labor.
Assume that each green enterprise and polluting enterprise faces the same profit problem:
A represents production efficiency, θ1 and θ2 are two share parameters of production factors, which satisfy 0<θ1, θ2<1, w represents the wages of lowly skilled workers, and v represents the wages of highly skilled workers, in which w<v. l represents the number of lowly skilled people, and h represents the number of highly skilled people. The two types of labor forces can flow freely between green industries and polluting industries, but the highly skilled labor market and the lowly skilled labor market are completely segmented. Suppose that the product is sold at its unit price, r represents the loan interest rate, k represents the capital, the green enterprises and the polluting enterprises aim to maximize profits, so the following conditions are met:
According to (3) and (4), the demand for highly skilled labor force is:
According to (2) and (4):
According to (5) and (6), the demand for lowly skilled labor force is:
The total demand for labor force is denoted as E(r);
Because of capital-skill complementarity, α<0<β<1 , and it can be proved that E(r)/k is an increasing function of r; that is, E(r) increases with the increase in k and r, but k decreases with the increase in r, so the two mechanisms of interest rate r affecting labor demand E(r) are: assuming that the interest rate r decreases, on the one hand, it will lead to the increase in capital k, and because of the capital-skill complementarity, it will increase the employment of labor, especially highly skilled labor. The other part is due to the decline in the interest rate r, so there will be more borrowing, especially more long-term loans, and long-term loans due will lead to enterprises to reduce labor employment.
According to (6) (7), the ratio of lowly skilled and highly skilled labor demand is:
Due to capital-skill complementarity, enterprises with green credit have more capital and more demand for highly skilled labor, so it can be proved that P(r) is an increasing function of r.
It is assumed that before the introduction of green credit policy, green enterprises and polluting enterprises face the same loan interest rate r. After the introduction of the green credit policy, the interest rate of green industries is r', the interest rate of polluting industries is mr', and r'<r<mr' (m>1) is satisfied. r' and mr' are both exogenously given.
Hypothesis 1: After the implementation of green credit policy, the total labor demand increases more for green enterprises.
Hypothesis 2: After the implementation of green credit policy, the proportion of highly skilled labor increases more in green enterprises.
Hypothesis 3: There are positive and negative mechanisms for the implementation of green credit policy to affect employment volume and employment structure. First, under the premise of capital-skill complementarity, capital increase will cause labor to increase in green enterprises, especially of highly skilled labor. Second, under the premise that the maturity of long-term loans leads to tight cash flow, the increase in long-term loans will reduce employment, especially of highly skilled labor.
Data, Model and Variable Description
This study utilized the CCER economic and financial database and focused on China’s A-share non-financial listed companies between 2005 and 2020 as the research sample. In order to enhance the representativeness of the data, we exclude enterprises that have abnormal conditions during the sample period.
The study focuses on two main explained variables: Employment, representing the total number of employees (in logarithm form), and Percent, indicating the proportion of highly skilled workers among the total employees. This paper first distinguishes human capital according to the nature of employees’ work and regards technical personnel as skilled labor, also known as highly skilled labor, while production personnel, sales personnel, administrative personnel, and other personnel are regarded as unskilled labor, also known as lowly skilled labor. This paper introduces two proxy variables: Skill, representing the total number of skilled workers (in logarithm form), and Unskill, representing the total number of non-skilled workers (in logarithm form). These variables serve as proxies for the number of highly skilled labor and lowly skilled labor, respectively.
According to the “Guidelines”, the former CBRC clarified the types of environmental and social risks in the “Key Evaluation Indicators for the Implementation of Green Credit”. In this paper, the industries of enterprises with environmental and social risks of Category A and Category B are identified as polluting industries (control group, Treati = 0); otherwise, they are identified as green industries (treatment group, Treati = 1). Specifically, the industries of Category A enterprises include the coal mining and washing, oil and gas mining, black metal mining, non-ferrous metal mining, and non-other mining industries. Category B includes 19 types of enterprises in the industries of leather, fur, and its products, paper and its products, ferrous metal smelting and rolling processing, pharmaceutical manufacturing, chemical raw material and chemical product manufacturing, civil engineering construction, textile, electricity, heat production and supply, and etc.
Period is a dummy variable. The period after the implementation of “Guidelines” (2012 and after) is 1, and the period before the implementation (before 2012) is 0. In addition, DIDi = Treati×Period, and the model is set as follows:
What we are most concerned about is the pre-DIDi coefficient, which examines the difference in the impact of the “Guidelines” on employment in green and polluting industries. If it is significantly greater than 0, it shows that the “Guidelines” significantly promote green enterprises to increase employment; vice versa, it shows no significant promotion. Similarly, when the explained variable is replaced by Percent, if it is significantly greater than 0, it shows that the “Guidelines” significantly promote green enterprises to increase the proportion of highly skilled labor; vice versa, it shows no significant promotion.
The control variables at the enterprise level in this paper include the total assets (take the logarithm), denoted as Asset, and for cash flow, the net cash flow generated by the current operating activities is adopted, denoted as Cash; profitability (Pr_ab) is expressed as the ratio of operating profit to total operating income; ROE is expressed as the ratio of the net profit attributable to the shareholders of the parent company to the equity of the weighted average attributable to the shareholders of the parent company; the asset-liability ratio (Lev) is expressed by the ratio of total liabilities to total assets, and the skill premium (Skill _ premium) is expressed by the total salary of senior managers dividend by the salary payable to employees.
In the unbalanced panel data, Category A enterprises accounts for 2.17% of the total sample, Category B enterprises accounts for 31.06% of the total sample, and the remainder are enterprises that obtain green credit, accounting for 66.8% of the total number of enterprises, so the following is no longer a separate analysis of Category A and Category B enterprises, which is regarded as a unified control group.
Parallel Trend Test
First, we conducted a parallel trend test to evaluate the effectiveness of the difference-in-difference method. This test assesses whether the outcome variables of the treatment group and the control group exhibit a common time trend prior to the implementation of the policy. Fig. 2 and Fig. 3 illustrate the average trend change maps for green industries and polluting industries, respectively, in terms of the total labor force and its composition.
Table 1.
Variable descriptive statistics.
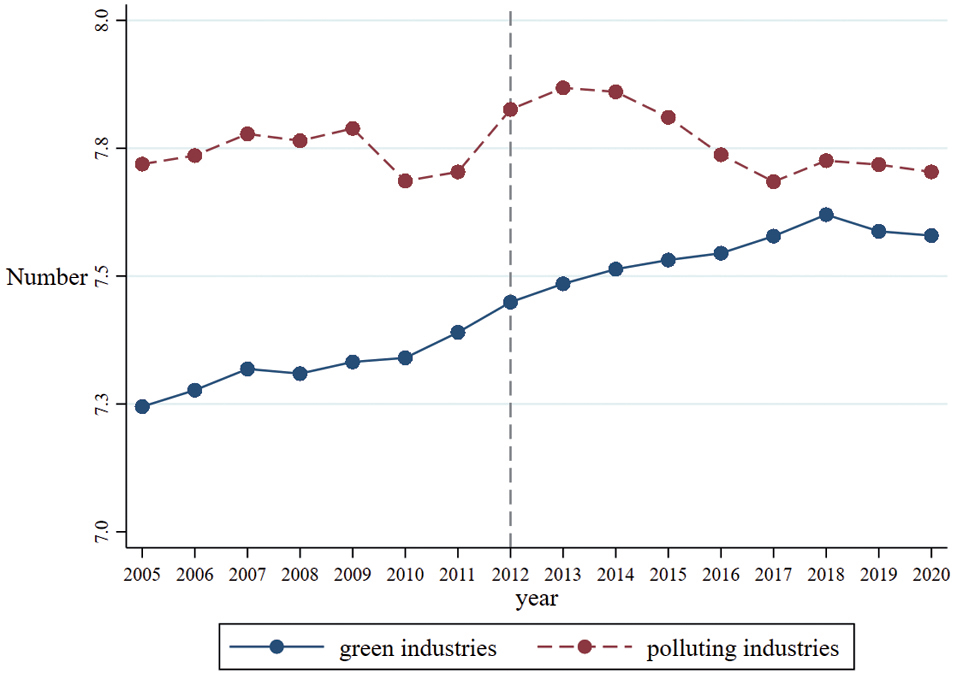
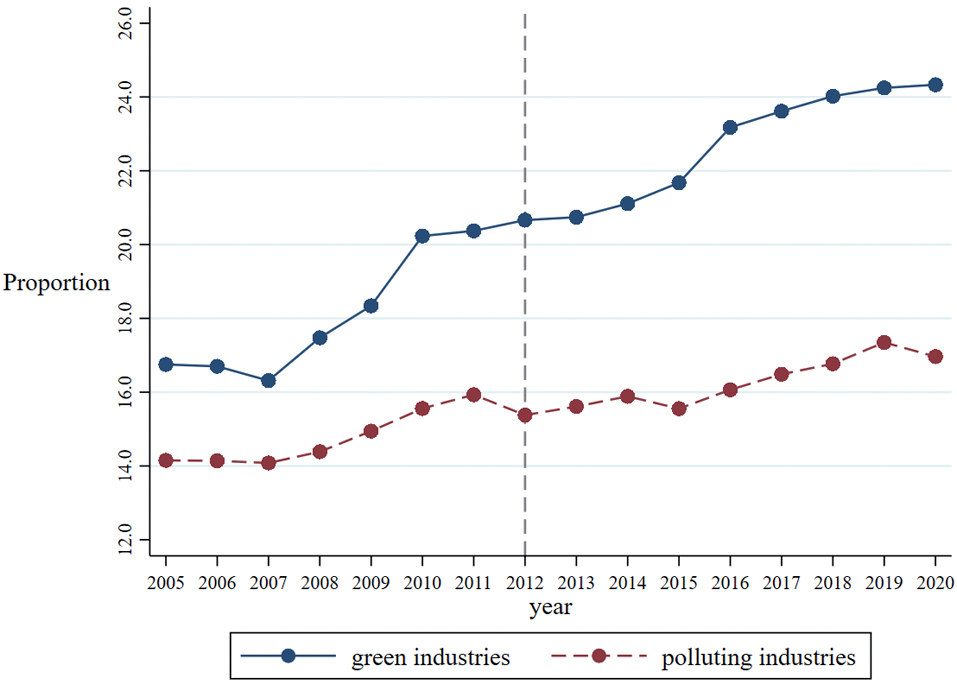
The analysis reveals that the total employment and the proportion of highly skilled employees have both passed the parallel trend test, indicating that they share a similar time trend before the policy’s introduction. Additionally, it is evident that the policy has a discernible lag effect on these variables.
Results and Discussion
Benchmark Regression
In Table 2, column (1) is the regression result based on the total labor force as the explained variable, column (2) is based on the number of highly skilled employees as the explained variable, column (3) is based on the number of lowly skilled employees as the explained variable, column (4) is based on the proportion of highly skilled employees as the explained variable. The DID coefficients in columns (1), (2) and (4) are significantly positive, indicating that the implementation of green credit has significantly promoted the employment of highly skilled in green enterprises. The coefficient of DID is insignificant in column (3), indicating that green credit has no obvious effect on enterprises to increase lowly skilled labor. For all regression results, individual fixed effects and time fixed effects are controlled.
To investigate the distinct effects of green credit across various industries, this study examines the employment patterns of enterprises before and after obtaining green credit. Moreover, it tests the variations in the levels of highly skilled and lowly skilled labor within both green and polluting industries. This approach allows for comparative analysis of the impact of green credit on different sectors. The mean T-test results in Table 3 show that after the implementation of green credit, green enterprises have absorbed more highly skilled labor than polluting enterprises, and there is a phenomenon of labor transfer from polluting industries to green industries.
In terms of the overall labor force, previous to the introduction of green credit, the number of workers in polluting industries exceeded that in green industries. However, after the implementation of green credit, employment in green enterprises has increased more than polluting industries, leading to a narrowing of the gap between the labor forces of green and polluting industries.
Table 2.
The impact of green credit on the total labor force and labor force structure.
Regarding the proportion of highly skilled personnel, before the implementation of green credit, green industries had a relatively larger share of highly skilled workers compared to polluting industries. After the introduction of green credit, the proportion of highly skilled personnel in green enterprises has experienced a greater increase compared to polluting industries, where the increase has been relatively modest.
Concerning the number of highly skilled labor, the polluting industries originally had more highly skilled labor than the green industries. However, after the implementation of green credit, the number of highly skilled labor in both green and polluting enterprises has increased. Ultimately, green enterprises eventually have more skilled labor than polluting enterprises.
In terms of the number of lowly skilled labor, originally the total number of lowly skilled labor was higher in polluting industries than in green industries. However, after the introduction of green credit, the number of lowly skilled employees in green enterprises and polluting industries have increased. Consequently, the difference in the number of lowly skilled employees between green and polluting industries has been narrowed.
Mechanism Analysis
One of the most likely explanations for firms hiring more labor after obtaining green credit is that firms will increase assets to expand production because they have good expectations for the future. Therefore, we introduce the variable of cash paid for the purchase and construction of fixed assets, intangible assets, and other long-term assets in the current year as the new capital. We divide the variable by total assets to get the proportion of new assets, which is denoted as Newasset. This variable is superior to the commonly used new fixed asset index, because enterprises will not only buy fixed assets such as machine workshops but also pay for other intangible assets such as goodwill. In particular, high-tech enterprises will invest more in intangible assets such as patent technology, rather than only purchasing fixed assets. We input Newasset as one of the variables into regression equation (10), and the regression results are shown in Table 4.
Comparing columns (1) and (2) in Table 4 with columns (1) and (2) in Table 2, it can be seen that the DID coefficient of each column has decreased but is still significant, indicating that capital is an important cause of labor force change. The Newasset coefficient is significantly positive, indicating that the capital– labor relationship is complementary. At the same time, comparing the Newasset coefficients of columns (2) and (3) in Table 4, it can be found that the Newasset coefficient is higher in column (2) than in column (3), indicating the higher complementarity of new capital and highly skilled labor.
In addition to the impact of new capital on labor, long-term loans are also a reason for labor demand and structural changes. Since the payment of labor remuneration often occurs before the enterprise obtains product sales revenue, the enterprise needs to purchase labor through the working capital formed by borrowing, especially for manufacturing enterprises. It has been shown in the previous literature that when long-term loans expire, companies pay more interest, which reduces labor employment. Therefore, when the loan interest rate of green credit is reduced, enterprises will have more long-term loans, thus reducing labor employment.
We record the long-term loans as Longdebt. Columns (4) and (5) in Table 4 are the regression results of the new capital Newasset and Longdebt as the impact mechanism. In column (4), the regression coefficient of DID to Newasset is significantly positive, indicating that after the implementation of green credit policy, new capital increases. Due to capital-skill complementarity, enterprises adjust labor demand and demand structure, so new capital is an important factor for enterprises to adjust labor demand and structure. The regression coefficient of DID to Longdebt in column (5) is significantly positive, indicating that long-term loans have increased significantly after the implementation of green policies, which is also one of the mechanisms affecting labor demand and demand structure.
Table 3.
Green credit and labor employment.
Table 4.
Analysis of influence mechanism.
Table 5.
Green credit and total labor employment in enterprises according to ownership.
Finally, the impact of green credit on the employment of enterprises and the proportion of highly skilled labor is positive; that is, the increase in capital has a greater effect on labor demand than the increase in long-term loans on labor demand. The influence mechanism of the proportion of skilled personnel and the number of labor force is consistent.
Heterogeneity Analysis
Different Ownership Enterprises
According to the type of ultimate controller, we divide all listed companies into three categories of state-owned enterprises, private enterprises, and other types of enterprises. We examine the impact of green credit on the total labor force and structure of different types of enterprises. Finally, 14357 observations of state-owned enterprises, 18756 observations of private enterprises, and 2284 observations of other types of enterprises are obtained.
The results of mean T-test analysis presented in Table 5 indicate that prior to policy implementation, state-owned enterprises had a greater number of polluting industries compared to green industries. After the introduction of green credit, there was a larger increase in the number of green industries among state-owned enterprises. As a result, there was a narrowing of the gap between the number of polluting and green industries in state-owned enterprises.
Furthermore, before the implementation of the green credit policy, there was a significantly lower total labor force in the green industries than in the polluting industries of the private sector. Following policy implementation, both green and polluting industries in the private sector experienced a increase in the number of enterprises. Consequently, there was a narrowing of the gap in labor force between green and polluting industries. A more detailed explanation of this phenomenon will be provided below.
The mean T-test in Table 6 show that before the implementation of green credit, the proportion of highly skilled labor was higher in the green industries than in polluting industries of state-owned enterprises. After the implementation of green credit, the proportion of highly skilled labor in polluting industries increased slightly, but the proportion of highly skilled labor in green industries increased greatly, further amplifying the gap. From the perspective of private enterprises, before the implementation of green credit, there is a higher proportion of highly skilled labor in green industries than in polluting industries. After the implementation of green credit, the proportion of highly skilled labor has increased significantly for green industries and increased slightly for polluting industries.
The impact of green credit policy on the total labor demand and structure differs between state-owned enterprises and private enterprises. The reason for this differential impact is that state-owned enterprises and private enterprises have different business objectives. Since state-owned enterprises do not aim at maximizing corporate profits but, to a certain extent, have a goal of “stable employment”, when green credit is implemented, state-owned green enterprises respond to policy calls for green development and absorb a large number of employees. At the same time, the dismissal cost is high for state-owned enterprises, and the number of employees is increased by adding new skilled labor while still maintaining the original labor force. However, private enterprises have the principle of prioritizing efficiency due to the goal of maximizing profits. Green enterprises will hire more highly skilled labor after obtaining green credit, and the cost of dismissal is low, which will reduce the employment of lowly skilled labor. Therefore, the proportion of highly skilled personnel has increased significantly. Another reason for this phenomenon is that state-owned enterprises have soft budget constraints. Whether they are polluting enterprises or green enterprises, their financing constraints are small. However, due to the actual financing constraints of private enterprises, green credit has a greater impact on private enterprises. In listed enterprises, the proportion of highly skilled talent in private enterprises is higher, so the personnel of private enterprises are more efficient; therefore, we suggest that in the implementation of green credit policy, the focus of attention should be tilted toward private enterprises. Combining Table 5 and Table 6, we can find that green credit also has significant impact on the total labor demand and structure of other types of enterprises.
Different Regions
We conduct regional heterogeneity analysis based on the registered address of listed companies. According to the division standard of economic zones, China can be divided into eastern region, central region, western region, and northeast region. The results of Table 7 show that before the implementation of green credit for all regions, there was a significantly higher number of employees in polluting industries than in green industries. After the implementation of green credit, the number of employees in green enterprises of the eastern, central and western regions increased significantly. The gap between the number of green industries and the number of polluting industries in these regions has narrowed. In the northeastern regions, the number of employees in polluting industries has increased significantly, but the number of employees in green industries region has hardly changed. Therefore, we can also draw the following conclusions: in the regions with higher economic development, due to the role of market regulation, green credit has a more significant effect on the transfer of labor from polluting industries to green industries. For the resource-led northeast regions, green credit has no obvious effect on the reallocation of labor resources between polluting industries and green industries.
Table 8 shows the differentiated impact of green credit on the proportion of highly skilled labor in different regions. For green industries, the proportion of highly skilled labor has increased significantly in all regions. For polluting industries, except for the increase in the central and western region, the proportion of highly skilled labor has declined in eastern and northeastern regions. This shows that compared with polluting industries, there is much greater demand for highly skilled talent in green enterprises, which also shows the important role of green credit in promoting green enterprises to absorb talent. Compared with Table 7 above, we can find some interesting conclusions. Although the number of employees in green enterprises in Northeast China has hardly unchanged, the proportion of highly skilled green enterprises has increased rapidly, and the proportion of highly skilled polluting enterprises has decreased, highlighting that green credit can allow green enterprises to reduce employee redundancy and optimize skill structure. This is consistent with the phenomenon that some highly skilled talent no longer enter traditional heavy industrial enterprises but enter green industries. When graduates return to the northeast region for employment, there is more development prospects in green industries.
Table 6.
Green credit and the proportion of skilled employees in different types of enterprises.
Table 7.
Green credit and labor employment in different regions.
Table 8.
Green credit and the proportion of highly skilled labor in different regions.
Robustness Analysis
Change the Sample Time Span
If the span is too long, this may not only cause the independent variable to be disturbed by other factors but also lead to autocorrelation, resulting in underestimating the standard deviation of the difference-in-difference estimator, with the T value being too large and resulting in easier rejection of the original hypothesis. Therefore, this paper only selects the data of 9 years – that is, the company data from 2008 to 2016 – as a sample for re-regression of the benchmark model. The model results are shown in columns (1) and (2) in Table 9. The results show that the coefficient of DID is still significantly positive, which is not much different from the original results.
Excluding the Impact of Other Policies
On January 1, 2015, the “Environmental Protection Law of the People’s Republic of China” came into effect. In order to exclude the impact of the policy, we constructed a dummy variable EPL (pre-2015, EPL = 0; post-2015, EPL = 1), which was added to the regression equation (10). At the same time, the time fixed effect was removed, and the continuous variable representing time, denoted as year, was added. The regression results are shown in columns (3) and (4) in Table 9. We find that the impact of green credit on labor structure is still significant after excluding the impact of the 2015 “Environmental Law”.
Table 9.
Robustness test.
Table 10.
PSM-DID test results.
China carried out low-carbon city pilot construction in three batches in 2010, 2012, and 2017. In order to eliminate the interference of the second batch of low-carbon city pilot policies in 2012, we deleted the second batch of low-carbon cities in the sample. The regression results are shown in columns (5) and (6) in Table 9. Compared with benchmark regression, the impact of green credit on the labor structure is basically unchanged.
Propensity Score Matching
In order to control the differences between groups that are not observable but do not change over time, in the following, PSM-DID is used to solve this endogenous problem. We use quadratic kernel matching, only using observations within the common value range for matching, and use Logit to estimate the propensity score. Table 10 shows the difference results after matching. The results show that this is basically consistent with the conclusion of benchmark regression.
Conclusions
This study investigated the impact of green credit on the employment in polluting and green enterprises. It was found that, after the implementation of the green credit policy, the number of employees in emerging green industries has risen sharply than that in polluting industries, and the proportion of highly skilled workers in green industries has increased faster than the proportion of highly skilled workers in polluting industries. The reason for this phenomenon is that green credit increases the new capital of enterprises. Due to capital–skill complementarity, that is, because there is stronger complementarity of capital with highly skilled labor than that with lowly skilled labor, green enterprises have increased employment of labor, especially of highly skilled labor. In addition, state-owned enterprises and private enterprises exhibit large differences in decision making. After obtaining green credit, state-owned enterprises tend to hire more labor, while private enterprises will focus on optimizing the labor structure and absorbing more highly skilled labor. Regional heterogeneity is observed, namely that in the northeastern regions with more natural resources and industrial bases, green credit plays a greater role in improving the proportion of skills, rather than the number of employees. The above conclusions show that green credit has led to the reallocation of labor between polluting industries and green industries, which is an important measure for increasing labor demand and improving the labor structure in low-carbon transformation.
Under the background of double carbon strategy, promoting the development of green finance is an important measure for stabilizing and expanding employment. To this end, we propose the following policy recommendations: First, commercial banks should be encouraged to provide strong support to green private enterprises, especially in the western and northeastern regions. Although green state-owned enterprises play an important role in stabilizing and expanding employment, green private enterprises play an important role in alleviating the employment pressure brought by college enrollment expansion. It is of great significance to effectively solve the financing constraints of private green enterprises and provide resource-based regions with green credit. Secondly, in the process of social low-carbon transformation, because more skills are needed in green industries, workers with lower abilities may face structural unemployment, so green industry enterprises should take the initiative to lower the skill threshold and provide training for the necessary skills. The government should also invest in retraining and upgrading the skills of workers, which is crucial for achieving green transformation and seeking new economic growth points. Finally, when the labor force flows from polluting industries to green industries, there may be frictional unemployment. The government should formulate relevant policies to ensure the basic livelihood of such groups during employment transition and reduce the impact of unemployment. At the same time, various policies should be actively implemented, giving full play to the substantive promotion effect of green credit and avoiding the emergence of “greenwashing” behavior.

