

Introduction
Methylene blue dye (MB) is a synthetic cationic pigment, generally known as a basic pigment, and is extensively used in the manufacture of textiles and as an indicator in certain chemical processes [1, 2]. MB pigment is also used in the dyeing of acrylic, wool, silk, and nylon, as well as in the coloring of textiles, leather, and paper [3-5]. As a basic dye, MB is soluble in water, highly chromatic, its bio-degradation is very poor, and it has a great negative impact on the water microorganism’s photosynthesis [4, 6]. Moreover, it has been previously reported that the consumption or use of MB solutions can result in tachycardia, cyanosis, convulsions, irritation of the skin, methemoglobinemia, nausea, dyspnea, diarrhea, and vomiting [7, 8]. Therefore, several techniques, like oxidation by the chemical oxidants [9], membrane filtering [10, 11], coagulation [12], photocatalytic degradation [13-15], and flocculation [16], have been used for the remediation of the industry wastewaters from MB and other chemical contaminants. These methods are complex, non-economic, have low effectiveness, and generate huge quantities of sludge [17]. Thus, it is very important to seek another simple and effective method for treating sewage that contains chemical pollutants. The technique of adsorption was recognized as the best economic, most effective, and simplest method for treating sewage from contaminants [8].
The most common adsorbent used to eliminate pollutants from solutions is activated carbon (AC), due to its high adsorptive efficacy. AC was used for eliminating MB [18-20], 4-nitrophenol [21], acid red dye [22], and other substances from solutions. The main drawbacks of utilizing AC, despite its higher adsorptive performance, are its poor regeneration efficiency, the expensive cost of its production, and the difficulties of separating it from the solution after usage [23].
Therefore, several efforts have been achieved to study the proficiency of the nanoparticles (NPS) of some metallic oxides or sulfides like NiO and CuO [24, 25], CuO [26], NiO [27], CuS [28], and TiO2 [29] for water pollutants adsorption. The primary weaknesses of using these NPS in the remediation of contaminated waters are their expensive cost and low yield during their manufacturing.
Thus, other industrial, agricultural, and natural solid wastes such as coconut [30], Dacryodes edulis seeds [31], egg shell [32], palm oil fuel ash [33, 34], nitraria retusa leaf powder [35, 36], Neem leaf powder [37, 38], Ocimum basilicum leaf powder [39, 40], modified Lamiaceae leaves [41], Teucrium polium .L [42, 43], and powdered Foeniculum vulgare seeds [44] were used as cheap adsorbents to eliminate some selected organic and inorganic dyes like MB, Cong red, potassium permanganate and other from water. According to the findings of these research studies, the adsorption effectiveness of these inexpensive adsorbents varies significantly. So, it has become imperative to hunt for more affordable and efficient adsorbents in order to increase the adsorption technique’s efficiency.
One kind of polium is Teucrium polium. L (TPL), commonly recognized as germander, is an herb that was used for the first time in traditional remedies more than 2000 years ago because of its potential to lower high blood pressure as well as its carminative, antifungal, antispasmodic, anti-inflammatory, and antipyretic properties [45]. TPL blooms from June to August and belongs to the Lamiaceae family, which has over 300 distinct species. These herbs are abundant in the mountains and hills of the world and have a high level of flavonoids [46, 47].
TPL was applied to produce the nanoparticles of ferric oxide, which were used as an adsorbent for arsenic (As) adsorption [48] and in the photocatalytic degradation of methyl orange [49].
In my earlier works, this herb was also chemically modified and utilized for the first time as a new and affordable adsorbent for Congo red adsorption [42] and potassium permanganate (KMnO4) [43]. The abundance of this herb in the mountains and hills of the world in huge quantities, its cheapness, and its high adsorption capabilities towards CR and KMnO4 suggest that it is imperative to test the performance of these modified herb seeds against other dyes. So, the primary goal of this investigation was to examine the modified TPL’s ability to adsorb MB.
The herb of TPL was chemically modified, and its surface properties were characterized. The influences of the most significant factors were examined. The constants of the adsorption kinetics, thermodynamics, and isotherms were also estimated.
Methodology
Collection of Plant Material and Preparation of Adsorbents
We confirm that all methods were performed in accordance with the regulation of the University of Tabuk, Saudi Arabia. TPL leaves of TPL were purchased from a medicinal plant market in the city of Tabuk, KSA. These leaves underwent three distilled water rinses before being dried overnight in an oven, pulverized into powder, and then named S1. At the boiling point, 500 mL of oxalic acid solution (25% w/w) was refluxed with 50 g of S1. After 90 min of boiling, the mixture was then cooled to lab temperature. The solid component of this mixture was separated using a vacuum bump connected to a Buchner funnel, then repeatedly washed by distilled water and dehydrated in an oven for 15 h at 393 K. To get adsorbent with homogeneous particles, the dehydrated solid was milled and sieved, and then given the designation S2.
The third adsorbent sample (S3) was prepared by refluxing 50 g of S1 with a solution of ZnCl2 (500 mL and 25% w/w) at the point of boiling for 90 min. The mixture’s components were separated by filtering after cooling to lab temperature, and the residual solid was rinsed once with 150 mL of the hot HCl solution (1M) and multiple times in distilled water. After that, the solid was desiccated in an oven for 15 h at 393 K, milled, and sieved to get an adsorbent with identical particle sizes. The same processes and conditions used to prepare S3 were used to prepare S4 by refluxing the same mass of S1 (50 g) with 25 g of CuS and 500 mL of ZnCl2 solution (25% w/w).
Identifying the Adsorbents Properties
The charge, area, porosity, and functional groups of the adsorbents’ surfaces all have a substantial influence on adsorption. Thus, the porosity and surface area of each adsorbent were measured using the BET surface analysis technique (NOVA-2200 Ver. 6.11) at -195.65ºC for 22 h. Thermo Scientific FT-IR Nicolet IR’s iS5 equipment was also utilized to detect the surface functional groups of these adsorbents. Furthermore, a SEM instrument operating at a voltage of 10 kV was used to specify the shape of the adsorbent’s surface.
The method of Ahmed and Theydan was also used to calculate the pHzpc of the perfect adsorbent (the pH where the adsorbent surface is electrically neutral).
Adsorption Experimentations
Specifying the Optimal Sample
To determine the best adsorbent among the four prepared in this study, 35 mL of 130 mg/L MB solution was mixed with 0.035 g of S1 in a 50 mL amber glass bottle. The bottle was closed and stirred by a thermal shaker for 12 h at 145 rpm and 300 K. The mixture was then filtered, and the spectrophotometer of the UV-Vis (Jenway, 6800) was utilized to quantify the non-adsorbed MB concentration in the filtrate at a wavelength of 617 nm. The same steps and procedures were also performed for S2, S3, and S4. The percentages of MB removed from solutions (% R) due to its adsorption on these adsorbents were computed from Equation (1).
C0: MB initial concentration, Ce: final concentration of MB.
Impact of the Experimental Circumstances
Adsorbent Dose
To specify the S2 mass needed to conduct the other adsorption tests planned in this work, the effect of the S2 dose must be investigated. Therefore, 35 mL of MB solutions (50 mg/L) were individually put into amber glass bottles holding varying masses of S2 (0.005-0.045 g), and the bottles were then sealed and stirred by a shaker for 12 h at 145 rpm and 300 K. The non-adsorbed MB concentration of each of these solutions was then determined using a spectrophotometer for the UV-Vis, as indicated in Section 2.3.1, after S2 had been separated from each solution by filtration. The percentages of MB eliminated by each one of the S2 masses were computed via Equation (1) and plotted against the rising mass of S2.
pH of Solution
To test the impact of pH on MB adsorption by S2, a pH-meter, 2M of NaOH solution, and 2M of HCl solution were used to prepare solutions of MB (50 mL) with a concentration of 400 mg/L and varied pH values between 2 and 12. The adsorption of 35 mL of each solution on 0.035 g of S2 was then carried out using the same procedures and conditions as in Section 2.3.2.1. The MB quantity adsorbed at equilibrium (qe) was then estimated from Equation (2), and the resultant values were plotted against pH.
m (g): mass of S2, V (L): MB solution volume.
Kinetic Experiments
In this part, the same experimental procedures, equipment, and circumstances used in Section 2.3.1 were also used for the adsorption of 80, 130, and 200 mg/L MB dye solutions on 0.035 g of the adsorbent S2 at twelve different period times ranging from 3 to 420 min. The quantity of MB adsorbed at each of these periods (qt) was estimated from Equation (3) and graphed against t (time of adsorption) to test the influence of time on this adsorption.
The OriginPro 2018 program was used to analyze the collected experimental results of this section using the nonlinear kinetic Equations (4-6) for the 1st order (FO), 2nd order (SO), and particle diffusion (PD), respectively.
qe1.cal and qe2.cal are the theoretical equilibrium capacities of adsorption determined from the kinetic models of SFO and SSO, respectively. K1, K2, and Kdif are the FR, SO, and PD rate constants, correspondingly. C is an additional variable associated with the boundary layer width.
To specify the best model that fits the trial data of this adsorption, the value of a chi-square (χ2) was estimated from Equation (7) for each of these three models.
where, n is the number of the experimental data observed.
Equilibrium Experiments
The equilibrium experiments were conducted at 300, 315, and 330 K for 12 h with 11 solutions of 0.035 g of S2 in 35 mL of an aqueous solution of various MB concentrations ranging from 15 to 1400 mg/L. After filtration, a spectrophotometer for the UV-Vis at a wavelength of 617 nm was applied for measuring the non-adsorbed MB concentration of each of these solutions. The adsorption quantities at equilibrium (qe) were estimated from Equation (2), and to test the temperature and dye concentration influences on this adsorption, the qe values were plotted via the MB concentration for each temperature.
To understand the nature of this adsorption (adsorption mechanism, properties of the S2 surface), the obtained equilibrium data were also analyzed by the OriginPro 2018 program and the non-linear isotherm models of Langmuir (LIM) Equation (8), Freundlich (FIM) Equation (9), and Temkin (TIM) Equation (10).
qmax: The adsorption maximum capacity (mg/g), KT, KL, KF: The constants of TIM, LIM, and FIM, respectively. B and n are other variables associated with adsorption heat and intensity, correspondingly.
To designate the isotherm model which better fits the equilibrium experimental data of this adsorption, the value of a chi-square (χ2) was also estimated from Equation (7) for each of these three models.
The KC values (KC = qe/Ce) were calculated for the adsorption of 35 mL of 30, 80, 130, and 200 mg/L MB solutions on 0.035 g of S2 at 300, 315, and 330 K. The lnKC values were then plotted against 1/T Equation (11) to assess the constants of this adsorption thermodynamic, like ∆Ho and ∆So, which were used for assessing ∆Go values using Equation (12).
R and T stand for the universal gas constant (8.314 J/K mol) and the temperature (K), respectively.
Results and Discussion
Adsorbents Properties
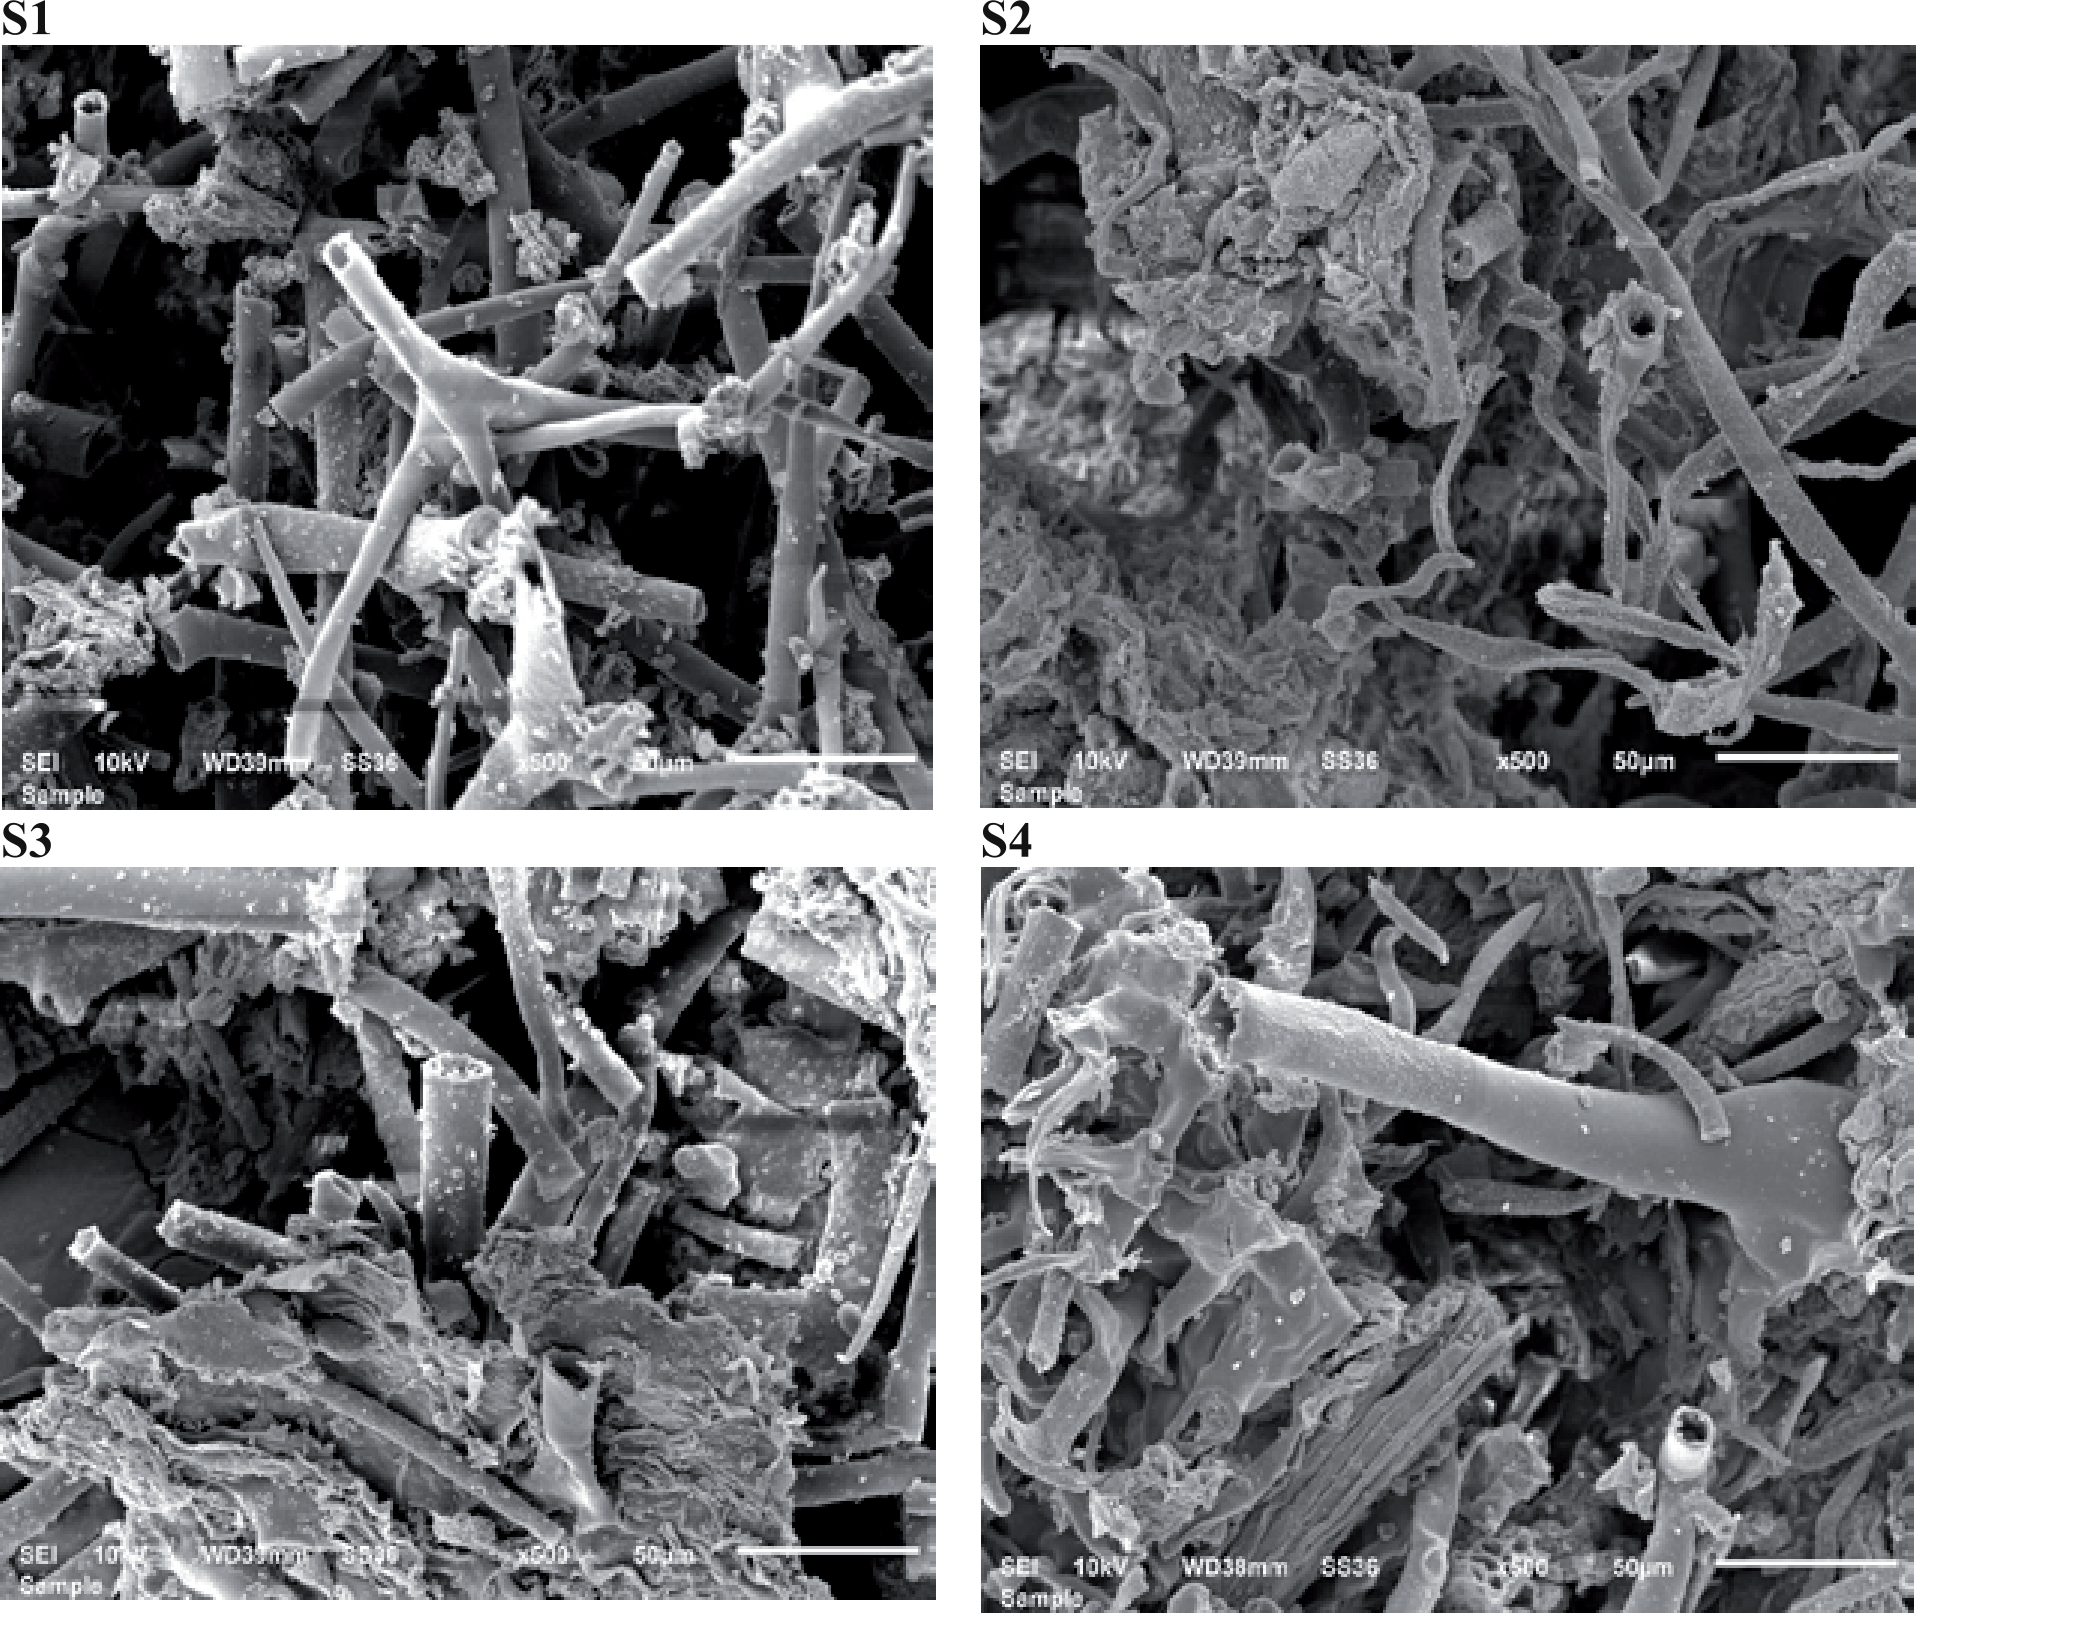
The adsorbent microstructures (spectra of SEM) from our previous studies were displayed in Fig. 1. [42, 43]. It is obvious from comparing the four photos of this figure that the chemicals utilized in this study as modification agents, especially H2C2O4, have a considerable impact on the pleats and structures of the TPL raw. After modification, most of the structures and pleats of the TPL raw were crumbled, broken, and converted to fine particles that were agglomerated together in relatively large masses. The adsorbents’ surface area and porosity will then increase as a result of the conversion of the TPL’s structures and pleats to tiny particles.
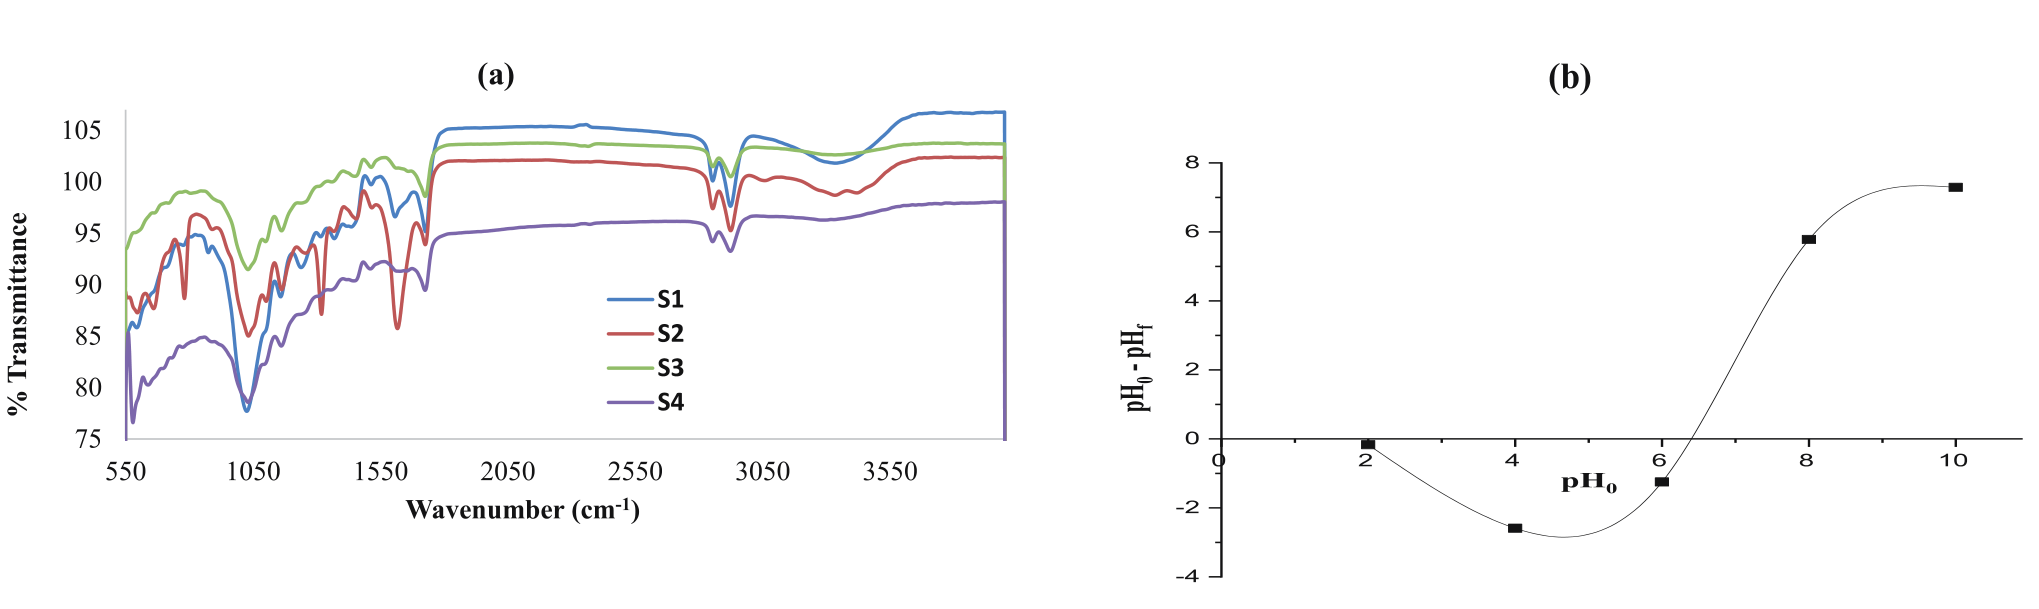
The FT-IR outcomes of the adsorbents from our earlier studies [42, 43] are revealed in Fig. 2a). For S1 (the unaltered sample), seven bands can be seen at 3335.930, 2923.910, 2854.170, 1727.260, 1513.560, 1158.350, and 1025.460 cm ̶1 (Fig. 2a). These bands can be explained by stretching of O–H, C–H (alkyl), C–H, C=O, N–H (secondary amide), C–O, and C–H (in plane), respectively. For S2, S3, and S4 (modified samples), the same seven bands can also be seen but with slight variation. Moreover, Fig. 2 shows that sample S2 (TPL modified by H2C2O4) has four extra new bands at 780.670, 1318.540, 1454.890, and 1616.920 cm ̶1, which are respectively attributed to the bending of C–H out of plane, C–O stretching, scissoring of C–H, and N–H (primary amide) stretching. This proves that MB will be significantly adsorbed by S2 due to the containment of this adsorbent for these new functional groups, specifically the N–H (primary amide) group.
Table 1 summarizes the outcomes of the BET surface analysis, which show that the porosity and surface area of the S2>S3>S4>S1. These findings reveal that the three chemicals (CuS, H2C2O4, and ZnCl2), particularly H2C2O4 and ZnCl2, considerably improved the surface physical properties of TPL.
The pH0 values were plotted vis pH0–pHf values (Fig. 2b) to specify the pH at which the surface charge of S2 would be neutral (pHzpc). This graph shows that 6.5 is the pHzpc of S2.
Adsorption
The Optimal Sample
Fig. 3a) displays the percentages of MB removed from solutions (% R) as a result of its adsorption on the adsorbents produced in this work. This graph reveals that the sample of S2 has the highest %R value (97.63%). This may be due to the existence of the four additional functional groups on the S2 surface (Fig. 2) as well as the high surface area and large porosity of S2 surface (Table 1) (section 3.1). Thus, the sample of S2 was chosen as the optimal adsorbent for carrying out the other tests of this work.
Impact of S2 Dosage
The impact of the S2 mass on this adsorption is exhibited in Fig. 3b). As demonstrated, the value of % R gradually augmented as the S2 mass rose from 0.005 to 0.035 g. This was as a result of an increase in the effective adsorption sites, which are typically increased by increasing the adsorbent mass [50]. Fig. 3b) further shows that when the S2 mass is elevated over 0.035 g, the %R is invariable. Because elevating the S2 mass over 0.035 g will result in an S2 particle cluster forming, which prevents the adsorption [51]. Thus, 0.035 g of this adsorbent (S2) was applied as the perfect mass for carrying out the other experiments in this study.
pH Effects
The adsorption is greatly influenced by pH, as the ionization process of any adsorbate and the type of charges on the adsorbent surface are contingent on the pH solution [52]. For instance, the adsorbent surface charge will be +ve, zero, or -ve at pH<adsorbent pHzpc, pH = adsorbent pHzpc, and pH>adsorbent pHzpc, respectively [52]. Thus, the impact of this component was inspected in this work, and the obtained outcomes were proved in Fig. 3c). As seen in Fig. 3c), when the pH was raised from 2 to 6, the qe of the MB uptake increased slightly. When the pH rose between 2 and 6, there was a tiny decrease in the number of +ve charges on the S2 surface (pHzpc = 6.5). Therefore, the repulsion force between MB cations (pka = 3.8) and the +ve charge of S2 will be lightly reduced, which will result in a tiny raising in the qe. While, when the pH rose above 6.5, the surface of S2 became negatively charged and strongly attracted the MB cations, which led to the abrupt increment in qe (Fig. 3c). Several adsorbents have shown a similar pattern of MB uptake [36, 38, 39, 41].
Kinetic
Influence of Time
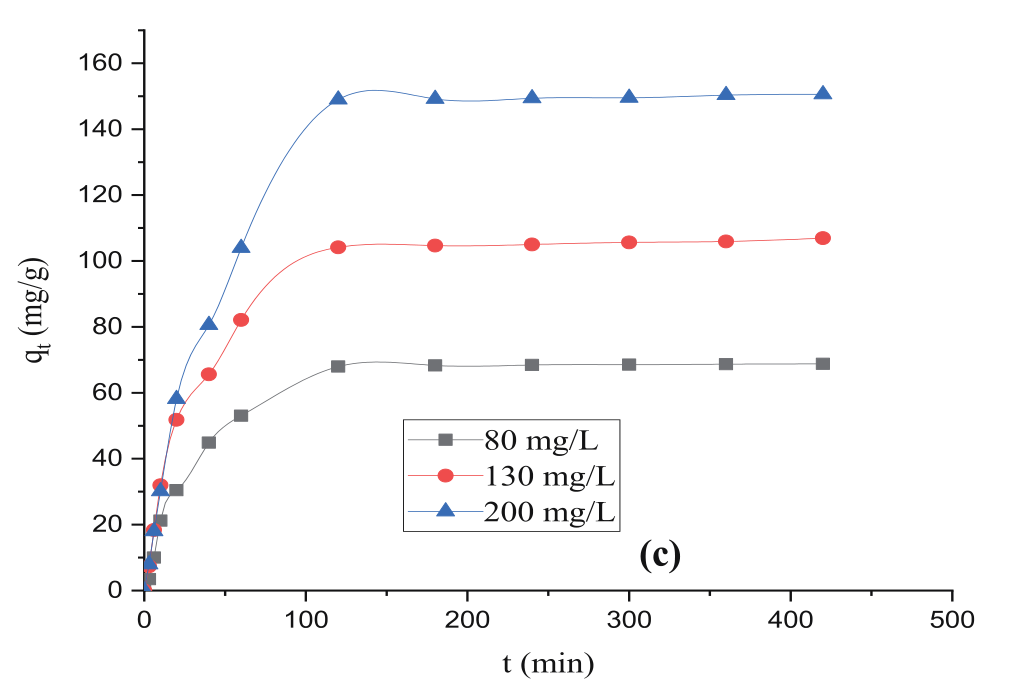
The correlation between the adsorption extent (qt) and time (t) is illustrated in Fig. 4. This graph reveals that the extent of MB adsorbed by S2 for each concentration was initially augmented rapidly (0-40 min) and then gradually (40-120 min) until it reached equilibrium at 2 h. The speedy adsorption was due to the fact that the adsorption sites were vacant of MB cations at the beginning, but after the uptake of some MB cations, these adsorbed cations will inhibit the uptake of any other additional MB cations, causing the gradual augmenting of adsorption as observed in Fig. 4. Although 2 h is the equilibrium period of this adsorption, the remaining tests in this study were conducted at 12 h to confirm saturation at equilibrium.
Kinetic Variables
The mechanism of adsorption is critically determined by the parameters of the linear or nonlinear kinetic models. It was found that the nonlinear models’ parameter values were more precise than those of the linear models [53]. Therefore, the OriginPro 2018 program and nonlinear kinetic equations were used to analyze the experimental data gathered for this investigation.
Fig. 5(a, b, c) for the nonlinear models of 1st order, 2nd order, and particle diffusion, respectively, show the correlations between time and the actual and calculated values of qt (qt.exp and qt.cal).
The error functions (χ2) values for each model are listed in Table 2, along with the values of the kinetic variables that were obtained from the nonlinear modeling data of this adsorption.
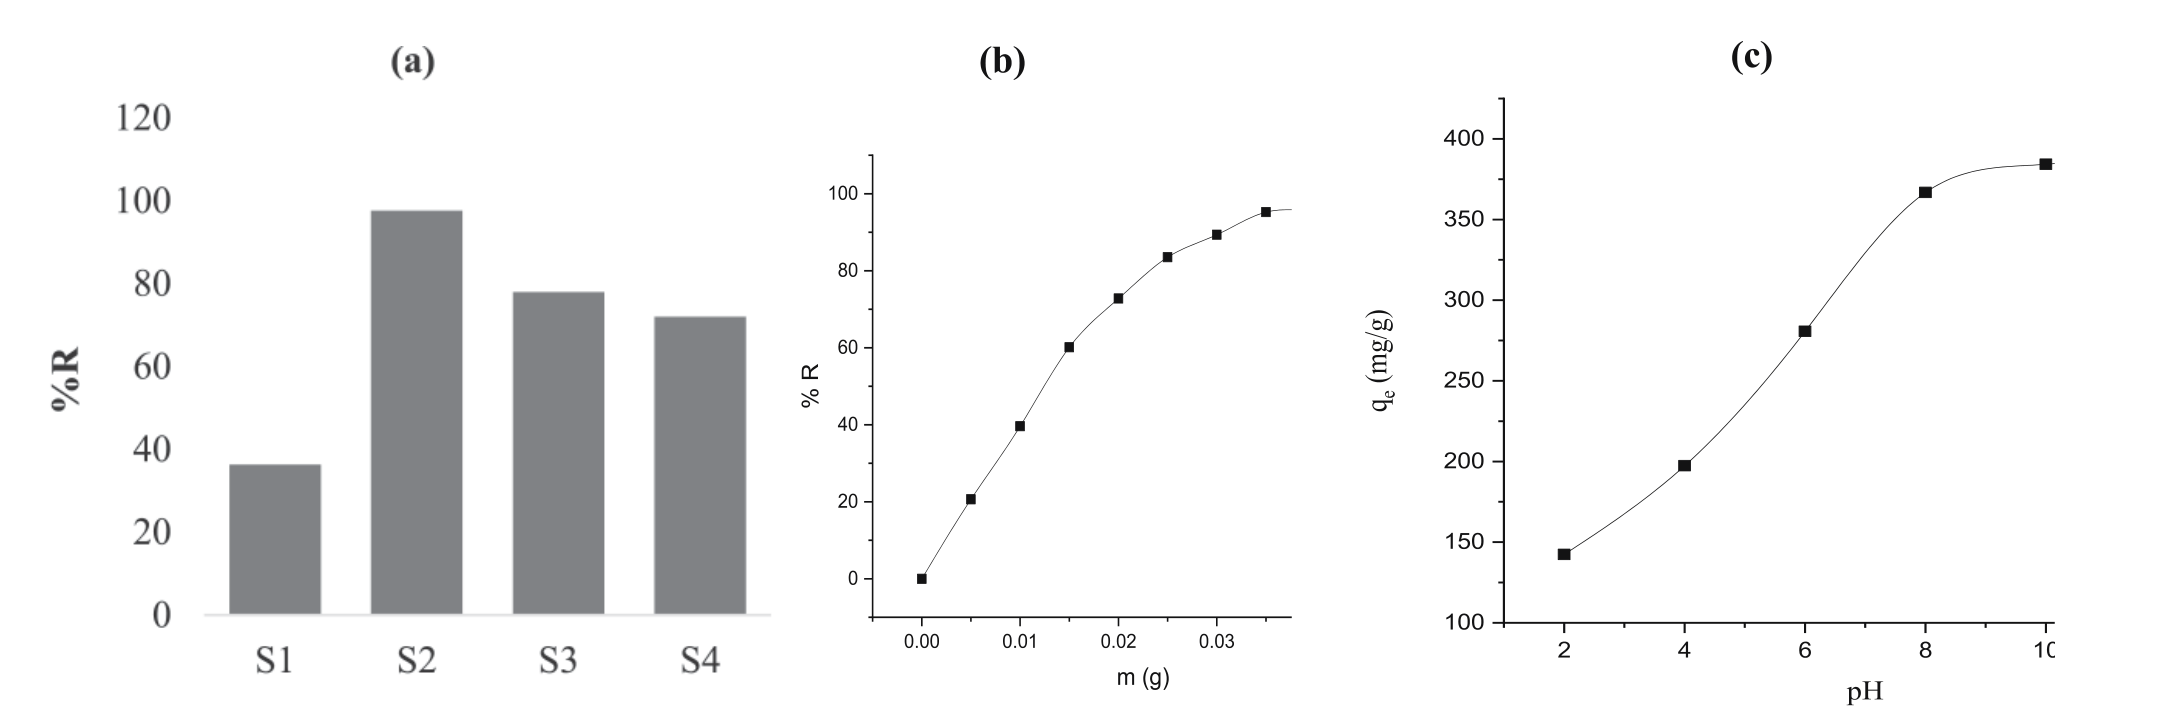
Table 2.
Surface analysis outcomes of adsorbents.
Fig. 5(a, b), as well as Table 2, show that the experimental qe values (qe.exp) are significantly different from those derived from the nonlinear model of the 2nd order (qe2.cal) and nearly equivalent to the qe calculated from the 1st-order (qe1.cal). Moreover, in comparison to the 2nd-order model, the 1st-order’s nonlinear model has greater R2 values and lower χ2 values (Table 2). These findings critically suggest that this adsorption suitably follows the first order’s kinetic model [54], which designates that the MB cations adsorption on S2 is a physisorption process.
Fig. 5.
Kinetic non-linear models of the 1st-order a), 2nd-order b), and particle diffusion c) for MB uptake on S2 (temperature = 300 K, C0 = 80, 130, 200 mg/L, S2 mass = 0.035 g, and time = 0-420 min).
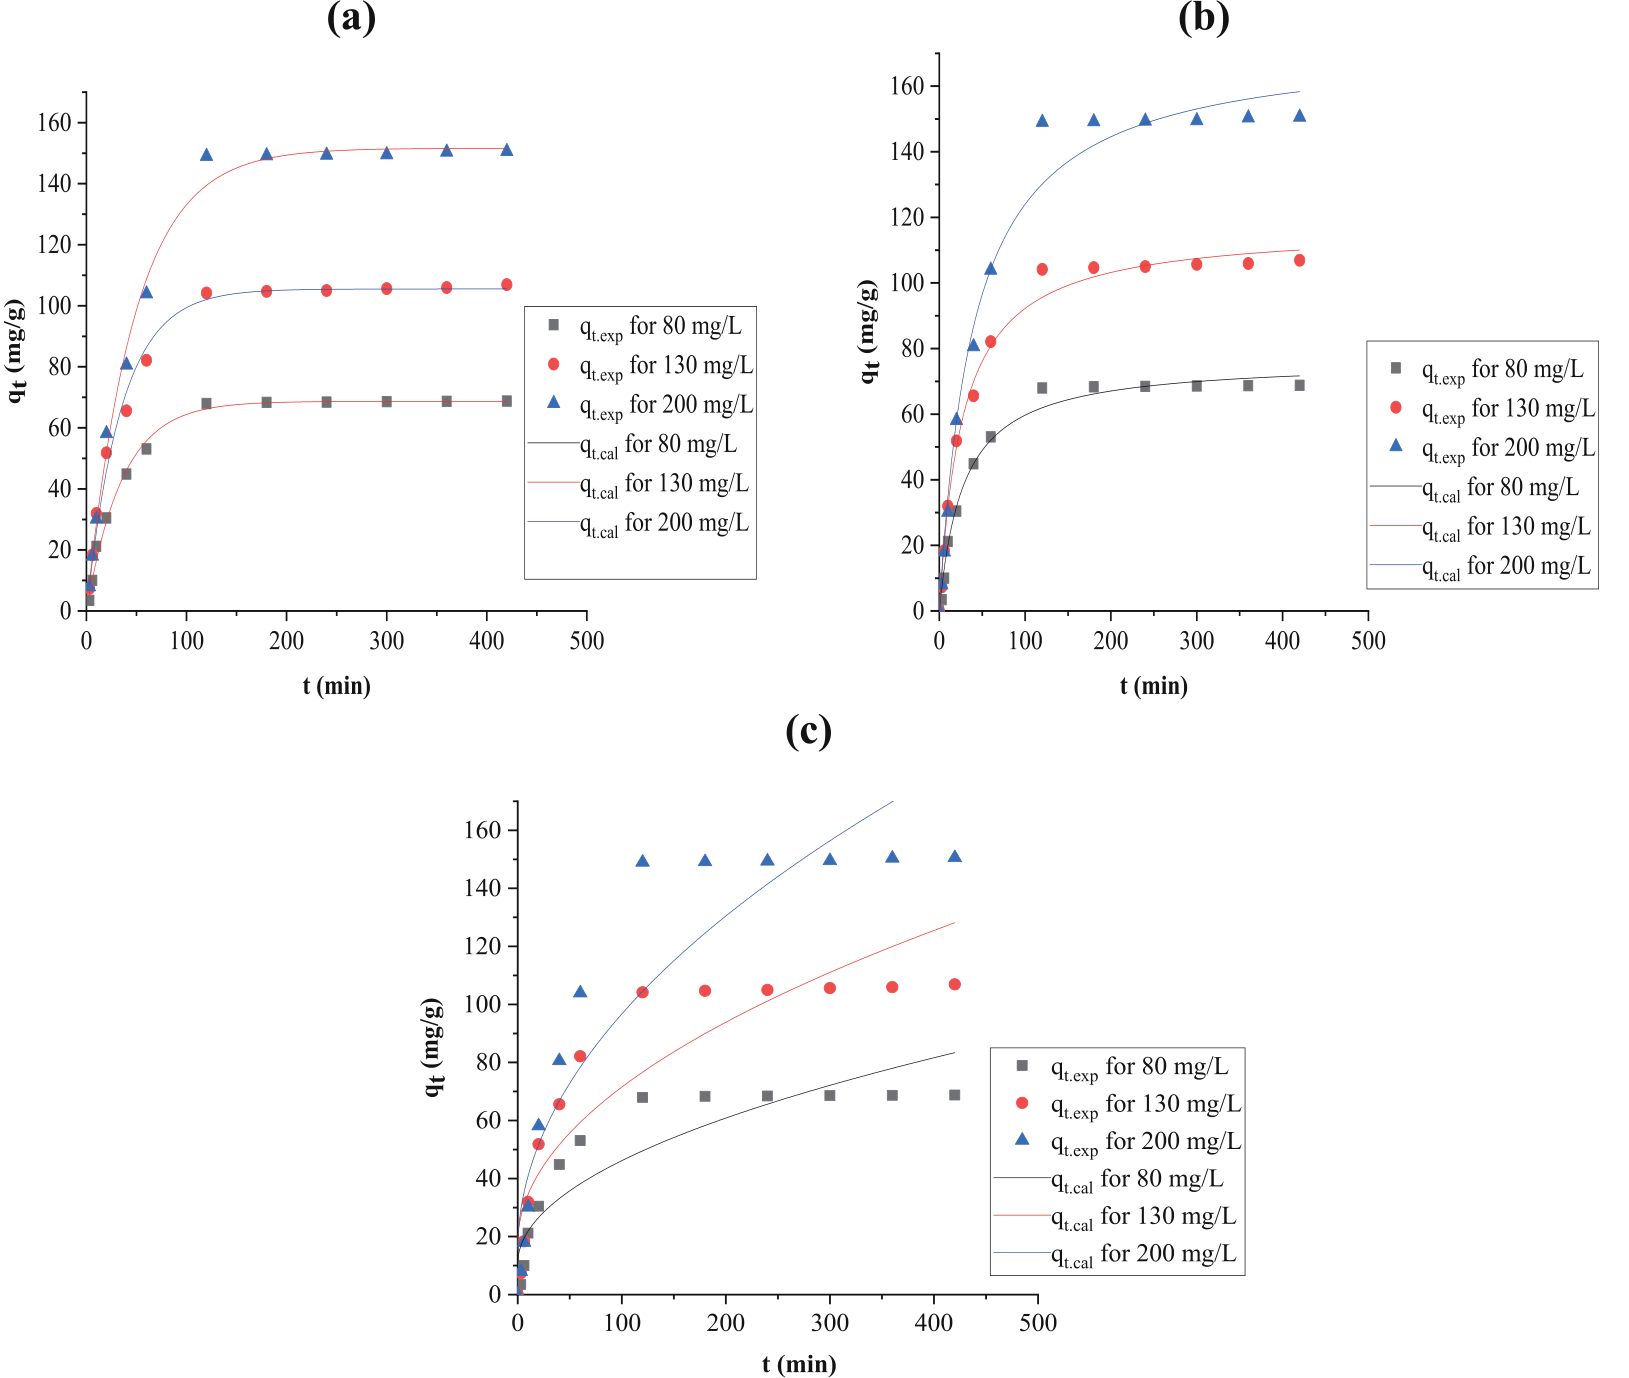
The non-involvement of particle diffusion in this adsorption and the fact that this is not the limiting step for adsorption rate are both confirmed by the nonlinear plots in Fig. 5c) that also do not pass through the origin point, the low R2 values, and the high values of χ2 (Table 2) [55].
Equilibrium Outcomes
Temperature and Concentration Affect
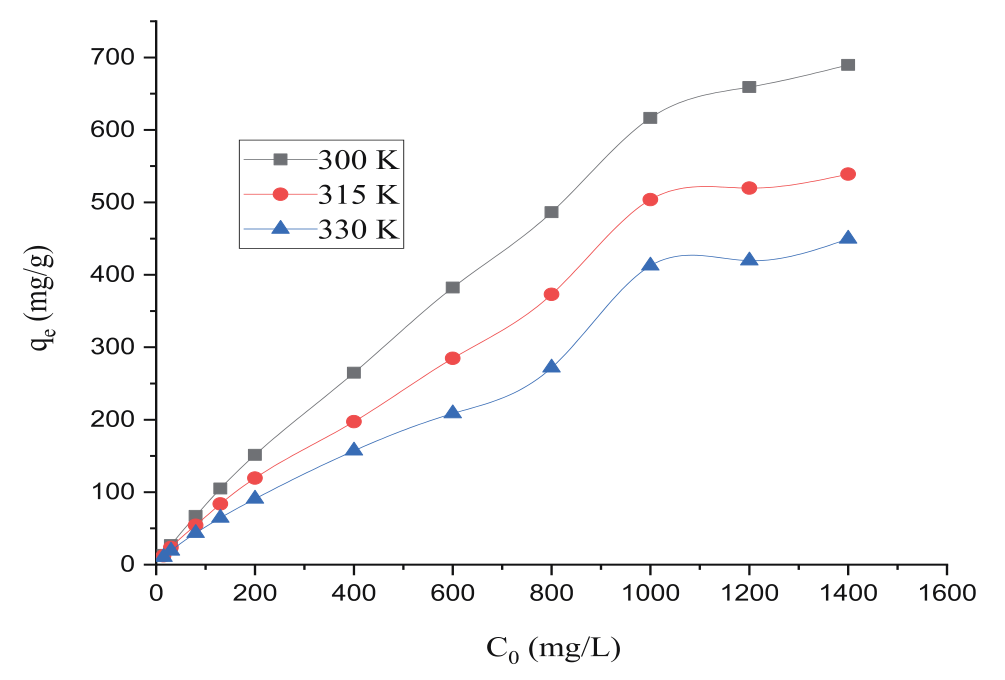
Fig. 6 represents the correlation between the extent of MB adsorbed (qe) and the concentration of MB solution at 300, 315, and 330 K. As revealed in this figure, qe has been reduced from 689.69 mg/g to 449.66 mg/g by elevating the temperature from 300 to 330 K, providing critical evidence that MB adsorption by S2 is an exothermic process [25]. This can be interpreted by the fact that when the temperature rose, the forces by which the cations of MB were attached to the surface of S2 decreased and MB solubility increased [25].
Fig. 6 also shows that qe steadily rose with increases in MB concentration and then the qe stabilized at MB concentrations of over 1000 mg/L. This can be interpreted by the fact that as the concentration of MB increases, the forces preventing MB cations from transferring from the medium of its solution to the surface solid of S2 decrease, but at the high concentrations of MB (over 1000 mg/L), all the adsorption sites will be saturated and are unable to take in any more cations [56]. Similar outcomes were observed for MB uptake by the chemically modified powder of the Ocimum basilicum leaf [39].
Isotherm Variables
Although the linearized isotherm models are extensively used for the analysis of the adsorption equilibrium data, many researchers state that the analysis results obtained by using these models are not accurate and give a significant error between the experimental and estimated data [57, 58]. Therefore, the equilibrium data of this adsorption were analyzed only by the nonlinear isotherm models of Langmuir, Freundlich, and Temkin, and using the linearized isotherm was avoided in order to reduce the distribution of error between the experimental and calculated results. The diagrams of the nonlinear isotherms for MB adsorption by S2 were represented in Fig. 7(a, b, c) for Langmuir, Freundlich, and Temkin, respectively. The isotherm coefficients, which were obtained from the nonlinear modeling data of this adsorption, are potted together with the values of the error functions (χ2) in Table 2.
Fig. 6.
Effects of temperature and MB concentration on the MB uptake on S2 (temperature = 300, 315, and 330 K, C0 = 15-1400 mg/L, S2 mass = 0.035 g, and time = 12 h).
In comparison between the diagrams of (a), (b), and (c) in Fig. 7, it will be seen that the qe.cal values are nearer to the values of qe.exp in the case of the Freundlich model (diagram (b)) than those of Langmuir (diagram (a)) and Temkin (diagram (c)). The highest R2 values and the lowest values of χ2 are also found in the case of the Freundlich nonlinear model (Table 2). These outcomes strongly confirm that this adsorption suitably follows the Freundlich model [54], predicting that this adsorption is a multi-layer process and the surface of S2 is heterogeneous. Based on the Langmuir nonlinear model (Table 2), S2 can adsorb up to 1055.88 mg/g of MB at 300 K.
Table 2 also shows that all the 1/n values are higher than zero and less than unity, which suggests that the cations of MB could be adsorbed easily by S2 [59].
Thermodynamic Variables
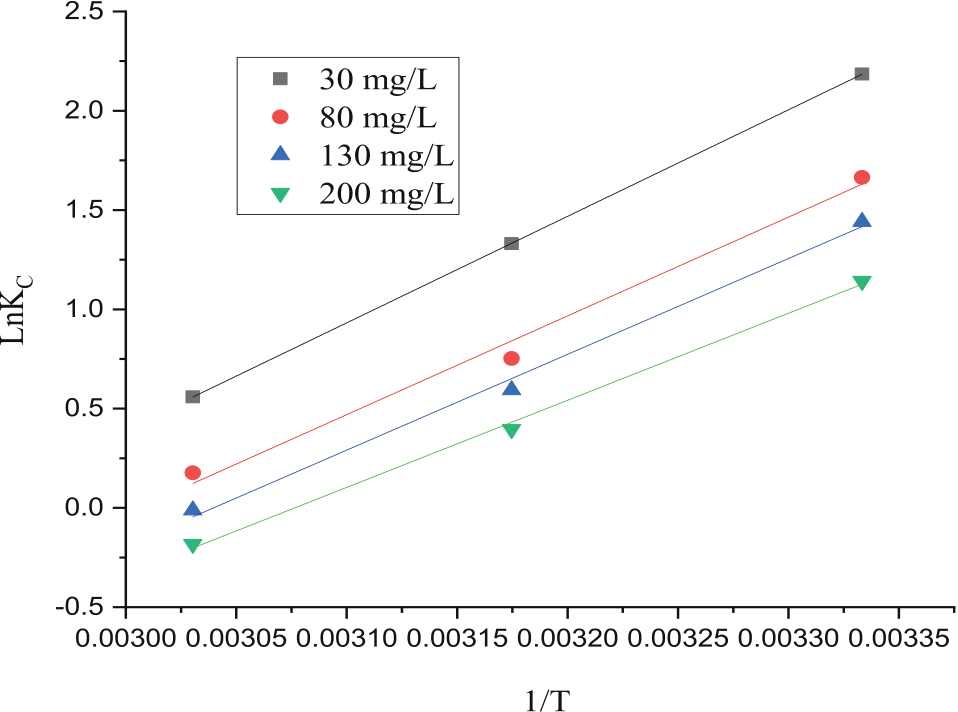
Fig. 8 represents the thermodynamic diagrams of this adsorption, and Table 2 lists the constants of this adsorption’s thermodynamics. The high linearity of the thermodynamic diagrams seen in Fig. 8 and the high R2 values (Table 2) prove the high confidence level of the values of the thermodynamic constants estimated in this work.
The values of ∆H⁰ (-44.6079, -40.9348, -39.9288, and -36.3937 kJ/mol) (Table 2) are negative, >30 kJ/mol and <80 kJ/mol, indicating that cations of MB were exothermally adsorbed on the surface of S2 by the coordination exchange mechanism of the physical adsorption [60]. This significantly agrees with the findings of the kinetic section, where both confirm the physical adsorption of MB by S2. This proves the ability to reuse and the high regeneration effectiveness of S2 synthesized and used in this work, since the cations of MB were adsorbed on the surface of S2 by weak bonds and can easily be de-adsorbed from this adsorbent.
Fig. 7.
Isotherm non-linear models of the Langmuir. a) Freundlich; b) Temkin; c) for MB uptake on S2 (temperature = 300, 315, and 330 K, C0 = 15 – 1400 mg/L, S2 mass = 0.035 g, and time = 12h).
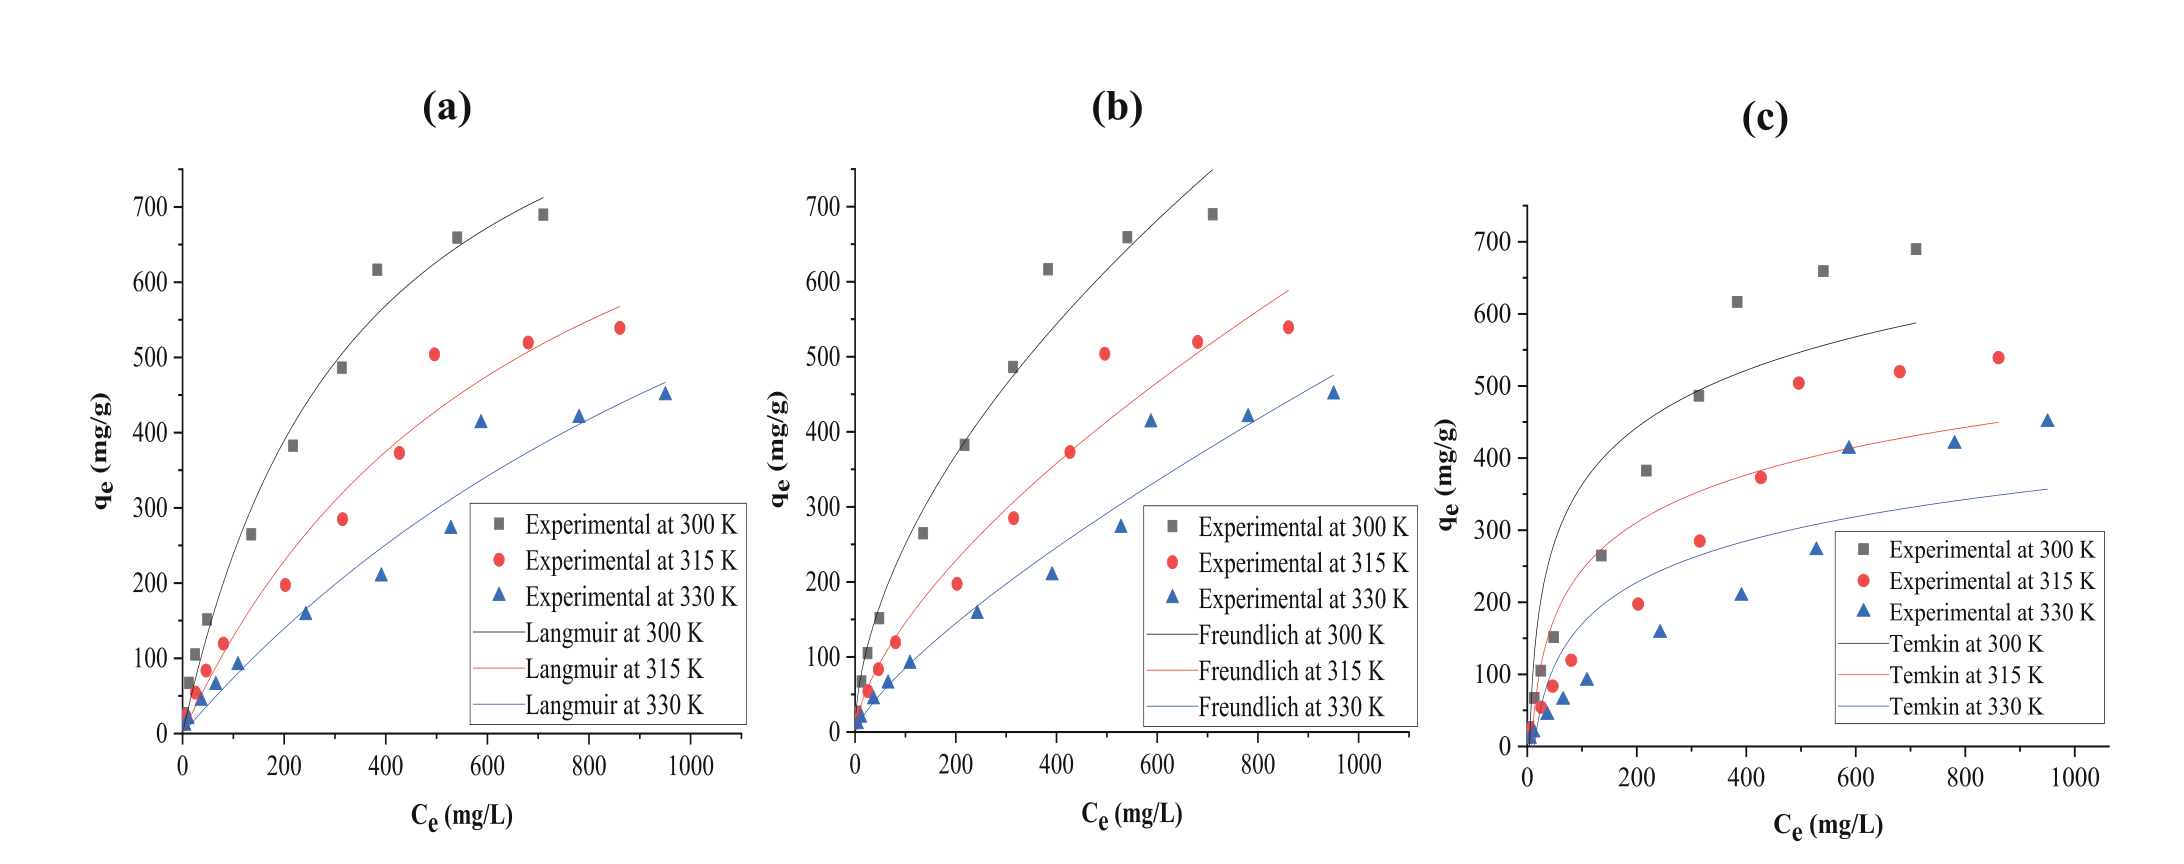
Table 3.
Adsorption efficiency of MB using several inexpensive adsorbents.
The values of ∆S⁰ (Table 2) are also negative and considerably lower than the values of ∆H⁰, proving that ∆H⁰ controls this adsorption’s driving force more than ∆S⁰ [61, 62].
The negative ∆G⁰ values (Table 2) prove the spontaneity and feasibility of MB adsorption on S2 [63]. Whereas, the drop in ∆G⁰ magnitude with increasing temperature and MB concentration, as seen in Table 2, indicates that the Gibbs free energy was raised as a result of this adsorption [63].
The same thermodynamic findings were noted for MB adsorption by nanoparticles of TiO2 [29].
Comparison Study
Table 3 includes the mass of MB adsorbed per 1 g (qmax) of S2 (the adsorbent prepared in this study) and the mass of MB adsorbed per 1 g of the other low-priced natural materials that have previously been used as adsorbents for eliminating MB from solutions. The results listed in this table critically confirm that S2 is the best adsorbent that has been used till now, indicating that S2 will gain a significant amount of interest in the area of water purification.
Conclusions
This study involved the powdering of Teucrium polium leaves and their individual treatment with solutions of H2C2O4, ZnCl2, and a combination of CuS and ZnCl2. To evaluate the impact of these compounds on the adsorptive activity of TPL, the surface characteristics of the resulting adsorbents and their ability for MB adsorption were measured. The biggest surface area (264.360 m2/g), the highest percentage eliminating MB (97.63%), and the appearance of four additional functional groups were found in the case of TPL, which was modified by H2C2O4 (S2). As a result, this adsorbent (S2) was selected in this research to conduct the other MB adsorption trials. The data resulting from these trials were analyzed by the nonlinear kinetic and isotherm models, which are more precise than the linear models. According to the surface analysis findings, S2 has a large surface area (264.360 m2/g), pHzpc = 6.5, and four additional new bands at 780.670, 1318.540, 1454.890, and 1616.920 cm ̶1. The findings of the kinetic and equilibrium studies indicated that the circumstances of 300 K, 0.035 g S2, pH 8, and 1000 mg/L MB concentration were favorable for this adsorption, which achieved equilibrium after 2 h. This study showed that the pseudo-1st-order and Freundlich nonlinear models were more effective in describing the empirical data of this adsorption. The thermodynamic results showed that S2 can be easily recycled and that the MB cations were exothermally and spontaneously adsorbed by S2. The elevated qmax of this adsorption (1055.88 mg/g) proved that S2, as an inexpensive and eco-friendly adsorbent, will be an efficient adsorbent to eliminate MB from wastewater.

