

Introduction
The wide spectrum of environmental pollution, including aquatic ecosystems such as rivers, is observed mostly in urban areas and large industrial agglomerations, e.g. the Upper Silesian Industrial Region and Legnica-Głogowski Copper District.
The Kłodnica River is the longest tributary of the Odra River flowing through the Upper Silesian Industrial District. Especially in the upper course reaches of Kłodnica River and its tributaries spread over densely populated and industrial areas of Upper Silesian Industrial Region. This region is at the center of the strong investigation by many groups of researches from many years [1-9]. The upper Kłodnica river flows through the densely populated industrial areas of the Upper Silesian Industrial District, collecting municipal and industrial sewage from Katowice, Ruda Śląska, Bytom, Zabrze and Gliwice. It is also a receiver of underground water from hard coal mines in the catchment area. Below Gliwice, the river flows through agricultural land. Main activities in chosen cities form Kłodnica catchment were collected Table 1.
The Kłodnica River system is the main part of the middle Odra River system. The most important sources of contaminations of Odra catchment area are industrial centers – mainly coal and copper mining and processing activity (non-ferrous metallurgy, electroplating plants, pigments production, pesticides, anticorrosive materials, and power industry), as well as agricultural activity (intensive crop production) [10-12].
The investigation of river sediments allows the river contamination analysis over a long period of time and estimate of the development in the sediments due to the changing of industrial space along the river.
The aim of this research was a comprehensive evaluation of the condition and dynamics of present in the Kłodnica River contaminants by applying methods of multivariate data analysis such as cluster analysis, multivariate analysis of variance and discriminant analysis, and factor analysis.
The powerful tool in the analytical of the distribution of chemical elements in different environmental components has become the multivariate data analysis know as chemometric methods. The main aim of chemometrics is to reduce the relatively large number of variables to a smaller number of factors that should explain the major variance of the data matrix. The multivariate statistical methods and their advantages for the interpretation of multidimensional changes in the degree of pollution of a river are described in details [11, 13-19].
Material and Methods
Sampling Area Description
Upper Silesia is the largest industrial district in Poland. In this area there are many mines, which belong to “Katowicki Holding Weglowy” and “Kompania Weglowa”. There are also many coal mines which do not function nowadays but which in the past contributed to degradation of natural environment of the Upper Silesia Industrial Region. In the vicinity of energy sources many other branches of industry also appeared, e.g. metallurgical industry, power industry, engineering industry and chemical industry [9, 20].
The Klodnica River is the longest river flowing through the region of Upper Silesia Industrial Region (USIR). It is one of the right-bank tributaries of the Odra River. The length of the Klodnica river is over 75 km long and 40 km of which are within USIR. The spring of the Klodnica River is located in the southern part of Katowice, in Murckowski Forests. The river flows through the biggest cities of the Upper Silesia, such as: Katowice, Ruda Ślaska, Mikołow, Zabrze, Bytom, Gliwice and ends its course in Kedzierzyn-Kozle flowing into the Odra River [1, 2, 4, 9]. In the Kłodnica catchment are located three dam reservoirs: Dzierżno Duże - on the Kłodnica river, Dzierżno Małe - on the Drama stream and Płaniowicki - on the Toszecki stream [21].
For the first time, it was proposed to carry out sampling in at least two campaigns at the same sampling points to determine the periodic variability of heavy metal content in water, suspension and river sediments in the Kłodnica River catchment area. In the years 2013-2014 first time intensive and complex investigations of the Kłodnica River system were carried out within the framework of the project financed by National Science Center (decision number: DEC-2012/05/N/ ST10/03616). The sampling area of the Kłodnica River with the localization of the sampling points (the same for each of the sampling campaigns) are shown in Fig. 1 and Table 2. Totally 32 sediments samples (16 for each campaign) make a matrix of data for further studies.
Table 1.
Main activities in chosen cities from the Kłodnica River catchment.
Methods
The grain size fraction <20 μm were separated from the sediments and its content were determined. The obtained samples underwent an analytical procedure described in studies relating to the International Odra Project [22]. For evaluation of the mobility and potential bioavailability of the metals in the sediment samples, the exchangeable and carbonatic bound metal fraction was rated, using chemical extraction method [10]. The metal contents were analyzed by using ICP-MS and/or AAS methods.
In the present paper, chemometrics methods such as cluster analysis (CA), multivariate analysis of variance and discriminant analysis (MVDA), and factor analysis (FA) were applied for river sediments to investigate the similarity of the sampling points and the interaction between the various pollutants (heavy metals). The software used for calculation and visualization was STATISTICA 12 from StatSoft and Microsoft Excel for Windows.
Results and Discussion
Distribution of Heavy Metals
The extensive urbanization, an underground exploitation of hard coal, copper- and lead-mining have an adverse effect on the Kłodnica River system. Hence, a high variability in the dataset and different contamination levels along the river were observed. The biggest pollution discharge is drained to the Kłodnica River in its main course, where the river and its tributaries flow through densely populated and highly industrialized most active areas of the Upper Silesia [2]. The main sources of pollution of the Kłodnica River are: precipitation sewage and thawing sewage flowing down from industrial and post-industrial areas, sewage flowing into the river from the areas where industrial and municipal landfills are located, discharge of mine water containing a lot of salt and untreated household sewage from cities and communes where there are no sewage treatment plants, or where sewage cannot be treated properly with the currently applied technology [4].
Fig. 1.
Description of the area and sampling points on the Kłodnica River catchment: I – watercourses, II – reservoirs, III -canals, IV – the border of the Kłodnica catchment, V – the border of the Kłodnica catchment to Kłodnica profile, VI – the border of the Kłodnica catchment to Gliwice profile, VII – bottom sediment sampling points, VIII – localization of pollution points and wastewater treatment plants: (1-10) – coal-mining industry, (11-13) – smelters, (14, 15) – transport industry, (16-19) – the energy industry, (20) – chemical industry, (21-25) – wastewater treatment plants), IX-cities [based on 4].
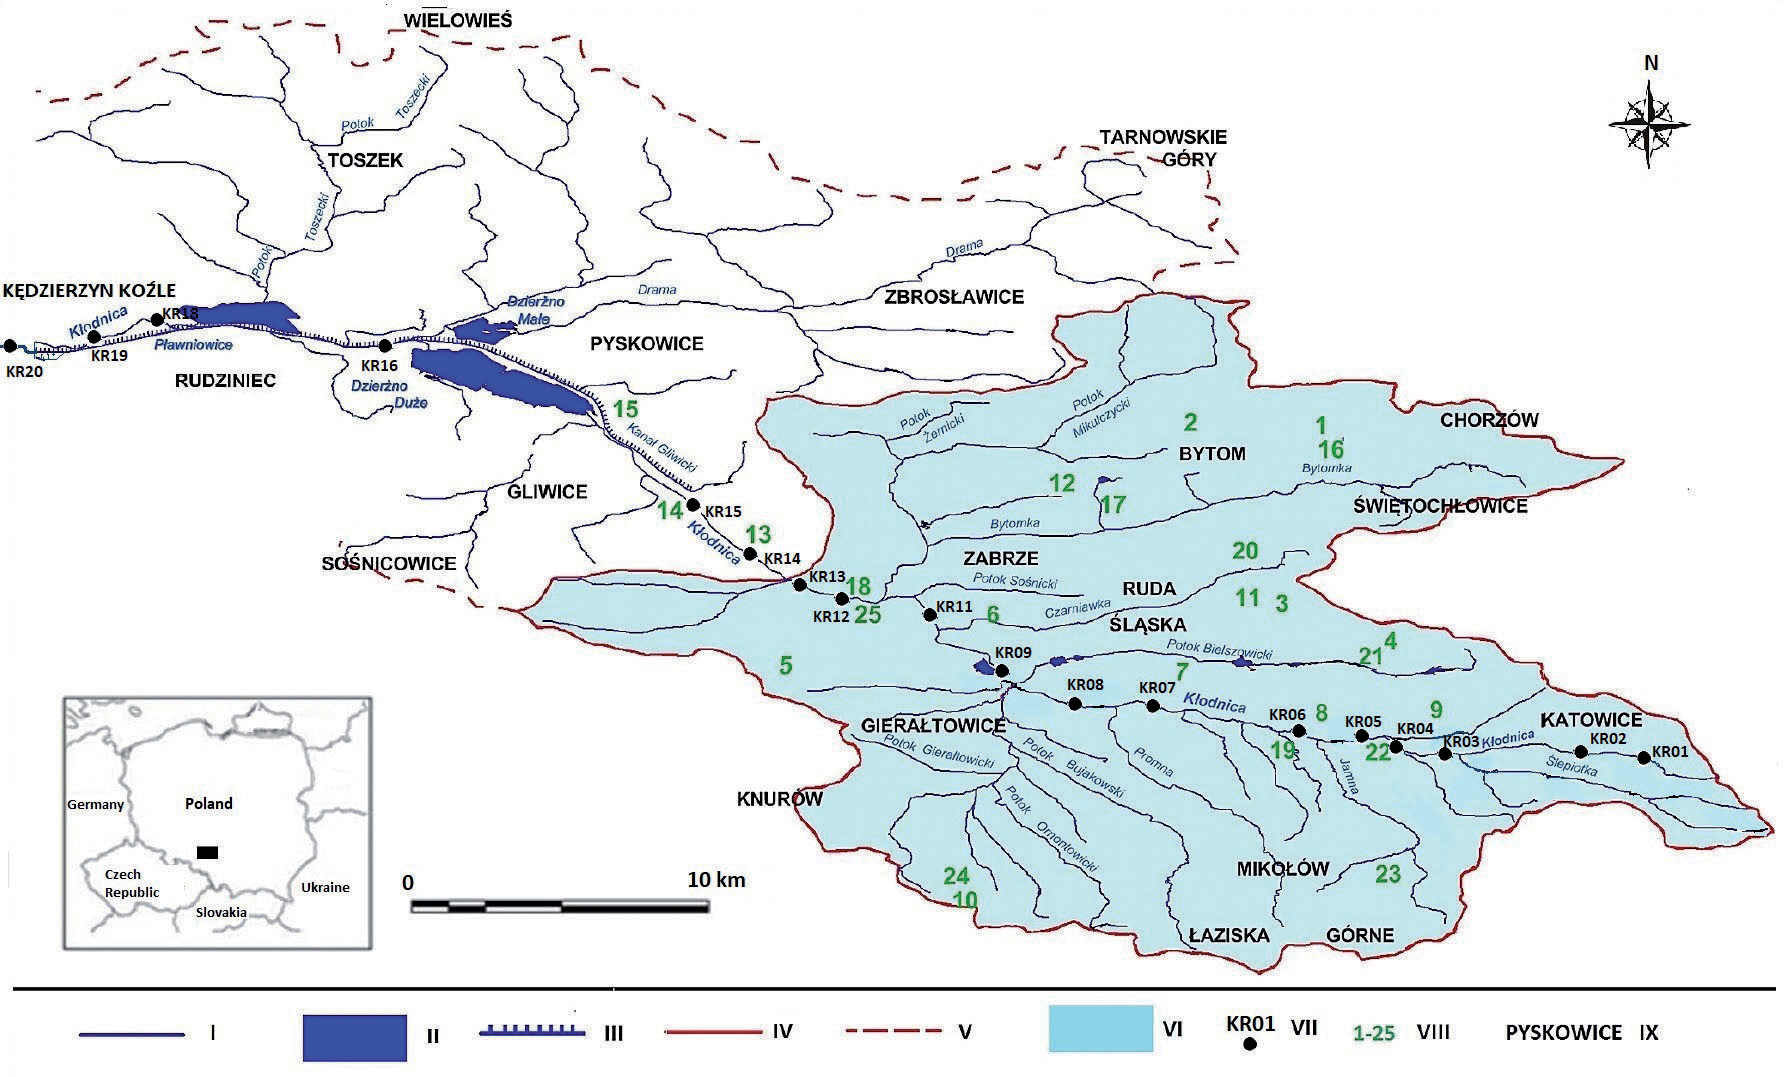
Table 2.
Description of the sampling points for the present study.
Until now, the Kłodnica River was studied by the several scientific teams. However, these experiments were characterized by a lack of regularity, and a small amount of randomly collected samples. This approach provides only a preliminary and superficial characterization of the pollution level in the Kłodnica River catchment [1, 4, 20, 23]. The mentioned researches were focused mainly on sediments studies and they confirmed that the Kłodnica River catchment is located in highly industrialized regions and is very differently and at several locations heavily polluted. Hence it is needed to complex monitoring of all river compartments and relationship between their parameters.
The Kłodnica River is a receiver of bad underground water with active hard coal mines (orginal name KWK), i.e. KWK Wujek, KWK Halemba – Wirek, KWK Sośnica – Makoszowy, and indirectly through the tributaries of Bytomka (KWK Bobrek – Centrum), Potok Bielszowicki (KWK Bielszowice), Czarniawka (KWK Sośnica – Makoszowy). The discharge rate is over 46,000 m3 per day. The waters of Kłodnica are also supplied with mine water from closed mines (48 km of the course in the area of Gliwice and through the Bytomka River). The discharged sewage is small, large sulphates and chlorides, and in some cases heavy metals. The sewage discharged by KWK Wujek includes Cu, Zn, Pb and upper Cd, or below the outlets of KWK Halemba in Ruda Śląska of significant water quality and a change in its color, which is related to with the presence of a trace of carbon presence [23].
On the basis of the observations carried out in the previous years, the places of rapid deterioration of the water quality in the Kłodnica River were identified. It receives the waters of three highly polluted tributaries, such as [4, 23]:
– Potok Bielszowicki (Kochłówka), to which municipal sewage is discharged from Ruda Śląska and Zabrze, in the vicinity of KWK Bielszowice there are significant amounts of coal suspension, while in the lower section of the stream, due to the reduction of the flow velocity, accumulation of the transported suspension takes place;
– Czarniawka River, which supplies Kłodnica municipal sewage, large amounts of coal dust and saline mine water from the Sośnica - Makoszowy coal mine;
– The Bytomka River, similarly to the above-mentioned tributaries, provides pollution related to municipal sewage and saline underground water from KWK Bobrek - Centrum.
The high population density in the Upper Silesian Industrial District determines the discharge of significant amounts of sewage from the sewage treatment plant to the Kłodnica River, and indirectly through its tributaries.
In the current study has been undisputed observed that the heavy metal situation in the sediments of the Kłodnica River system got worsened between 2013 and 2014. However, in the studied area a substantial reduction of the Fe, Ni, Mn, and Pb contents has been noticed. The content of all metals related to the progress of the Kłodnica River bottom sediments showed variability both along the river’s course and along the research path.
Arsenic and cadmium are anthropogenic and no trend along the river was observed for the two investigated campaigns. The maximum As contents originate at 32-35 km of Kłodnica River, so below the Bytomka tributary and below the sewage treatment plan and the district Gliwice- Łabędy in Gliwice city. The high contents of Cd in the upper course of river could be caused by emission of cadmium dust from the proximity of Cu and Pb mining and processing complex (e.g. mining and metallurgy in Katowice areas) and also coal-mining (the Katowice Coal District with the Upper Silesian Industrial region). Also, the peak of high content of Cd appears in the same sampling points as As, described above.
The contamination trend of chromium and copper along the river increases over the two campaigns. These metals are also of anthropogenic origin. Chromium probably originated from the leather industry, ironworks of stainless steel, and manufacture of paints. Nickel belongs to geochemical background but increasing trend was observed in the investigated period of time. It was found that the investigated bottom sediments were not contaminated with nickel in first campaign and chromium in both campaigns- their amount was similar to the geochemical background. There was also an increased content of iron and zinc in the sediments, although in the case of these metals, the geochemical background was exceeded. The distribution of the remaining elements Fe, Mn, Pb, and Zn manifested in a slightly decreasing trend along the river for all two years. Lead and Cu may originate from industrial wastewater e.g. from Cu-Pb-mining and can also be transported by the other streams from these industrial areas. The peaks with high concentration of Mn were located at the barrages of the Kłodnica River.
According to the LAWA classification, the content of lead, copper, nickel and chromium in Kłodnica bottom sediments was within the 2nd purity class (recommended permissible values of contamination), which proved that the gland was not loaded with these elements lightly. Slightly higher values were renewed in the case of zinc (class II-III), while cadmium is a significant problem from the point of view of the quality of Kłodnica bottom sediments. In the case of this first grid, the pollution of bottom sediments, characteristic of the 3rd-4th cleanliness class, was renewed. Cadmium is the most mobile among the marked heavy metals, thanks to which it easily accumulates in both plant and animal organisms and thus is introduced into the food chain.
Iron is not considered impurities. However, the determination of its content is also important from the point of view of environmental analytics, because the oxides of this metal are sorbents for other pollutants, including heavy metals. The high content of Fe in bottom sediments may indicate the inflow of certain sewage [24].
In mines, apart from coal deposits, there are also some amounts of other minerals, including iron sulfide (pirtite) and manganese sulfide. Magnetite is also used in the coal flotation process. The presence of these waters is also of some importance and their discharge to surface waters contributes to the oxidation of iron compounds to forms insoluble in water. Oxides and other minerals of these elements are transported to a certain distance from the source of wastewater, and then sediment, contributing to an increase in the content of these metals in the bottom sediments. Good sorption properties of the oxides of these elements may, in turn, cause an increase in the amount of copper and nickel in the sediments collected on these sampling points [24].
The pattern of spatial variation of the metals in the river sediments indicates that a huge variety of sources might be responsible for the contamination. Intensive past and current mining and smelting activities are probably the most significant pollution sources.
The mean values of heavy metal contents in the Kłodnica River sediments are listed in Table 3.
In this study, between the campaigns, a decrease in iron content and a slight decrease in manganese content in bottom sediments were observed, which may be due to a reduction in the impact of sewage from hard coal mines. It has to be underlined that the oxides of these metals are good sorbents for other pollution, including heavy metals.
The changes in the amounts of Zn and Pb between years can be results of limitation associated with the presence of previously mined ore deposits in the river catchment area zinc, lead and co-occurring cadmium and the location of heaps from this type of mining.
Whereas, the increase in the average nickel content in sediments may be caused by unsustainable mining of hard coal ores.
In the case of cadmium an increase in the content was observed in the studied period. Cadmium is the most mobile of the heavy metals determined due to which it easily accumulates in both plant and animal organisms and in this way is introduced into the food chain [23].
Arsenic is a mobile element in a compound with which it occurs in all elements of the environment. It easily passes from the lithosphere to the hydrosphere, and its contents in natural waters is strongly differentiated and depends on the type of substrate. Increase of average arsenic contamination in sediments between studies years may be caused by agricultural changes.
The research carried out indicates that it is advisable to include changes in the content of heavy metals in the sediments of the Kłodnica River under constant analytical control.
Considerable contamination of bottom sediments with heavy metals does not only concern Polish rivers (for example, the Kłodnica, Odra and Vistula rivers), but also many European ones (Table 4). High concentrations of the combined heavy metals are associated with mining and metallurgical activities in the areas of the catchment area, and these in turn are conditioned by the presence of deposits. The location of these rivers’ catchments significantly affects the quality of their bottom sediments.
Table 3.
Arsenic and heavy metal mean concentration in the Kłodnica River sediments (2013-2014) in mg/kg.
| Metals | Year | |
|---|---|---|
| May 2013 | May 2014 | |
| As | 6.4 | 83.3 |
| Cd | 15.1 | 40.3 |
| Cr | 43.7 | 36.3 |
| Cu | 78.4 | 83.9 |
| Fe | 33438.9 | 19250.2 |
| Ni | 39.1 | 1182.6 |
| Mn | 1174.1 | 1112 |
| Pb | 367.8 | 162.7 |
| Zn | 2842.7 | 1277 |
Comparing the obtained results with studies carried out in other rivers [25], it can be noticed that in many opinions on the pollution of the natural environment of Upper Silesia, the content of heavy metals in the Kłodnica bottom sediments does not differ significantly from the state observed in other regions of Poland. It can even be stated that the contamination with heavy metals of the bottom sediments of the Odra and Vistula rivers.
Cluster Analysis
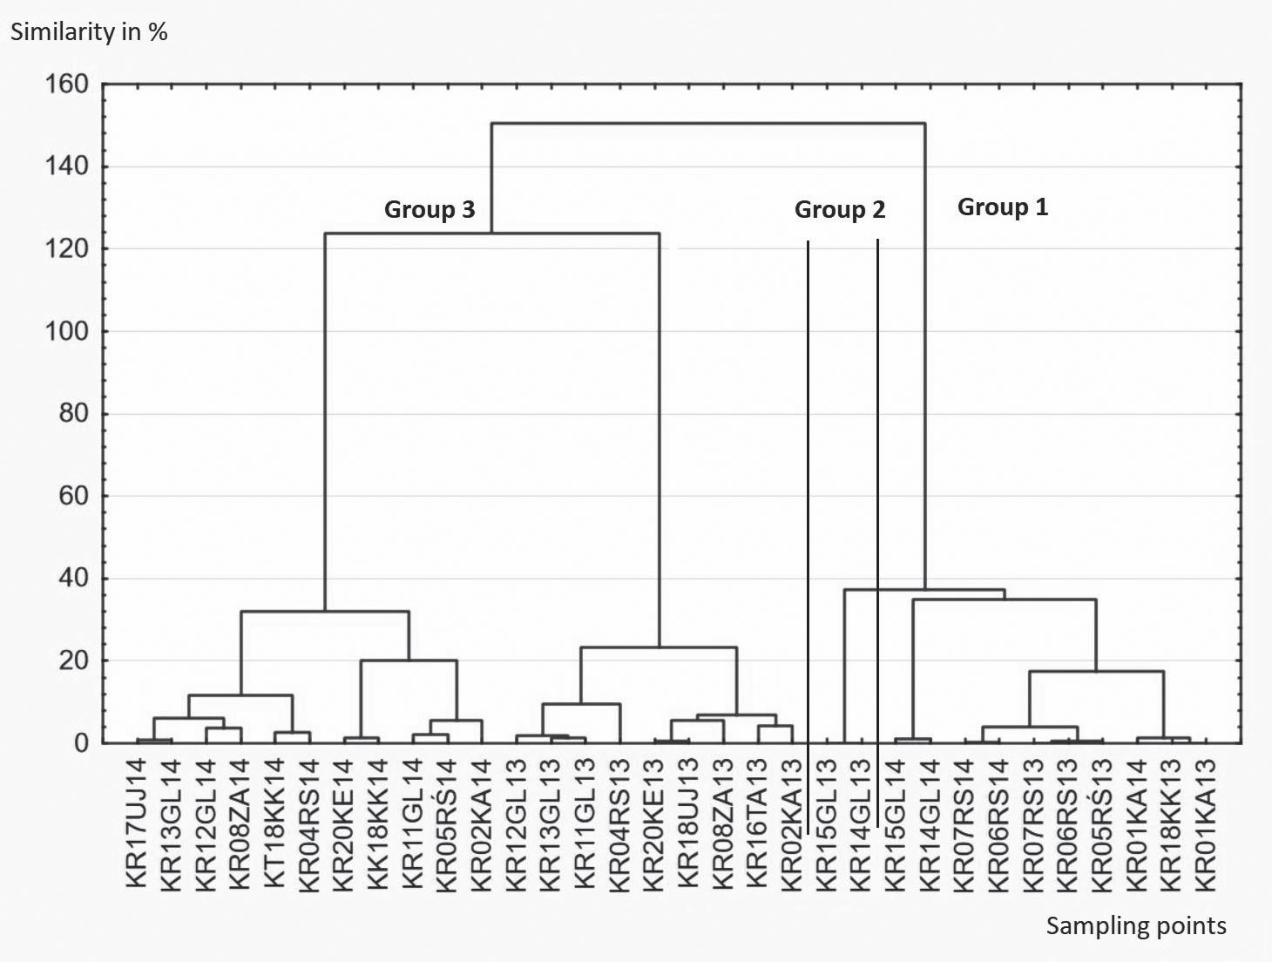
Using the CA method, the different pollution states of the river sediments are distinguished. As shown in Fig. 2, there are three groups of sediments in the Kłodnica River; an appearance of these groups is strongly correlated with the location of the major pollution sources along the river and the year of campaign.
In general, the samples clustered in group 1 belong to the upper course of the Kłodnica River (Katowice and Ruda Śląska) for 2013 and 2 sampling points at 32-35 km of Kłodnica River, so below the Bytomka tributary and below the sewage treatment plan and the district Gliwice- Łabędy in Gliwice city for 2014 and they are characterized by higher contents of heavy metals, especially of Cd, Cu, Pb, and Zn. An increase of the mentioned metals in this region was caused mainly by the mining and smelting industry. Samples from group 2 were collected at sampling points in Gliwice (at 32-35 km of river) in year 2013 and they are strongly contaminated with Cd and Cr but weakly contaminated Cu, Pb and Zn. The remaining sediment samples from group 3 belong to the Kłodnica River middle and lower course from years 2013 and 2014. These samples showed similar contents of all examined metals.
Multivariate Analysis of Variance and Discriminant Analysis
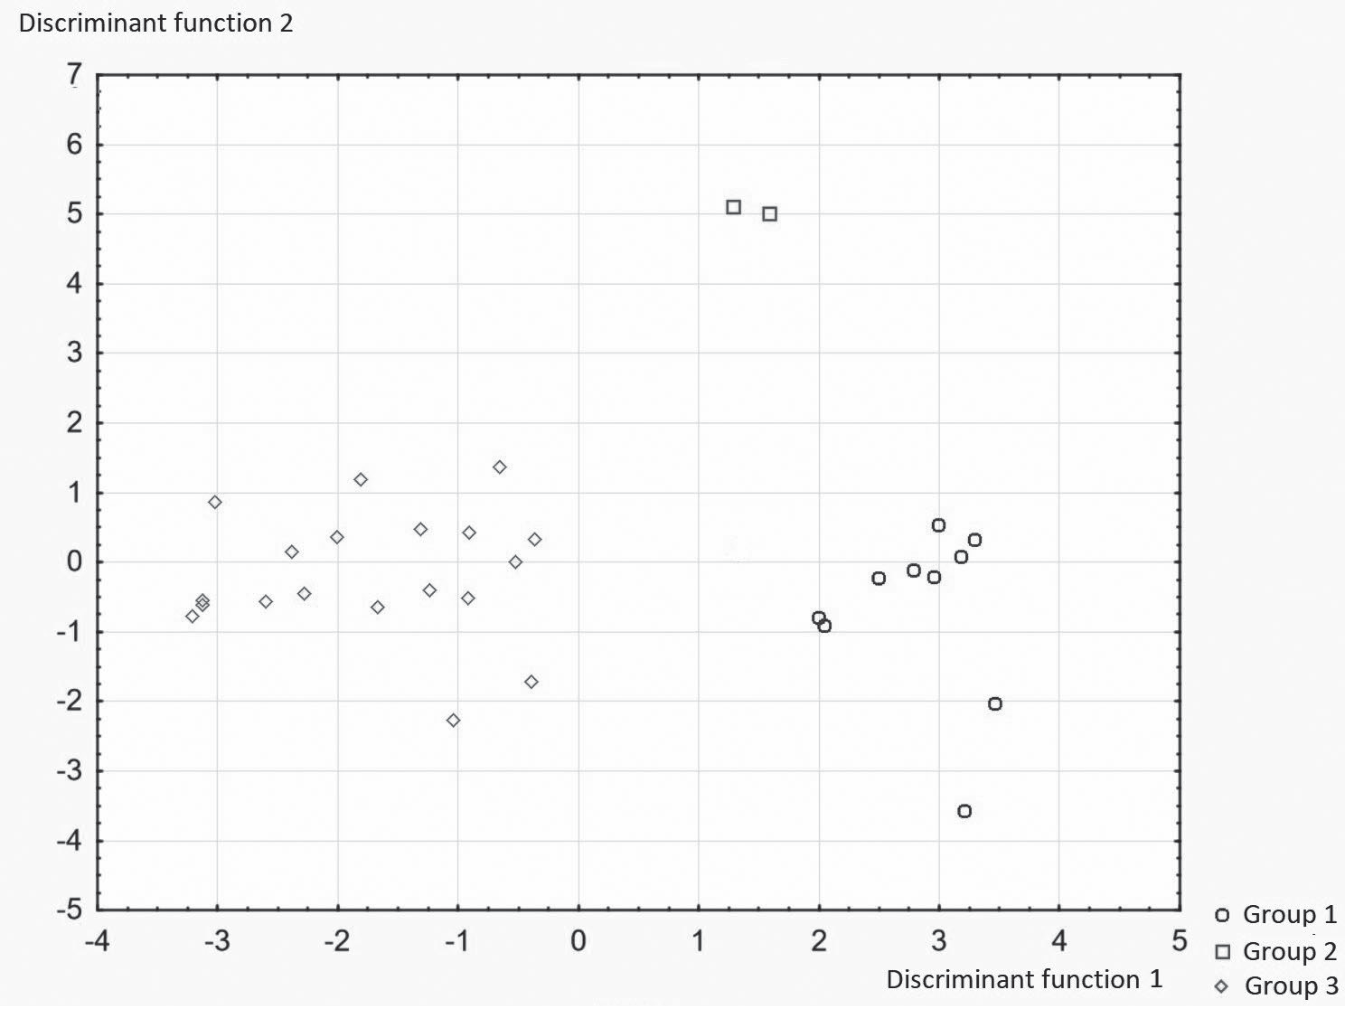
As seen in Fig. 3, three different groups of sediments exist in the Kłodnica River. These three different clusters of the river sediment samples have been proved by MVDA with an error of reclassification of 0% (Fig. 3).
The character of sediment samples in group 2 is quite different from the two other groups, because of their very high chromium content. The resulting differences between extracted groups are described in chapter ‘Cluster analysis’.
The forward strategy was used to reduce the number of features. This strategy started with a feature with the highest F-value and then successively further features were added until the reclassification error reached the minimum (in our case zero). In the 4th step of the forward strategy, the variables As, Cd, Cu, Pb, and Zn are sufficient to describe the variability in the Kłodnica River sediments and to separate the three groups. Only these four metals are significant, therefore Cr, Fe, Ni and Mn are not used for this DA.
Table 4.
Maximum content of selected heavy metals in the bottom sediments of the Kłodnica River (mean from campaigns 2013 and 2014) compared to rivers from the areas of historical and / or present mining and metallurgy in Europe [25].
Factor Analysis
The FA technique was used to extract two factors with the highest eigenvalue out of matrix of nine features (total contents of As, Cd, Cr, Cu, Fe, Ni, Mn, Pb, and Zn) and 32 sampling points of the Kłodnica River. These two factors describe approximately 61 % of the common variance (Table 5).
In order to interpret a group of variables associated with a particular factor, only loadings above 0.7 are considered as reliable. After normalized varimax rotation of the factors loading matrix, it is possible to isolate precisely the factors that could represent the groups of pollutants.
The complete dataset of the Kłodnica River sediment samples can be interpreted as follows: Factor 1 describes 36.74% of the common variance and is highly loaded by the anthropogenic parameters As, and Cd. This factor characterizes the influence of the industrial and coal mining activities in the region of interest. Factor 2 induces pollution with Cu, Pb and Zn (explains 24.67 % of the common variance) and represents also anthropogenic pollutions. This result could also originate from various mining and metallurgy industrial and coal mining activities in the region of interest.
Table 5.
Matrix of the factor loadings for the Kłodnica River sediment samples (after normalized varimax rotation function).
| Element | Factor 1 | Factor 2 |
|---|---|---|
| As | 0.829 | |
| Cd | 0.718 | |
| Cu | 0.715 | |
| Pb | 0.844 | |
| Zn | 0.896 | |
| % of variance | 36.74 | 24.67 |
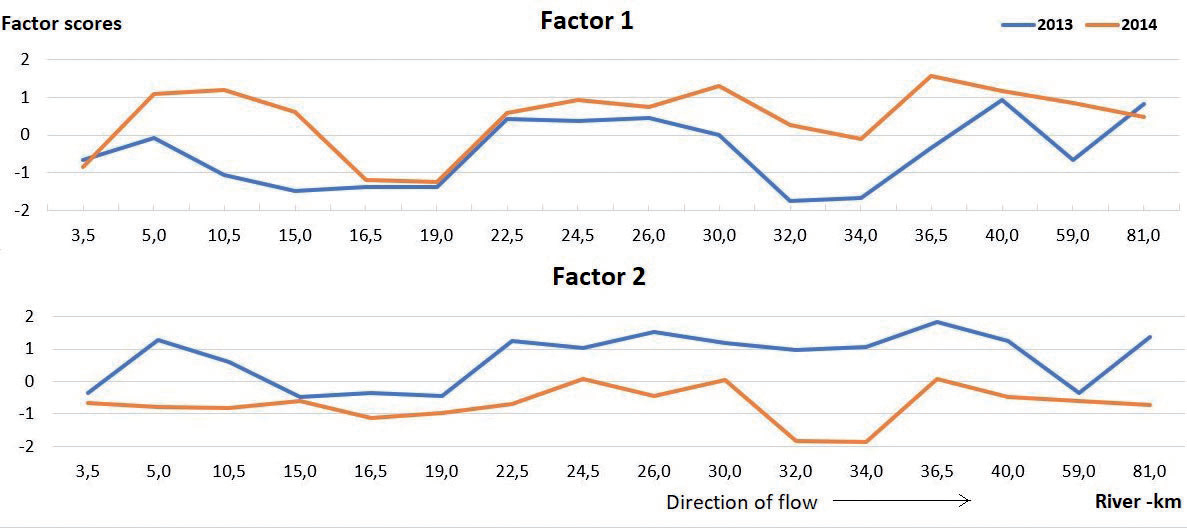
This interpretation of factor analytical solution can be confirmed by the representation of factor scores as a function of river-kilometers (Fig. 4). High scores correspond to the high influence of the sampling sites on the factor.
As shown in Fig. 4, the first factor has an increasing trend and shows the highest factor scores at river-km 30 (Gliwice) and 36 (Gliwice) (below the Bytomka tributary and below the sewage treatment plan and the district Gliwice- Łabędy) for both years 2013 and 2014. The sediments from these sampling points were very polluted, especially with Cu, Pb and Zn. The high factor scores indicate the influence of iron- and stainless-steel works, leather or paints and varnishes industries, Cu-mining and smelting industry and battery manufacturing. The scores of the second factor slightly increased along the river for both years. This effect may have originated from the influence of Cu and Pb mining and processing complex and also coal-mining. An impact of the Kłodnica River tributaries and the river regulations should also be considered for both factors.
Conclusions
This study confirmed and improved, that the multivariate analysis methods are the useful and powerful tools for the river pollutions definition. The application of univariate methods allows only a brief description of the pollution state neglecting investigations among the features. Therefore, chemometric methods must be used to obtain the latent information.
Using the cluster analysis and multivariate analysis of variance and discriminant analysis, three major patterns of pollutions could be distinguished in the investigated industrial region.
Furthermore, the real reduction of the matrix dimensions by using forward strategy was presented. In the steps of this strategy, variables like As, Cd, Cu, Pb and Zn are sufficient to describe the variability in the river sediment samples and to separate the three groups of sampling points.
The factor analysis identifies two latent factors responsible for the data structure. They explained over 61% of the total variance of the system, allowing identification of the dominant “anthropogenic” pollution sources in the Kłodnica River system. The obtained results of factor analysis interpretation confirmed the factor scores as a function of river-kilometers.
The most significant metals are Cu, Pn, and Zn, which were extracted as factor 1, additionally As and Cd, which represented factor 2. They also have the highest impact on the separation of the three groups of the sampling points and the reduction of the dimension of the data matrix by means of MVDA.
The Kłodnica River is loaded with anthropogenic waters, practically from the very sources. It accepts a large number of domestic, industrial and mine water services. Both its left-bank and right-bank tributaries are also highly polluted. There are many industrial plants of hard coal mines and sewage treatment plants in the Kłodnica River catchment area.
The conducted chemometric analysis and assessment of the state of pollution of the Kłodnica river sediments, confirmed the presence of four extreme sources of pollution in the Kłodnica river basin such as:
– the Kłodnica River – section in Ruda Śląska (in the Halemba district) in Gliwice, and the right-bank tributaries of the Kłodnica River such as:
– Kochłówka tributary (another name: Potok Bielszowicki),
– Czarniawka tributary in the city Zabrze, and Bytomka tributary.
These sources are heavily loaded with high concentrations of metals such as Cd, Pb and Zn in bottom sediments and river suspension. The chemometric interpretations of the collected data sets on the pollution of the Kłodnica river and its tributaries are confirmed by the results of the published research [1, 9, 20].
An increasing problem from the point of view of environmental pollution is the cadmium content in Kłodnica bottom sediments. special attention should be paid to the content of this element and the identification of its origin.
Hard coal mining still has a significant impact on the pollution of the waters of the Katowice agglomeration - the content of iron and manganese in the bottom sediments of Kłodnica is significantly higher than the point of discharge of coal wastewater.
It is worth recall that the chemometric approach to river data can reveal a new quality of information and achieve new understanding of the complexity of such environmental systems. This also indicates multidimensional statistical methods are also an indispensable tool for studying the geochemistry of river environment.

