


Introduction
Population growth in an area will result in an increase in space requirements for residents. This phenomenon will increase the area of settlements and utilization of natural resources [1, 2]. These conditions affect an important part of life and have a big role in the sustainability of life, especially the availability of water sources [3, 4]. Humans and other living things that do not live in water, are always looking for places to live near water so that it is easy to take water for their living needs [5, 6]. Water is a basic need for life, especially for humans who have always needed water throughout their lives [7, 8]. Globally, in terms of volume, groundwater has a greater capacity compared to surface water volumes such as lakes and rivers [9]. Not only that, the different volumes of earth's water and its limited capacity in an area make the management of earth's water pay attention to the principles of existing water balance [10, 11].
Clean water is one of the basic needs needed in life [12]. Almost every activity carried out by the community requires clean water, from drinking, bathing, cooking, washing, and other activities [13-15]. The importance of water in this life makes the need for clean water and its availability must be considered [16]. When discussing water availability, it is necessary to know the calculation of the need for clean water for each person so that they can calculate the amount of clean water needed [17]. According to [18], water is divided into four groups, namely water that is used for drinking water directly (without having to be processed first), raw water that is processed as drinking water and household needs, water for fisheries and animal husbandry purposes, and water for agricultural purposes as well as urban business, industry, and power generation. This opinion is in line with [19] which states "If a confined aquifer is taken for water freely (irregularly) it causes the condition of the aquifer to change from saturated to unsaturated so that the characteristics of the aquifer will change and will not return to normal, even though This water-unsaturated condition is returned to a water-saturated condition. Therefore, the role of groundwater in the water resources management system by looking at its quality is very important [20, 21].
Clean water research in Rokan Hilir Riau by comparing well water quality parameters, especially degree of acidity (pH), biochemical oxygen demand (BOD), and chemical oxygen demand (COD) parameters, which shows that groundwater conditions are experiencing serious problems due to increased wastewater pollution [22], in line with the results of research by [23] which states that the impact of polluted well water is caused by increasing population activity and lack of control due to pollution so it is important to use activated carbon to improve the quality of well water contaminated with wastewater contamination, and groundwater management in the Bangka Belitung Regency area which is difficult for the community to obtain can be replaced with groundwater management techniques using reservoir techniques [24]. Based on the many studies related to the importance of clean water needs, the condition of clean water is increasingly becoming a serious problem and management needs to be minimized, especially in guaranteeing the lives of the population and for the sake of sustainable use of clean water, reviewing several studies on clean water in Indonesia, no one has conducted research related to the distribution of quality. Clean water wells in slum settlements, the results of this study aim to be able to answer problems regarding the potential quality of well water and the efficiency of production wells so that it does not have a serious impact on the use of water for consumption by residents in the slum area of Bandung City. This study aims to estimate the value and distribution index of the quality of well water for residents in the slum area of Bandung City, West Java Province, Indonesia.
Materials and Methods
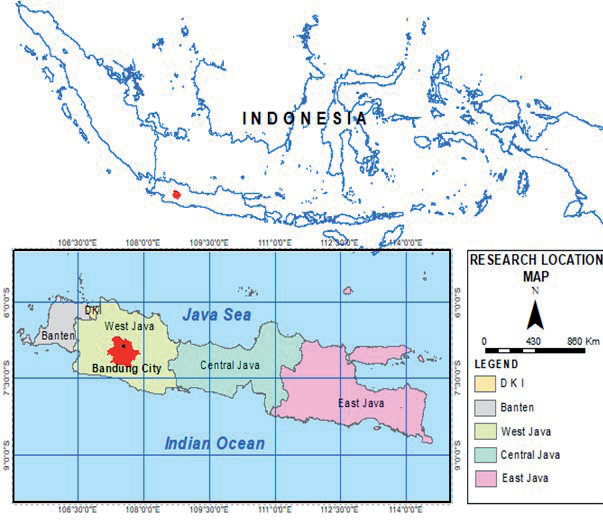
Sampling of well water, data collection, and analysis was carried out from January to May 2019 around the residential area of Bandung City. Water sampling was carried out at 3 location points that entered densely-slum residential areas, namely Kampong Pelangi (The Upper Dago Village), Kampong Cimaung (The Middle Tamansari Village), and Kampong Middle Mengger (The Lower Mengger Village), as shown in Fig 1.
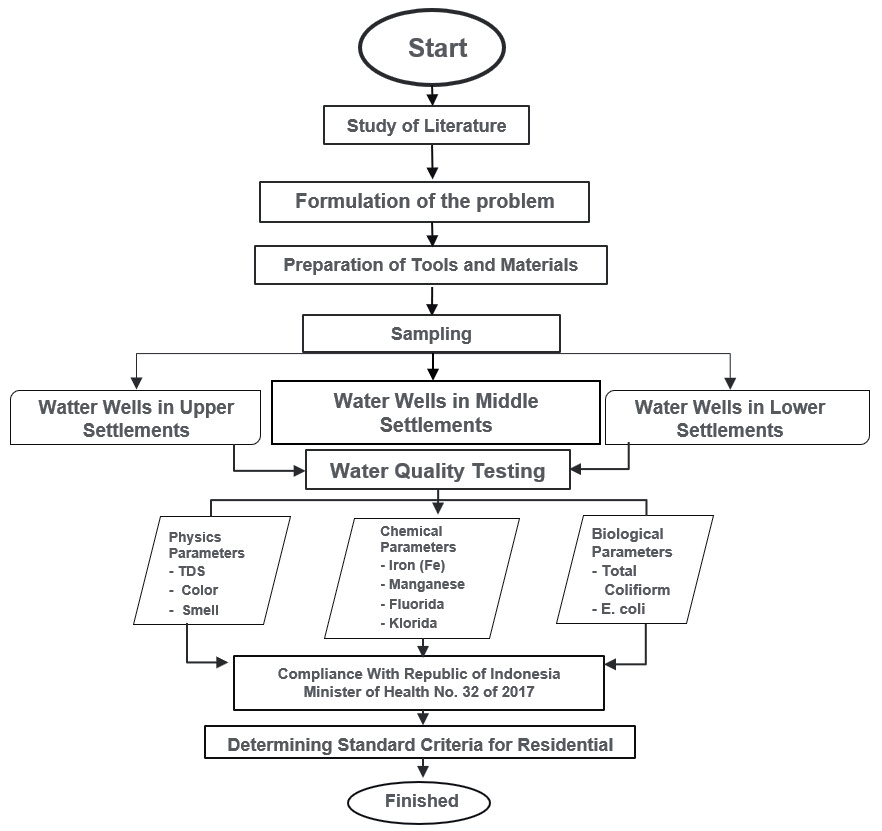
Primary data was obtained by measuring and calculating the number of well water samples in settlements around the densely populated slum area of Bandung City, West Java Province, Indonesia. Secondary data was obtained from related literature and agencies such as the Bandung City Environmental Service and Government Regulation (PP) No. 82 of 2001 and conformity with PERMENKES Becomes Republic of Indonesia Minister of Health Number 32 of 2017. The research data was obtained by observing and taking water samples with the research stages presented in Fig 2. Laboratory results data were then compared with existing quality standards and given a category for each location with an assessment of environmental quality service.
Sampling of well water at the study site using plastic bottles. For total suspended solid (TSS) parameters, color, and odor or odor, use a 1 liter plastic bottle which is then tightly closed and then put in an ice box so that the water temperature is maintained so it doesn't damage or change the quality of the two parameters. Furthermore, water sampling for levels of iron, fluoride, chloride and manganese used a 300 mL Winkler bottle. Measurement of well water quality uses the clean water quality standards of the Republic of Indonesia Minister of Health No. 32 of 2017. The water quality parameters are limited to the main parameters of clean water quality related to pollutant sources around residential well water, namely odor, TDS, color, iron, chloride, manganese, nitrate as N, total coliform and Escherichia coli. Methods/tools for measuring water quality can be seen in Table 1.
Table 1.
Reference of physico-chemical and biological parameters of well water quality.
Table 2.
Analysis of Pollution Index.
| No | Pollution Index Score | Description |
|---|---|---|
| 1 | 0 -1,0 | Good |
| 2 | 1,1 – 5,0 | Lightly blackened |
| 3 | 5,1 - 10 | Medium blackened |
| 4 | >10 | Heavy Polluted |
The water sample analysis method was carried out based on the analytical procedures of the Indonesian National Standard (SNI) on water and wastewater which refers to the Standard Methods for the Examination of Water and Wastewater [25]. As a reference in analyzing laboratory results of well water in settlements around densely populated slums in Bandung City, West Java Province, class I water quality standards are used. This is because well water in densely populated slum suburbs is one of the sources of raw water used by residents. The next analytical method is pollution index analysis, with equations [26, 27]:
Where :
IPj = Pollution Index for designation
Ci = Concentration parameter test results
Lij = Parameter concentration according to quality standard for water designation j
(Ci/Lij)M = Maximum Ci/Lij value
(Ci/Lij)R = Average Ci/Lij values
Results and Discussion
Potential Need for Clean Water (Physics, Organic Chemistry and Inorganic)
Sampling of well water and laboratory analysis of consumptive well water quality in densely populated slum settlements in Bandung City was carried out from January to March 2019. The results of water quality analysis of wells in riverside settlements are as follows:
Total Dissolve Solid (TDS) and Color of Residential Well Water Quality
Total dissolve solid (TDS) is the amount of dissolved solids. Dissolved solids are solids due to waste disposal, so that the analysis of dissolved solids is a continuation of suspended solids [28, 29]. The color in water can be caused by the presence of organic and inorganic materials, due to the presence of plankton, humus and metal ions and other materials [30, 31]. TDS results and the color of residential well water in the upper part of the densely inhabited slum area of Bandung City in Kampong Pelangi settlement (Dago Village) shows a TDS content of around 265 mg/L with a color value of 2 PtCo, in the central part of Kampong Cimaung settlement (Taman Sari Village) TDS content ranged from 175 mg/L with a color value of 4 PtCo and different results were produced in the settlement area of Kampong Mengger Tengah (Mengger Village) with a dissolved solids value of 293 mg/L with a color value of 9. TDS and color values were based on laboratory tests. Respectively, each sample on average is below the environmental quality standards stipulated in Government Regulation Number 82 of 2001 which corresponds to environmental health quality standards for drinking water media for sanitary hygienic purposes based on Minister of Health Regulation Number 32 of 2017 which both require a threshold the quality standard limit is 1000 mg/L (TDS) and 50 PtCo (color). This is very important in the management of residential well water, which contains high levels of dissolved solids that need to be treated first so that it is safely discharged into public waters. The results of TDS and color measurements in residential well water samples are presented in Fig. 3.
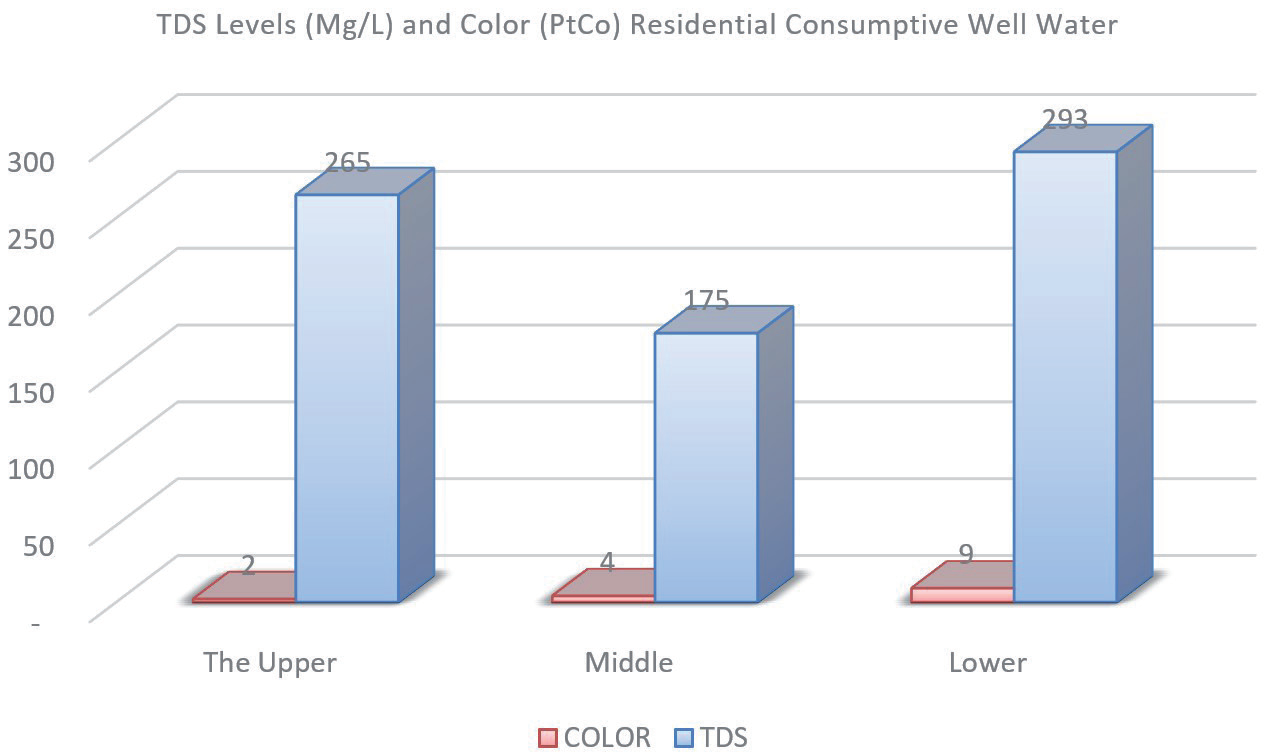
The high TDS levels at the top and bottom are due to the location of the dug well, which is < 1 meter from the septic tank and ditch. Ditch water around the dug wells comes from residents' domestic activity waste water (gray water). The location of the ditch ≤ 25 meters will affect the TDS condition of the groundwater. This is because the water from the ditch contains organic, inorganic, sediment, and other solid waste materials dissolved in the water.
Organic and Inorganic Chemical Content of Residential Well Water
Iron, Manganese, Fluoride and Chloride
Based on the results of the overall measurement of the quality of consumptive well water in densely populated slums in Bandung City, the content of Iron, Manganese, Fluoride and Chloride has increased in value close to the maximum threshold for water quality standards required by the Minister of Health Regulation Number 32 of 2017. According to [32], the water quality of settlement wells which are sourced from groundwater carries residues from the ground, and what is important to note is that there are sources of pollution that can seep into groundwater.
The results of measuring the content of iron, fluoride, chloride and manganese in residential well water in the upper part of the densely inhabited slum area of Bandung City in the Kampong Pelangi settlement (Dago Village) showed an iron content of around 0.0285 mg/L, a fluoride value of 0.0198 mg/L, a Chloride value of 2 mg/L with a Manganese content of 0.03 mg/L, in the middle of Kampong Cimaung settlement (Tamansari Village) the iron content ranges from 0.0285 mg/L, a fluoride value of 0.31 mg/L, a chloride value of 30.46 mg/L and a manganese content of 0.34 mg/L and the results of laboratory measurements and calculations in the settlement area of Kampong Middle Mengger (Mengger Village) with a dissolved solids value of 0.0285 mg/L, a fluoride value of 0. 23 mg/L, chloride value of 33.27 mg/L and manganese content of 0.03 mg/L. Manganese concentrations in surface water rarely exceed 1.0 mg/L, but much higher concentrations can occur in groundwater under anaerobic conditions. WHO has set a manganese concentration value to be used as a guideline, which is 0.5 mg/L, while for health a lower level is recommended, namely 0.1 mg/L [33].
Table 3.
Content of iron, fluoride, chloride and manganese in residential well water.
Nitrate as N, Organic Substance (KMnO4) and CaCO3
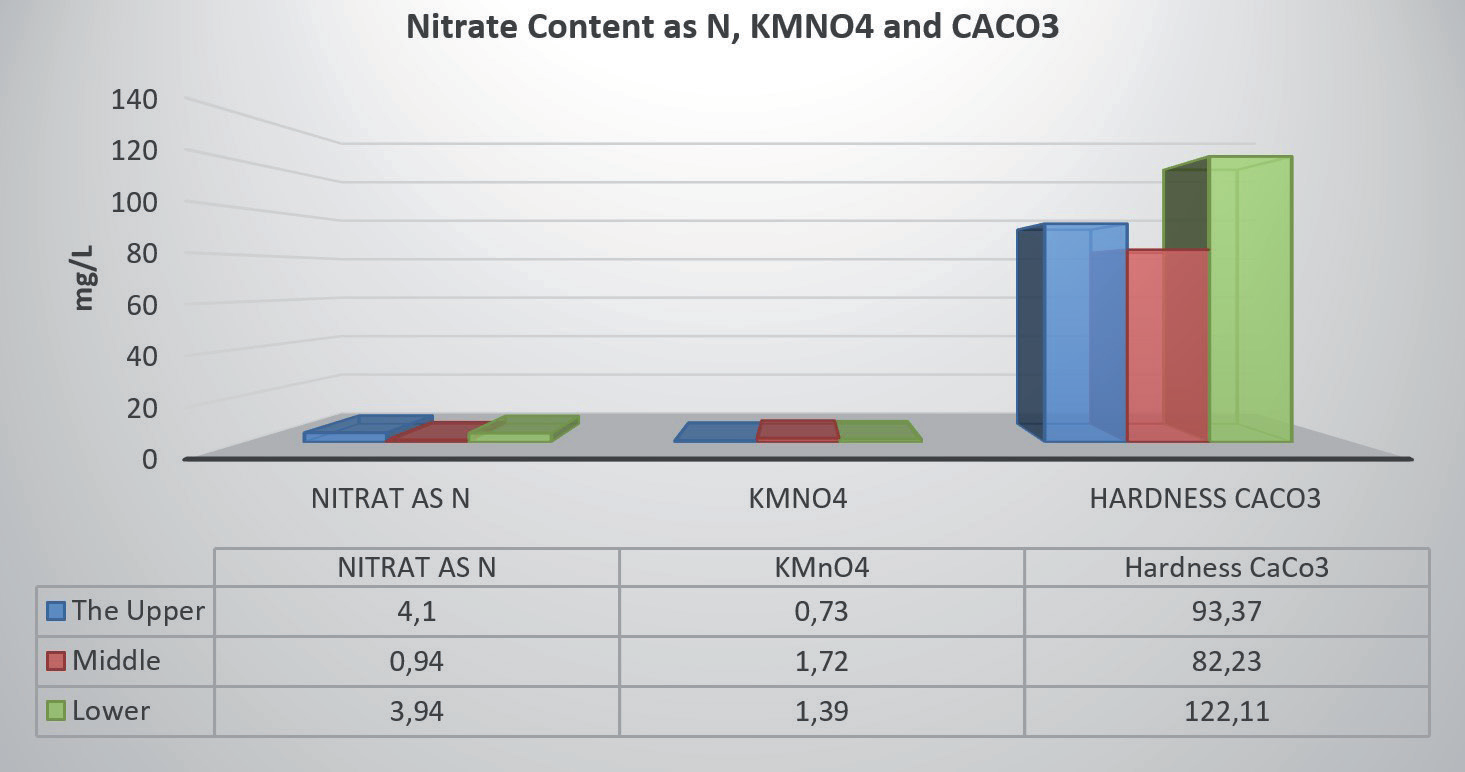
Nitrate is the main form of nitrogen in water and the main nutrient for plants and algae. According to [34] states that nitrate compounds are produced from the perfect oxidation process of nitrogen compounds in waters. The condition of increasing levels of organic matter (KMnO4) and CaCO3 in dug well water (groundwater) can be influenced by the condition of the well itself or the cleanliness of the environment around the well [35, 36]. In line with [37] revealed that sources of nitrate pollution in water generally come from industrial waste, septic tanks, animal waste, and water transportation waste, which greatly affect the health of the community's clean water consumption.
The results of laboratory measurements of Nitrate content as N, organic matter (KMnO4) and CaCO3 hardness of residential well water do not show an excess of the maximum threshold for consumptive water quality standards required by Minister of Health Regulation Number 32 of 2017 as shown in Fig. 4 which shows the upper part of the Cikapundung riverbank area in the Kampong Pelangi settlement (Dago Village) showed a Nitrate as N content of around 4.1 mg/L, the measurement results for the KMnO4 value were 0.73 mg/L, and the content of the CaCO3 hardness value was 93.37 mg/L, in the middle of the settlement Kampong Cimaung (Tamansari Village) the Nitrate content as N ranges from 0.94 mg/L, the measurement results for the KMnO4 value are 1.72 mg/L, and the CaCO3 hardness value is 82.23 mg/L. The results of laboratory measurements and calculations in the settlement area of Kampong Mengger Tengah (Mengger Village) with a value of Nitrate as N ranged from 3.94 mg/L, the measurement results for a KMnO4 value of 1.93 mg/L, and a CaCO3 hardness value of 122.11 mg/L.
Total Coliform Bacteria and Escherichia Coli
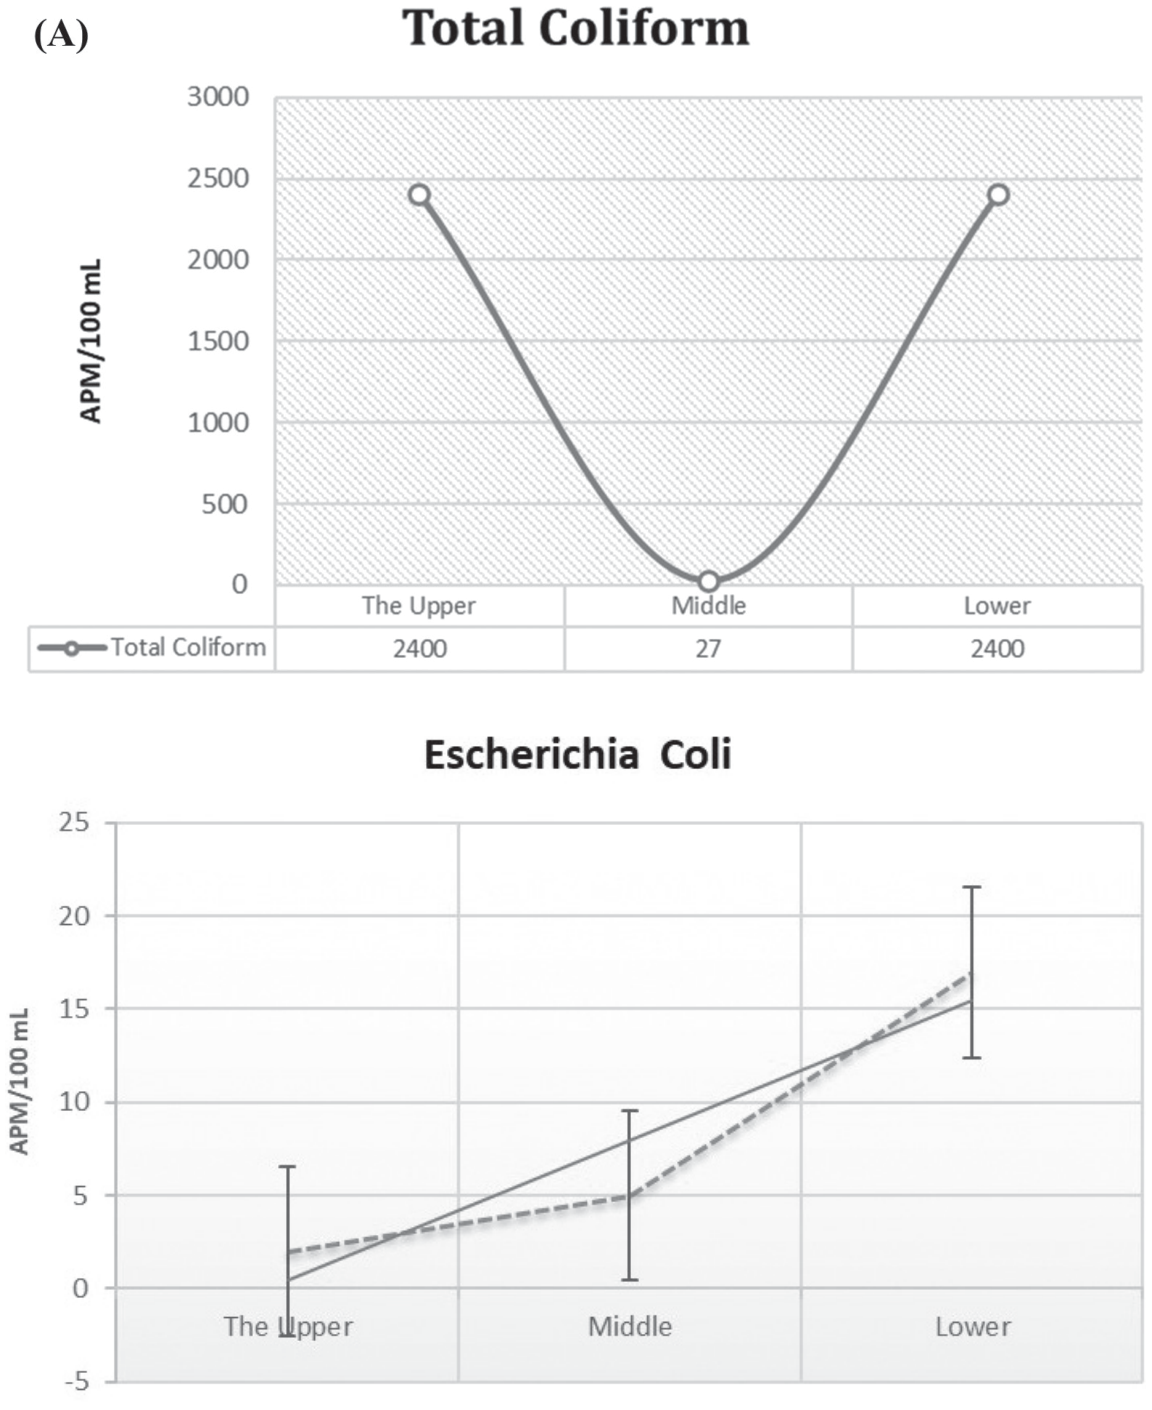
The results of measurements of total Coliform and Escherichia coli show that in the observation of residential consumptive well water, there is a tendency to increase due to domestic activities in the vicinity. According to [38] and [39], high Total Coliform counts can occur due to high contamination of pathogenic bacteria originating from the digestive tract of humans and animals and other pathogenic agents. The results of measurements of total coliform and Escherichia coli at the water well research location in Kampong Pelangi settlement (Dago Village), the central part of Kampong Cimaung settlement (Tamansari Village), and Kampong Mengger Tengah (Mengger Village), as shown in Fig. 5.
The results of laboratory analysis showed that the quality of well water in densely populated slum settlements in Bandung City contained total coliform and e. coli there is an increase in the value exceeding the maximum threshold for consumptive water quality standards required by the Minister of Health Regulation Number 32 of 2017. So the water conditions of residential wells are based on the World Health Organization (WHO) guidelines, European Commission (EC) standards, and U.S. Environmental Protection Agency (USEPA) standards. For the quality of bacteria (Total Coliform and Escherichia coli), they must not be detected in water, especially when the capacity exceeds the environmental quality standard threshold for water. The general requirements for drinking water specify that total coliforms should not be detected in 100 mL samples, indicating the absence of coliform organisms and Escherichia coli bacteria [40, 41]. This is due to the high levels of waste disposal (septic tanks) in dug wells which are no more than 2-3 meters from the water sources of residential wells plus the lack of order and narrow distances between settlements [42].
Pollution Index
The Pollution Index Method is an index-based method built based on two quality indices. First, the average index (IR) shows the average pollution level of all parameters in 1 (one) observation. Second, the maximum index (IM) which shows one type of dominant parameter causes a decrease in water quality in one observation. The results of calculating the comparative value of the analysis results with the water quality standard values can be seen in Table 4.
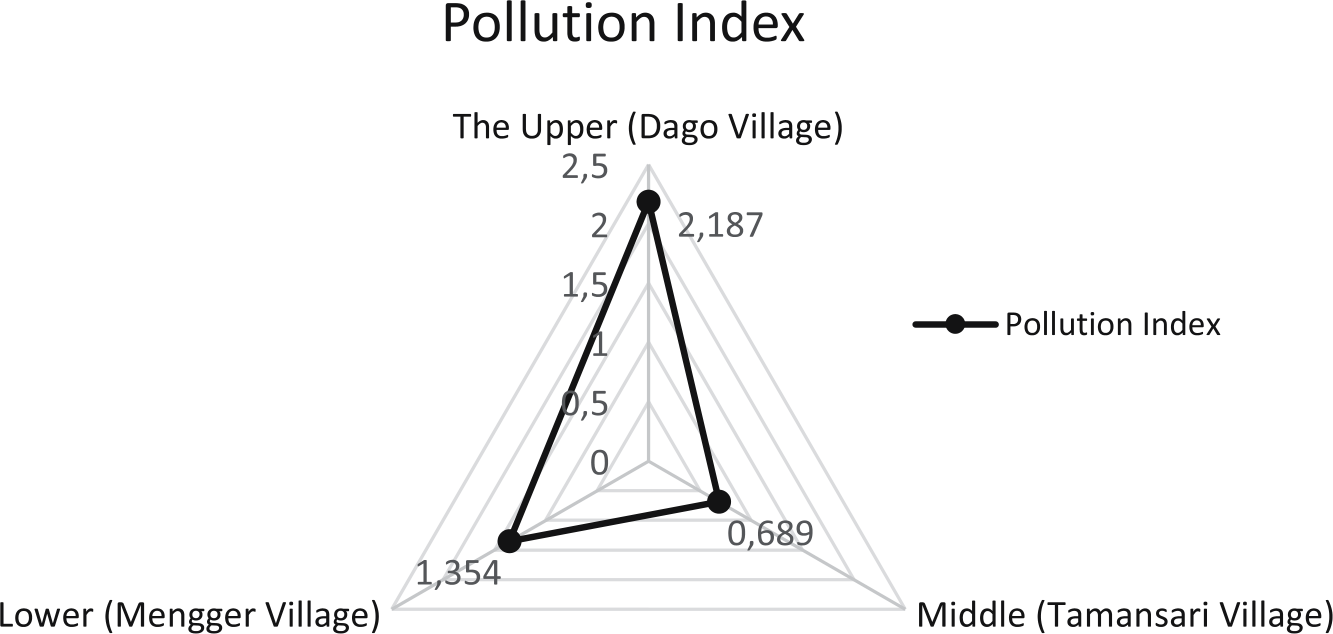
Table 4 shows that the Groundwater Pollution Index (IPj) score around the densely populated slums of the City of Bandung at the top is 2.187, the middle is 0.689, and the bottom is 1.354. The Upper, Middle and Lower Sections have a total escherichia coli value of 2-5 APM/100ML but the IPj values obtained are 0.689-2.187 (1.1 – 5.0) so they are still in good condition and are lightly polluted. Based on Minister of Health Regulation Number 32 of 2017 concerning Water Quality Status, Pollution Index values with an IPj score of 0 – 1.0 are categorized as meeting the Quality Standards. This is because in the middle part there are no parameters that exceed the quality standards in the well water quality samples. At the top and bottom IPj values 1.1 – 5.0 are categorized as lightly polluted due to several factors, such as locations too close to septic tanks of microorganisms in waters, household waste, industry, and waste management sites [43, 44].
Table 4.
Summary of Pollution Index Results.
| No | Consumptive Well Water | Pollution Index | Information |
|---|---|---|---|
| 1 | The Upper | 2.187 | Light Black |
| 2 | Middle | 0.689 | Good Condition |
| 3 | Lower | 1.354 | Light Black |
Based on the results of the pollution index, the best steps are needed regarding the importance of using consumptive residential water, especially in minimizing the condition of water that is classified as lightly polluted in well water, by first carrying out processing techniques so that it is suitable for drinking water. Processing can be done physically or chemically (Fig. 6). Physical processing can be done by using certain filters to filter out polluted levels and suspensions in the water. However, physical processing requires quite expensive costs, such as filters that are widely traded [45]. Therefore, chemical processing can also be done, for example, the use of alum and capolrit. The use of coagulants is very easy and cheap [46]. So that it becomes the basis of environmental management [47, 48].
Conclusions
Residential well water quality in terms of physics, organic chemistry and an organic parameters does not show severe pollution because the polluted level does not exceed the maximum threshold for environmental quality standards required for environmental health quality standards for drinking water media for hygienic sanitation purposes based on Minister of Health Regulation Number 32 of 2017. Results On the contrary, the actual water quality of wells in densely populated slum settlements in Bandung City is classified as heavily polluted, indicated by microbiological parameters that have exceeded the quality standard, namely total coliform of 2400 APM/100 mL, and Escherecia Coli of 2-17 APM/100 mL. From the results of the Pollution Index (IP), it can be concluded that the status of consumptive water quality is 2 (two) Parts which are categorized as Light Polluted and 1 (one) Part is categorized as Meets Quality Standards. The middle section of consumptive well water with the category of meeting quality standards. Meanwhile, the upper and lower sections are categorized as lightly polluted.

