

Introduction
Energy and environmental challenges are escalating and are a major concern for nations globally. The trilateral relationship among energy demand, detrimental gas emissions, and economic advancement underscores their interdependence. As a result, these issues have emerged as paramount on the global agenda. According to the World Resources Institute, the transportation sector accounted for the third-largest share of carbon dioxide (CO2) emissions in China in 2021 [1]. Automobiles are the major contributor to total pollutant emissions, producing more than 90% of carbon monoxide, hydrocarbon, nitrogen oxide, and particulate matter emissions in 2021 [2].
EVs have revolutionized conventional combustion-based vehicles by replacing fuel with electricity, thereby achieving “zero emissions” during operation without generating harmful gases [3]. By mitigating vehicular emissions, EVs play a pivotal role in addressing both the overconsumption of petroleum resources and the existing dilemmas concerning transportation, energy, and ecological preservation. The global ascent of EVs has prompted nations to vigorously advocate this ecologically conscious automotive alternative.
The EV program was promoted relatively late in China, and it has not benefited from the rapid development of EVs that briefly occurred in Europe in the 19th century. In order to boost the development of EVs in China, the government implemented a number of promotion policies. Therefore, the number of EVs in China has shown significant growth recently, especially in the large cities where there are relatively strict purchase restriction policies.
Since September 2013, the Chinese government has rolled out a series of subsidy schemes, such as a purchasing subsidy, exemption from vehicle purchase tax, vehicle purchase restrictions, free parking, and so on. Combined with the corresponding subsidy policies of various local governments, the EV market is gradually becoming more active; thus, in 2016, China was able to surpass Europe and the United States to become the world’s leading EV market. The annual sales volume of EVs has exceeded 1 million since 2018, showing a rapid growth trend [1].
Despite the rapid development of China’s EV market and the obvious effect of a series of subsidy plans, the sales volume of new energy vehicles has still failed to meet the expectations of the Chinese government. In 2016, there was a notable downturn in the growth rate of EV manufacturing and sales, which was followed by a brief period of stability. But in 2019, both started to grow negatively [2]. The Chinese government started to remove the EV subsidy in 2019; as a result, sales volumes declined in that year. This showed that the growth was not entirely the result of competition between EVs and fuel vehicles and users’ independent choices. The subsidy policies for EVs, and limiting the licensing of fuel vehicles in some cities, have also played very important roles. In April 2020, the General Office of the State Council of China decided to extend the implementation period of the financial subsidy policy to promote the sales of EVs until the end of 2022. As a result, the sales volume of EVs in 2021 was 3.3 million, accounting for 16% of the total vehicle sales [1].
It indicates that variations in consumer preferences among nations may account for different preferences for EVs, such as the recharging time, running cost, emission level, and driving range. For example, a study by Inci et al. [4] stated that consumers preferred a shorter recharge time to a longer driving range in Istanbul. Abotalebi et al. [5] found that consumers preferred a longer battery warranty period to a short recharging time in Canada. Most studies in China have focused on incentive policies that require massive financial expenditure and pay less attention to EVs’ own attributes [6-8]. To meet the gap, it is necessary to further examine consumers’ preferences for EVs. This research is the first study to focus on EVs without any policies and test vehicle size and seats, which have not been investigated before in China. The National Health Commission of China issued the policy of relaxing the two-child restriction in 2016, which means that Chinese families have new requirements for vehicle sizes and seat numbers.
The primary objective of this study is to investigate consumer preferences and willingness to pay (WTP) for EVs, with the aim of developing policy recommendations. Additionally, the study aims to analyze the influence of socio-demographic factors on consumer preferences for these attributes. The study employs the CE approach and subsequently utilizes the CL and MXL models for data analysis. By examining consumer preferences, WTP, and the impact of socio-demographic factors, the study seeks to provide valuable insights for designing a compelling marketing mix and related management strategy. Furthermore, manufacturers can recognize the main needs of their target consumers and improve the design of EVs and related marketing strategies.
The study is structured into different sections to address specific aspects. Literature Review section presents a comprehensive overview of the current research on EVs using the CE method. Next, Experimental Procedures section provides detailed explanations of the CE design, data collection methods for stated preferences (SP), and the analytical framework based on the CL and MXL models. Results and Discussion section then focuses on the estimation and simulation results, analyzing consumer preferences and their WTP. Lastly, in Conclusions section, a summary of the findings is presented, along with policy implications and recommendations for further research.
Literature Review
At present, one of the important reasons for countries to promote EVs is to reduce the consumption of fuel, reduce exhaust emissions, and protect the environment. Therefore, EVs have been examined as non-market goods, and their non-use value has been assessed [9]. Economic studies typically employ stated preference (SP) data rather than revealed preference (RP) data for the purpose of estimating model parameters. RP data often exhibits limited variability in attribute ranges such as charging time and suffers from multicollinearity issues among vehicle attributes such as price and driving range [10].
Furthermore, SP surveys offer the advantage of allowing researchers to examine how consumers might respond to potential policies and regulations, even before their implementation [11]. In SP surveys, each product is presented to consumers with a defined set of fundamental attributes that are expected to significantly influence their choices. The CE method and the contingent valuation method are the two main approaches for SP [12].
The CE method, which is a main method derived from SP, stands out as the predominant approach in economic research, closely aligned with the theory of utility maximization. The CE approach has numerous benefits, when compared with other valuation techniques. Accordingly, numerous studies have investigated the advantages of EVs and found that this feature of EVs has a positive impact on consumers’ WTP [7]. Hence, EVs have garnered escalating interest within the transportation realm due to their potential to mitigate environmental concerns, notably greenhouse gas emissions, when juxtaposed with conventional fuel vehicles.
It is suggested that consumers’ WTP for EVs may be related to three areas: product and service attributes, government policies, and consumer psychology [6]. Many countries are making efforts to encourage consumer adoption of EVs by offering subsidies and other policies. However, as high monetary subsidies are not sustainable in the long run, it is increasingly important to analyze EVs’ own attributes; these are often considered crucial, as they directly impact consumers’ experiences of owning and driving EVs. The attributes encompass various factors, such as driving range, driving performance, cost, and warranty period. Thus, understanding and improving these attributes can greatly influence consumers’ perception and satisfaction with EVs and ultimately increase their willingness to pay for EVs.
Purchase Cost and Operating Cost
The purchase cost of EVs is relatively high compared with fuel-powered vehicles; this is mainly due to the high cost of power batteries. Specifically, purchase price and operation cost were found to have a negative effect on EV adoption. According to Inci et al.’s [4] study in Istanbul, the purchase price of EVs will continue to be considered too costly unless people adopt a heightened environmental awareness that motivates them to pay the price difference. Plötz et al. [13] found that lower operating costs are more important for consumers who frequently make long journeys, while those who primarily drive shorter distances may not experience significant savings. This suggests that the economic advantage of EVs may vary depending on individual driving patterns.
Furthermore, Hoen and Koetse [14] reported that the additional purchase cost of an EV may only be equivalent to the energy savings achieved over a period of five years. These findings imply that while lower operating costs have the potential to bring long-term economic benefits to consumers, these benefits may not be immediately evident, and they may not have a significant impact on the decision-making process for certain consumers.
Driving Range
It has been found that a longer driving range positively affects consumers’ choice of EVs [15, 16]. It was argued that EVs’ limited driving range is a significant barrier to consumer adoption. Consumers exhibit high sensitivity to driving range due to two main factors. Firstly, the need for long-distance travel plays a crucial role. Consumers often focus on the range of EVs because they perceive an inability to meet their long-distance travel requirements [17]. Secondly, people tend to have high mileage expectations, which currently often exceed their actual needs. This is primarily driven by their familiarity with traditional vehicles, which typically offer a longer range, leading to high mileage expectations for EVs [16].
Charging Time
Moreover, the charging issue of EVs has been widely recognized as a significant technical barrier to consumer adoption. It primarily encompasses two key areas: charging time and charging infrastructure. A shorter charging time will encourage consumers to purchase EVs [18-20]. In terms of charging facilities, Sica and Deflorio [21] identified the significance of workplace charging viability and the density and positioning of public charging stations in enhancing consumer acceptance of EVs.
Battery Warranty and Seats
The warranty on EV batteries is a crucial factor influencing consumer choice. It indicates that consumers’ desire to embrace electric vehicles is positively impacted by longer and more comprehensive battery warranties [5, 12]. Customers’ worries about possible battery-related problems can be allayed by a strong battery guarantee, giving them confidence in the EV’s long-term survival. Similar to seats, more seating capacity supports a wider range of utilization scenarios, including family vacations and carpooling, and is frequently linked to more adaptability [22].
Other product and service attributes, such as top speed, safety, vehicle type, emissions, silence, etc., have also been found to influence purchase intention [23-26]. With the development of technology, the technical level of EVs will be constantly improved; thus, the impacts of these product attributes are very important for technical development and policy formulation.
Experimental Procedures
Merino-Castello [27] stated that by requesting participants to evaluate one or more hypothetical scenarios in survey settings, an SP experiment aims to capture consumers’ preferences and assess their WTP for various productions and services. Various methods can be employed to carry out SP research, including contingent valuation, contingent ranking, contingent rating, paired comparison, and CE [28]. This study utilizes the CE approach, in which consumers were presented with different profiles, and they made choices between these alternatives by comparing the attributes of each option through a utility structure.
We adopted the approach outlined by [28] to apply this technique, which involves a sequence of steps, including identifying the attributes and levels related to EVs, designing experiments, creating questionnaires, defining the sample size, and performing data analysis.
Model Specifications
The principles of the CE method are based on the characteristic theory of value by Lancaster (1996) and the random utility theory proposed by McFadden [29] in 1974. Random utility theory assumes that respondents are rational people and will choose the product with the greatest utility. The most important core idea of the CE method is to transform the study of WTP into that of utility maximization by using random utility theory and the constructor model.
Random utility theory explains that the unobservable utility is represented by a random variable consisting of both an observable or systematic component and a stochastic element. Train [30] stated that the utility U, which a respondent n assigns to alternative i from a specific choice set J, can be described as:
Vnij represents the deterministic part, while εnij denotes the stochastic part, Xij means the visible attributes for alternative i’s attribute value, and β is the preference parameter for the matching attribute. Therefore, Eq. (2) represents choice probability Pnij as follows:
Hausman and McFadden [31] provided different models based on varying assumptions about utility functions and the distributions of their randomness; the CL model is the most commonly used one, due to its simplicity. CL offers a straightforward closed-form solution for potential choice probabilities, eliminating the need for multivariate integration. Supposing that ε is distributed independently and identically according to a Type I extreme value distribution, then the probability of respondent n selecting alternative i in choice situation j can be expressed as follows:
Train [32] proposed that the CL model exhibits some limitations, including the assumption of homogeneous preferences and independence from irrelevant alternatives (IIA). To address these issues, researchers may explore alternative models, such as the latent class model [33, 34] or the mixed logit model [35]. We utilized the MXL model, which integrates the diversity of consumer preferences as a continuous distribution and alleviates independence from the IIA assumption.
The probabilities in the MXL model are represented as integrals of CL probabilities, considering the assumed continuous distribution function of β, denoted as f (β).
The marginal willingness-to-pay (MWTP) is a further meaningful insight to be obtained from the estimated parameters, which can be indicated by β. Wald tests with standard errors calculated using the Delta technique are used to assess the significance of WTP results [36]. The MWTP explains how much consumers are willing to pay for an attribute. Train [32] suggested that the MWTP can be expressed by dividing each attribute’s coefficients by the price attribute’s parameter estimate.
Where βn is the coefficient of each attribute and βprice is the coefficient of price.
Consequently, we used the NLOGIT 5.0 software to conduct the estimations in this study.
EVs’ Attributes and Levels
Attributes represent characteristics or features of alternatives, while attribute levels signify the numerical or qualitative worth of the attribute in a provided alternative. An “alternative” is a combination of two or more attributes. A group of alternatives provided to individuals is called “a choice set”. In a CE, respondents are requested to choose their favorite alternative from a choice set [37].
According to Wicki et al. [20], the EVs’ own attributes, such as “purchase cost”, “driving range”, “charging time” and “operating cost”, are usually presented. In order to increase the authenticity of the choices provided to consumers, some supplementary attributes such as “‘battery warranty period”, “vehicle size”, and “emission” were introduced [7, 23, 25]. Next, two focus group discussions were conducted with consumers and one online interview with Xiaopeng Company, which was an expert in producing EVs in China. They aimed to address the most related features and their levels in the EV industry. The final EVs’ attributes and levels are shown in Table 1.
Experimental Design
The study focused on designing effective choice sets for the experiment. Five attributes were considered for the EV, resulting in 144 option sets through random combinations (3 × 2 × 2 × 3 × 4). To ensure practicality, an orthogonal fractional factorial design was adopted, using the Statistical Package for Social Sciences (SPSS) to create choice cards. This led to the development of 16 option sets for the EVs, which were then combined into eight choice cards. To reduce overlap and increase diversity, a third choice was introduced in each question, allowing respondents to choose neither option. Consequently, each choice card presented three alternatives for the respondents to select from. Each respondent was requested to make eight choices.
Table 1.
EVs’ attributes and levels.
Questionnaire Design
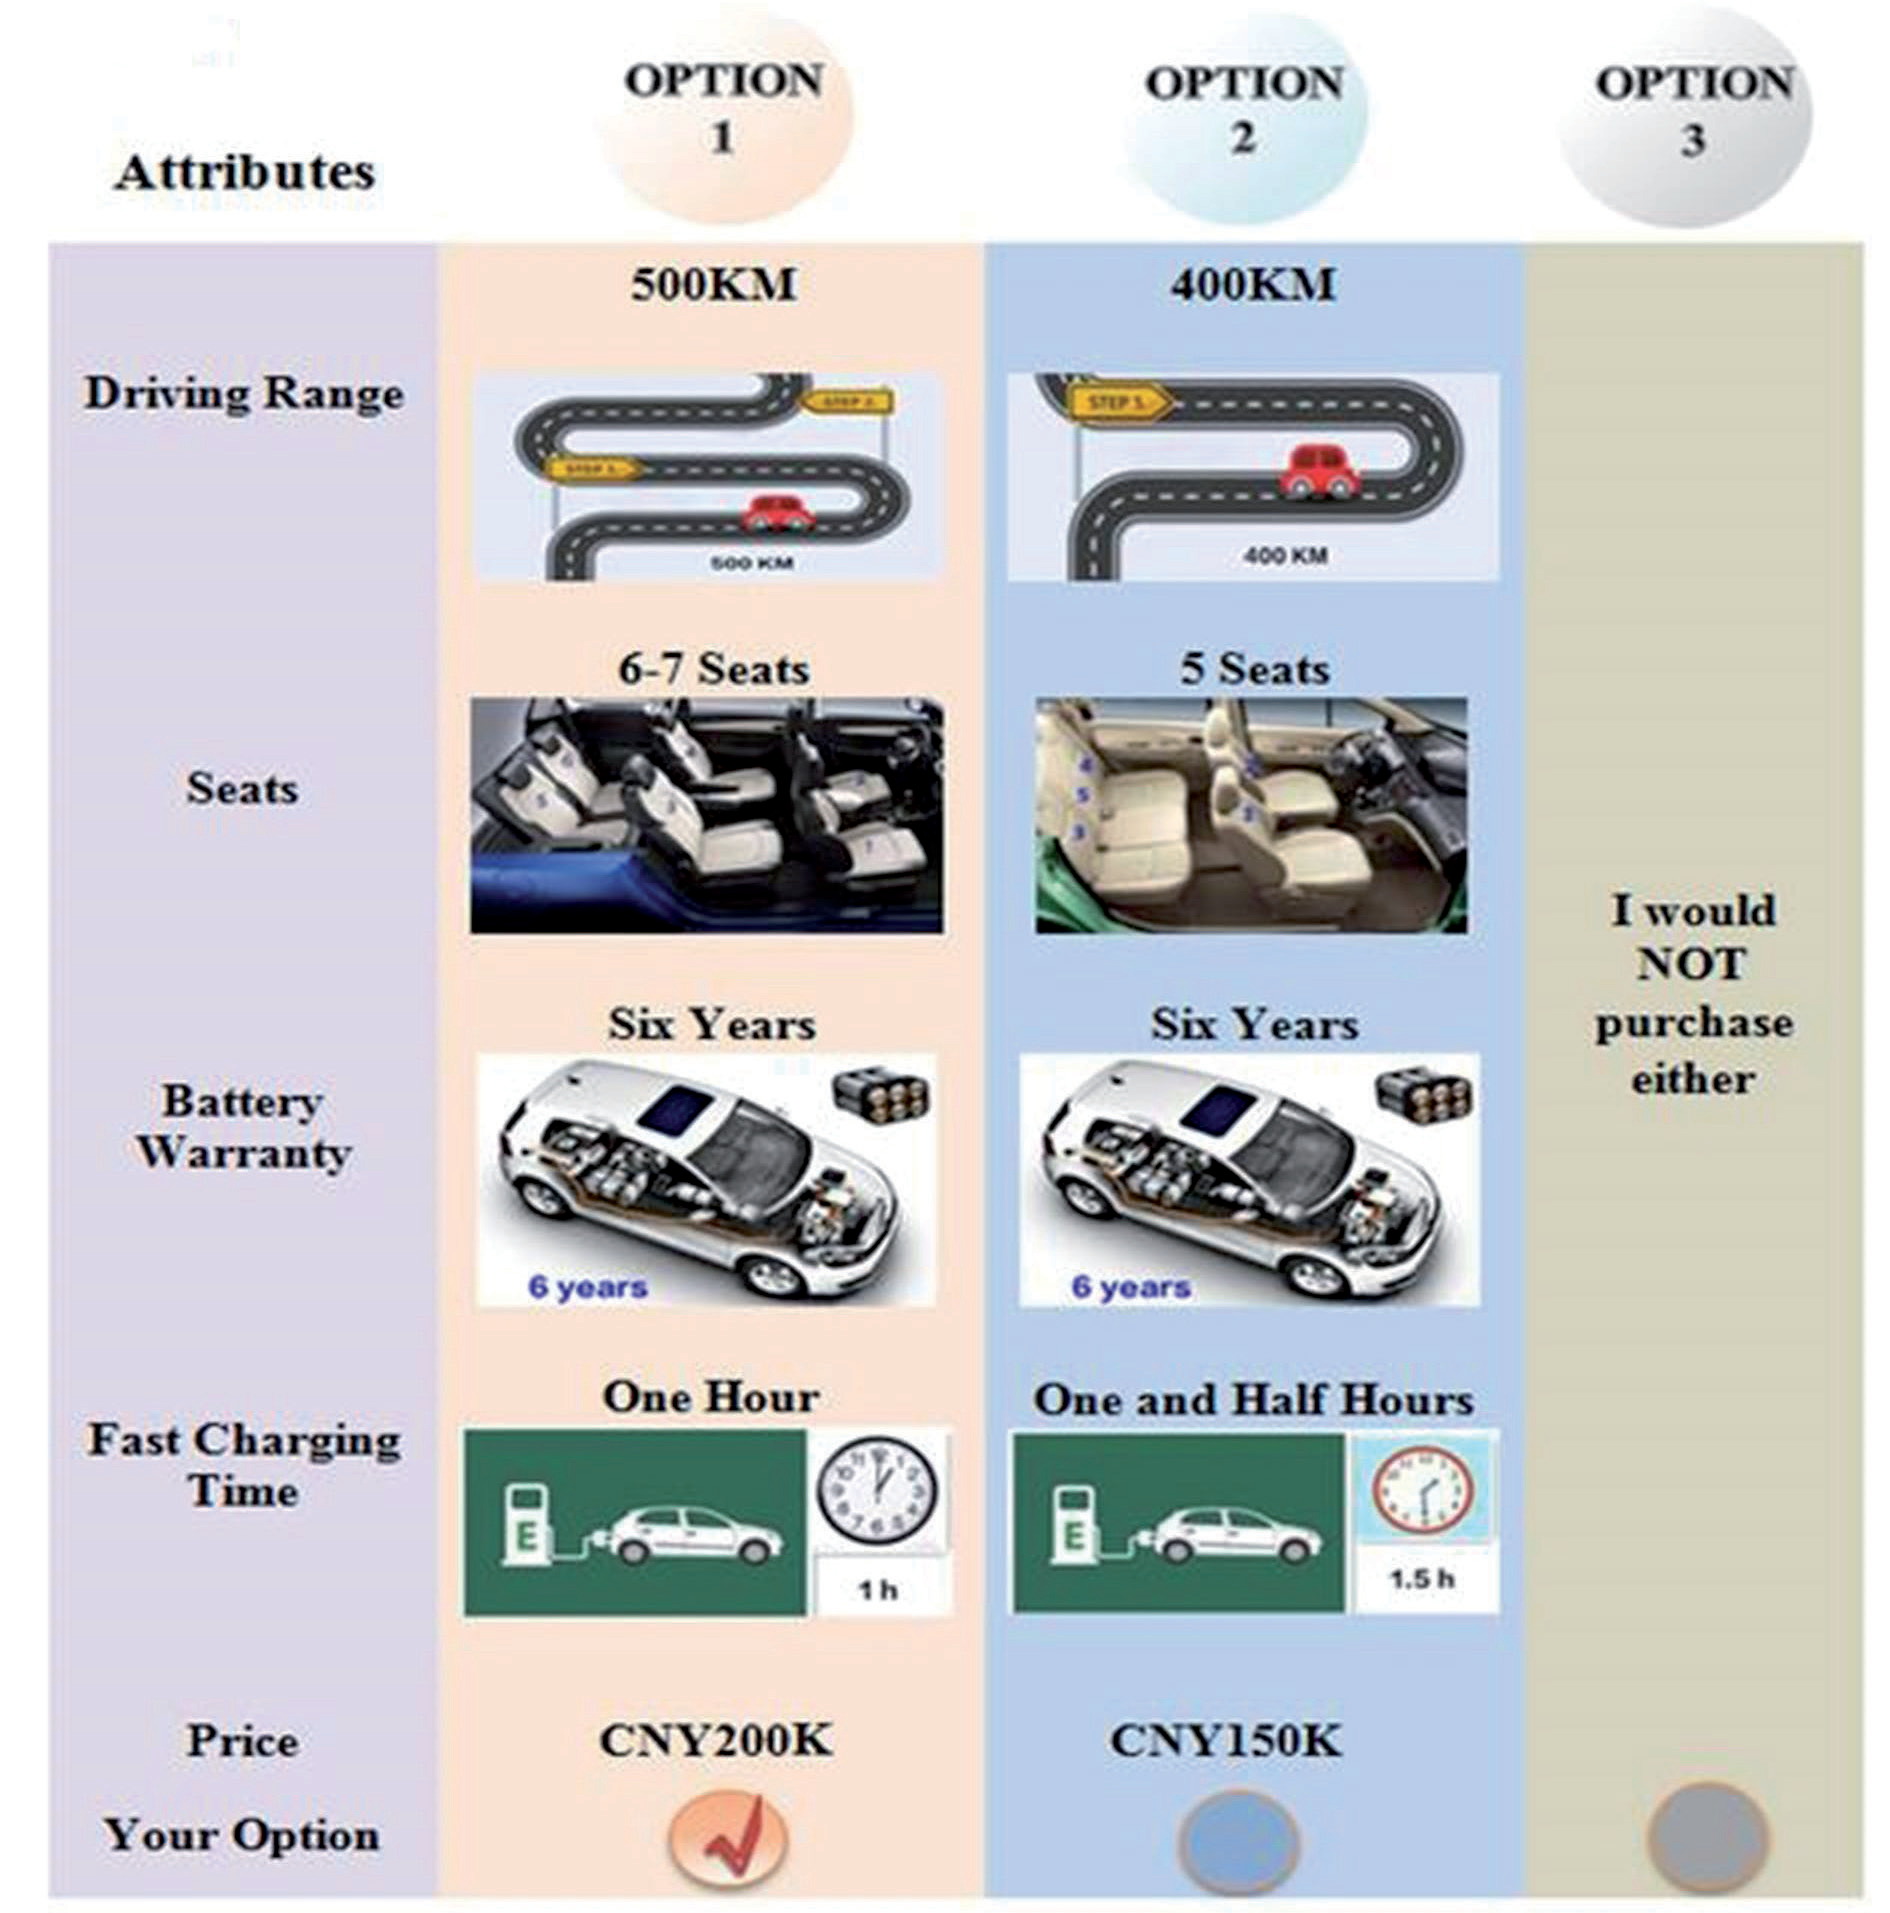
Following Hensher et al. [38], this survey is structured in three sections: an introductory segment explaining the purpose of the questionnaire and the attitude and perception of EV. The following part, referred to as the “CE”, incorporates choice cards. This segment provides a concise explanation of the CE technique and its respective levels. Subsequently, consumers were instructed on the rules of the CE, and an illustrative choice card example was offered, as depicted in Fig. 1 below. The last part concerns socio-demographic questions. By strategically positioning the substantive investigation questions ahead of the respondents’ demographic information, we enabled participants to tackle challenging queries before they felt fatigued or less motivated to respond. This sequencing ensured a more comprehensive and thoughtful approach from the respondents.
Referring to Fig. 1, there are 3 scenarios, including two types of EV and another situation without any. If you would like the EV that has a price of CNY200K, a driving range of 500km, 6 seats, a battery warranty period of 6 years, and fast charging at 1 hour, you should choose Option 1. But if you would like the EV that has a price of CNY 150K, a driving range of 400km, 5 seats, a battery warranty period of 6 years, and fast charging at 1.5 hours, you should choose Option 2. If you do not like any of them, you should choose Option 3. (Please notice that you can choose only one option).
Sampling and Data
We employed a convenience sampling method and face-to-face interviews when distributing our questionnaire survey between October and November of 2022, frequently on weekends and holidays. The survey was conducted within the main shopping malls (Wanxiang City and Wanda Plaza) in Shandong Province, which had the highest number of privately owned automobiles in China in 2021 [2]. Our target audience consisted of consumers from China who either already owned a car or had intentions to purchase one in the near future.
Before commencing the formal research, we enlisted five experts from Shandong University and Shandong University of Finance and Economics for a pre-test and 30 volunteers to participate in a pilot study. The primary objectives were to estimate the time required for completing the questionnaire and to identify and rectify any potential issues with the questionnaire design.
Johnson et al. [39] suggested a guideline for estimating a suitable sample size for the CE method. Where N is the sample size, H is the highest number of levels for any attribute, A means the alternatives on the choice card (excluding the choice of “None”), and C is the number of choice questions per respondent.
The minimum sample size of the study is 125. Finally, 355 respondents participated in our comprehensive survey.
Based on the insights from the pre-test, we found that respondents needed more than 200 seconds to provide thoughtful responses to the questionnaire. As a result, we retained only those questionnaire samples that took more than 200 seconds to complete. Eventually, we obtained 330 effective questionnaires, achieving a remarkable survey recovery efficiency of 92.9%.
Results and Discussion
The data were examined to assess consumers’ preferences and WTP for EVs in Shandong. The findings are presented as follows: we analyze the respondents’ socio-demographic characteristics and conduct estimations for basic models, encompassing both the CL and MXL models. Then, we extend these models to account for interactions with consumers’ socio-demographic traits and finally evaluate WTP in relation to EVs’ attributes.
Respondents’ Socio-demographic Characteristics
Table 2 displays a basic statistical outline of the social and demographic attributes of the consumers. Corresponding to the prevalence of male drivers in China, male participants constituted 55.2%, notably surpassing the percentage of female participants. A majority of 73.8% of the participants fell within the age range of 26 to 45 years old, indicating a concentration among the young and middle-aged population. Given that this age group constitutes the primary car-buying demographic, the results are expected to have high validity.
The sample exhibits a relatively high level of education and income. A substantial 54.9% of the respondents reported holding a bachelor’s or higher degree. This is primarily due to the significant representation of participants from Shandong, which is known for higher education. Respondents whose families had three members constitute 34.7%, followed by those with four (31.93%). Most of the parents had only one child. This reflects the situation in China, as the “one child” policy was adopted from 1980 to 2016.
Table 2.
Respondents’ socio-demographic characteristics.
Table 3 shows the analysis of consumers’ opinions on a 5-point scale. It indicated that respondents cared about environmental problems. For the statement “I believe my purchasing of EVs is helpful for the environment”, 35% of the respondents agreed with it, and 19% chose “strongly agree”. It indicated that most of the respondents cared about environmental issues and believed that EVs were helpful to the environment. Meanwhile, 21% of the 330 respondents strongly agreed, and 40% of them agreed that the EV would develop well in the future.
For subsidy policy, 31% of the respondents strongly agreed, and 33% of them agreed with the current subsidy of EV. But when the subsidy was canceled, 41% of the respondents strongly agreed and agreed that they would consider buying them. It showed that the subsidy policy still has a significant impact on whether people choose to purchase EVs or not.
Basic Conditional and Mixed Logit Models
To assess the efficacy of the models, we employed the basic CL model and the basic MXL model. The outcomes and findings of these models can be found in Table 4, which shows that the coefficients associated with all attributes exhibit strong statistical significance in both models; except CHARG2, which is not significant. The attribute of price has a negative sign, significant at the 1% level. The signs of all the attributes align with expectations. Additionally, the coefficients for these attributes are at lower rather than higher levels. The attribute of number of seats, which was paid the most attention, had a positive sign and was significant at the 1% level, as expected. This explains why consumers preferred 6–7 seats in EVs. The largest coefficient reported by consumers was BATT2, meaning “battery warranty period”, is the most crucial attribute for consumers.
Furthermore, within the MXL model, all EV attributes exhibit a normal distribution and are designated as random factors. However, the distribution of the price was non-random. The assessment of standard deviation within the MXL model points to the presence of diverse preferences among participants for each attribute, excluding DAGNG2 and CHARG2, due to their insignificant coefficients. Table 4 explains the good fits of the basic CL and MXL models. The pseudo-R2 of the CL model is 0.08, which is improved to 0.2 by the MXL model. This demonstrates the MXL’s more precise specification due to its incorporation of consumers’ diversity and superior fit compared to the CL model.
Table 3.
The perception and awareness toward EVs.
Table 4.
Results of basic CL and MXL model results.
Table 5.
Results of the CL and MXL interaction model results.
Conditional and Mixed Logit Interaction Models
The CL and MXL interaction models can incorporate the interactions between consumers’ socio-demographic characteristics and EV attributes. These interactions are able to explain the factors contributing to heterogeneity in preferences and improve its fitness. Additionally, they can help to relax the independence of the IIA assumption.
Table 6.
Results of marginal WTP for basic models.
Table 7.
Results of marginal WTP for interaction models.
There are 30 interaction variables incorporated in the interaction model. Firstly, it analyzes all the interaction variables to delete all the insignificant variables. Then, it repeats this step until all the interaction variables are significant. Finally, it identifies the final significant variables and main attributes, which are reported in Table 5.
The Pseudo-R2 of the CL and MXL interaction models have improved to 0.09 and 0.21, compared with 0.08 for the basic CL model and 0.20 for the basic MXL model. The results of the two models are similar. Firstly, the coefficient for the price attribute is negative and significant, while those for CHARG2 and CHARG3 are insignificant. Secondly, the coefficients of DRANG2 and BATT2 are significant at the 1% level, and those of DRANG3 at the 5% level. Finally, only the coefficient of SEAT2 is different: it is significant at the 10% level in the CL interaction model, but declines to insignificant in the MXL model. This can be described by the interaction with the consumers’ socio-demographic characteristics.
Furthermore, the coefficients of the statistically significant interaction variables are collected. The coefficient of DRANG2_GEN presents a negative sign, which suggests that female consumers prefer EVs with a medium driving range (500km). The coefficient of DRANG3_AGE presents a positive sign, indicating that older consumers favor EVs with the longest driving range (600km). The coefficient of SEAT2_EDU is negative, while SEAT2_INC is positive, which suggests that lower-educated and high-income consumers prefer EVs with 6 or 7 seats. The positive signs of BATT2_EDU and CHARG3_EDU indicate that well-educated consumers favor EVs with 6 or 7 seats and the shortest charging time (40 min).
Willingness-To-Pay
Table 6 and Table 7 present the WTP for various EV attributes. The determination of WTP for the model involves dividing the attribute’s coefficient by the absolute magnitude of the coefficient related to the EV’s buying price. The outcome is then multiplied by 1000, given that the purchase price is represented in thousands of yuan. Table 6 shows the results of the basic CL and MXL models. The findings from MXL indicate elevated estimates for WTP across all attributes, compared to those generated by the CL model. Positive and statistically meaningful economic values are observed for attributes related to EVs. Particularly noteworthy is the substantial WTP associated with the highest tier of each attribute, as demonstrated in the findings. The highest WTP is related to the attribute of battery period, at CNY1,141,580, followed by driving range (DRGANG2 and DRGANG3).
The coefficient patterns in Table 7 demonstrate identical trends for the variables. DRANG2_GEN and SEAT2_EDU are negative, while DRANG3_AGE, BATT2_EDU, CHARG3_EDU, and SEAT2_INC are positive. The outcome indicates that education has a positive influence on WTP for enhancing battery warranty periods and reducing charging time, but negatively affects WTP for increasing the number of seats in EVs. Regarding the interaction outcomes for WTP, it was found that females and older people are willing to pay more for driving range, and well-paid people are more willing to pay for EVs with 6 or 7 seats. The results provided a specific contribution by analyzing diverse demographic influences, exploring novel insights, and establishing meaningful connections between EV preferences and other implications.
The findings regarding WTP suggest that respondents are willing to invest in improving critical aspects of EVs, even though their preferences for specific attributes vary. The highest WTP observed in this study pertains to the battery warranty attribute, amounting to CNY1,141,580. Abotalebi [5] reported a WTP of US$3,937 for a better battery warranty when the purchase price was $1,000. WTPs for driving range and charging time have been frequently examined in prior literature. For instance, Inci et al. [4] estimated that consumers were willing to pay US$20.7 per kilometer to extend the driving range. Additionally, the WTP for reducing charging time was $258 per minute in Istanbul. These findings are consistent with those of Hackbarth and Madlener [40], who reported a WTP for driving range ranging from US$14.5 to US$151 per kilometer, and a WTP for reduced charging time of US$233 per minute in Germany. Noel et al. [41] found that WTPs for improving driving range were approximately €150/km and €5,600 per hour for reducing charging time across Denmark, Finland, Iceland, Norway, and Sweden.
In China, Qian et al. [8] indicated that WTP for driving range was about CNY587 per additional kilometer, and CNY2,424 per minute of reduced charging time. Ma et al. [42] found that high WTP values were related to enhancements in driving range and charging time attributes. The WTP for an extra 50 km of driving range was CNY25,055, while an additional 100km produced a marginal WTP of CNY29,540. The WTP for a shorter charging time was CNY16,004 per hour. Furthermore, Li et al. [7] found the WTP for driving range was CNY49,091 (200km), while the WTP for reducing charging time was CNY12,727 per 5 minutes. The results of this study show that the respondents’ WTP for charging time is similar to other studies, while the WTP for driving range is higher than others.
Conclusions
The transport sector is increasingly focusing on EVs due to their ability to mitigate environmental concerns, such as reducing greenhouse gas emissions, in contrast to conventional fuel-powered vehicles. This research investigated consumers’ preferences and WTP for EVs in China. The results of the basic model showed that all the attributes of EVs had positive impacts, except price, which had a negative impact. Moreover, the findings remained consistent across different estimation techniques, which underscored consumers’ WTP, while they expressed a preference for EVs with six or seven seats. It added six or more seats as an attribute that has not been extensively explored in previous studies. It provides a new perspective for understanding and meeting consumer needs. The consumers were willing to pay the highest amount to improve the EVs’ battery warranty, followed by increasing the driving range. Additionally, the results revealed that female and older consumers preferred a longer driving range. In addition, lower-educated and high-income consumers preferred EVs with six or seven seats, while well-educated consumers preferred a longer battery warranty (eight years) and the shortest charging time (40 min).
Consumers have the ability to articulate preferences regarding EVs, which can provide vital insights for policymakers. The advancement and acceptance of EVs have contributed to the accomplishment of Sustainable Development Goals 7. They not only lessen reliance on conventional energy sources but also provide more sustainable and ecologically friendly modes of mobility. China played a major role in the global sustainable development agenda, which is shown in its commitment to sustainable development.
The results based on CE analysis showed that among all the attributes that were used to characterize the EVs, improving battery lifetime and driving range obtained the highest WTP values. Thus, manufacturers can efficiently allocate budgets to develop battery and driving range to meet consumers’ preferences. Furthermore, despite the gradual reduction of government financial subsidies, the government can play a leading role, as demonstrated by the prioritized adoption of EVs in the current fleet of public and government vehicles. Simultaneously, there should be continued efforts to further enhance the development of supporting public infrastructure for EVs.
In addition, based on the MXL and CL interaction models’ results, education, gender, and age have different impacts on consumers’ preferences for EVs. In particular, strategies could be formulated to focus on demographic segments with lower willingness. For example, education exerts important influences on consumers’ preferences regarding EVs. More specifically, strategies could be devised to target less receptive groups, emphasizing the significance of specific attributes through educational channels such as schools and universities. This approach aims to heighten awareness within the community and promote their involvement in the EV program.
Finally, it should be noted that the research did not consider brand attributes when designing the CE study. However, with the growing economic strength of China and the current rise of domestic enterprises, an increasing number of Chinese consumers have a strong preference for domestic brands. Therefore, future studies can take this attribute into consideration. Moreover, a fundamental assumption within CE is that survey respondents take into account all the attributes and alternatives presented to them. In certain situations, complex choice scenarios can compel respondents to employ decision strategies in order to avoid making challenging decisions. For example, the respondents could ignore certain attributes when making a choice. Therefore, future research endeavors could delve into the issue of attribute non-attendance to ascertain whether there is any bias in estimating WTP, particularly in studies involving a large number of attributes. Also, it is recommended for future studies to investigate the price sensitivity in order to gain a deeper understanding of the impact of EVs on sales performance and help manufacturers better comprehend consumers’ responses to changes in price.

