

Introduction
The YRB is an ecological security barrier and a vital economic belt in China, and its environmental protection and economic and social development have always been the focus of attention [1]. In October 2019, Chinese President Xi emphasized that the YRB plays an extremely significant role in the economic and social development and ecological security of China [2]. The government issued the plan outline for ecological protection and high quality development of the YRB in 2021, and the Yellow River Protection Law of the People’s Republic of China came into force in 2023 to strengthen its ecological protection. Benefiting from rich natural resources such as minerals, coal, etc., the YRB has formed a series of RBCs, accounting for about 47.0% of the total number of cities in the YRB [3], and about 30% of the total number of RBCs in the country [4]. Therefore, the green transformation of RBCs in the YRB will not only accelerate the sustainable development of the YRB, but also provide reference ideas for green transformation and the high-quality development of other RBCs in China.
RBCs depend on leading industries such as resource extraction and resource processing, have achieved rapid development, and have made historical contributions to the development of the national economy [5]. A Canadian researcher [6] conducted groundbreaking research on RBCs. Follow-up researchers improved the definition of RBCs and carried out a series of investigations around resource-based towns, mining towns, and mining cities [7, 8]. The depletion of resources and the deterioration of the ecological environment have become more and more serious; most RBCs have begun to face development difficulties, and their transformation and development have gradually become the hotspot and focus of research [9]. [10] found that the transformation of RBCs is to optimize the relationship between resource-based industries and non-resource-based industries and finally achieve their balance and green development. However, the transformation of RBCs is a complex system engineering process involving many dimensions such as industrial structure adjustment, resource utilization mode transformation, ecological environment governance, technological innovation, employment, and social security [11]. Focusing on the development goals of RBCs in these dimensions, researchers have carried out a series of studies on the comprehensive evaluation of transformation performance [12, 13]. By constructing a scientific and systematic indicator system and using reasonable indicator weight determination methods, the comprehensive evaluation method can reflect the level of green transformation development of RBCs to a certain extent. However, due to different research perspectives, researchers often construct different evaluation index systems, and there are also certain differences and controversies in research results [14].
The GTE, considering resources and the ecological environment, is a comprehensive evaluation of the green transformation of RBCs. It can truly and systematically reflect the level of green transformation in the city, providing a new perspective and entry point for investigating the transformation effects and development quality of RBCs [15]. Two commonly used methods to measure the urban GTE are Data Envelopment Analysis (DEA) and Stochastic Frontier Analysis (SFA) [16]. SFA tests the significance of variables and has certain advantages in measuring efficiency, but it is only applicable to the evaluation of a single output project [17]. Therefore, it is difficult to apply to the calculation of the GTE of the city’s multi-input and multi-output complex system [18]. The DEA model does not require the determination of functional relationships among decision-making units (DMUs) in advance and has been widely used in measuring the efficiency of multi-input and multi-output projects [19-21]. Based on the DEA model, [15] focused on the transformation efficiency of RBCs in the YRB and found that the transformation efficiency of RBCs in the YRB was not ideal during the study period and needed to be further improved.
It is essential to note that when using traditional DEA models to measure transformation efficiency, there are limitations that do not consider the slackness of input-output variables and undesired output [22]. The Slack Based Measure (SBM) model not only resolves the problem of slack input and output, but also considers undesired output when measuring efficiency [23]. Using the undesired SBM model, [24] measured the transformation efficiency of China’s 24 declining resource cities and examined their energy conservation potential and space. With the trend towards resource and environmental constraints, the green transformation of RBCs is getting more and more attention. Based on the green development concept, [25] explored the green economic efficiency of RBCs in arid regions in northern China and found that the green development level of RBCs in arid regions is constantly improving.
Improving the GTE of RBCs is a crucial route for achieving their sustainable development. Measuring their GTE and clarifying the development of green transformation can provide certain decision support for the high-quality development of RBCs. However, current research has the following gaps: (1) In the existing measurement system, capital, labor, and resources are used as inputs, and GDP is used as output [5, 25]. However, resource-based cities include multiple dimensions such as society, economy, environment, and resources, and it is necessary to comprehensively consider economic-society-resource-environmental factors to construct a green transformation efficiency measurement system [26]. (2) Existing research focuses on the national [5, 27], northeastern regions [28], etc.
Therefore, this paper attempts to make contributions in the following aspects. Firstly, it helps to provide a new way to assess the level of green transformation from the green development concept. Most of the existing studies have adopted the traditional measurement system to study the green transformation capability [29]. However, few studies have assessed the green transformation capability directly from the GTE perspective. This study introduces a social development index and an environmental pressure index to construct an improved GTE indicator system, which can enrich the research on regional green transformation capacity assessment. Secondly, it helps to provide new evidence for understanding the distribution, evolution features, and influencing factors of RBCs in the YRB. There is little research on the green transformation of RBCs in the YRB [30]. RBCs are the areas that put the most protection pressure on the environment, and are also difficult areas for achieving green and sustainable transformation in YRB [15]. We use the kernel density estimation (KDE) and Tobit model to analyze the distribution, evolution features, and influencing factors of RBCs in the YRB, which can provide decision support and recommendations for scientifically measuring and improving the green transformation efficiency of RBCs in the YRB.
Materials and Methods
Measurement Model
SE-SBM
DEA is frequently utilized to measure the efficiency of departments, organizations, etc. [31]. However, the traditional model lacks consideration of input-output slack and undesired output. Therefore, TONY proposed an SBM model that includes both desired and undesired output [32]. When multiple efficient Decision Making Units (DMUs) appear in the evaluation results, they cannot be sorted. The super-efficiency DEA model can realize the efficiency comparison of multiple effective DMUs. Then, we measure the GTE of 39 RBCs in YRB using the SE-SBM. Specific formulas participate in the literature [33].
Window Analysis
The DEA window analysis method is a moving average calculation method, can not only improve the accuracy of measurement results of the GTE by increasing the number of DMUs, but can also measure the dynamic changes in the time series [34]. Assuming there are n DMUs and d windows, each window has a width of w and a time span of T, so T-w+1 windows need to be established for efficiency measurement. According to [35], this paper chooses the window width w=3, forming a total of 8 windows.
Input-Output Indicator System
In the publications on urban transformation measurement, the most important input elements are capital, labor, and resources, including energy, land, and water resources [29]. With reference to existing research [5], this paper selects the total investment in fixed assets, the number of employees in urban units at the end of the period, the area of urban construction land, the total amount of water supply, and the total amount of electricity used by the whole society as capital input, labor input, and resource input, respectively. Under the green development concept, the green transformation of RBCs requires the coordinated development of the economy-society-environment-resources [36]. Therefore, this paper selects GDP as economic output [37], measures the social development index from the four dimensions of living standards, infrastructure, science and technology education, and public services as social output [26], and uses the industrial “three wastes” indicator data to calculate the environmental pressure index as the environmental output [38]. Where economic output and social output are expected output and environmental output is undesired output, as shown in Table 1.
Evolution Analysis Model
As a nonparametric estimation method, KDE effectively reflects the distributional location characteristics, shape, and ductility of the research object through a continuous density curve [39]. This method has the advantages of weak model dependence and strong robustness and is widely used to study uneven distribution [40]. As shown in formula (1), f(x) is the density function of random variable X, which can be used to estimate the density function of point x, N is the number of observations, xi is the independent and identically distributed observation value; h is the bandwidth, the smaller the value, the less smooth the curve; K(x) is the kernel function; this study uses the Gaussian kernel function, which is widely used.
Table 1.
Index system of social development and environmental pressure.
Tobit Regression Analysis
The GTE calculated by the above method is greater than 0 and has a tail-cutting characteristic. If we use the traditional OLS model to estimate the parameters, there will be serious bias and inconsistency [41]. The Tobit model can efficiently analyze continuous numerical variables, as well as virtual variables, and has a wide range of applications [42, 43]. Therefore, we explore the influencing factors of 39 RBCs’ GTE in the YRB using the Tobit regression model. The Tobit model is shown in formula (2).
Where, Yi* represents the dependent variable, Xi represents the independent variable, β represents the coefficient, and μ represents the error term. The model performs a left intercept of the data at 0, and defines its value as 0 when Yi* is less than or equal to 0, instead of deleting the unobserved negative values in the sample.
With reference to previous research [44], this paper selects factors that affect the GTE of RBCs from the perspective of internal drive and external pull. (1) Internal driving factors: a) Industrial Structure Upgrading (ISU). Green development requires RBCs to cultivate strategic emerging industries, accelerate modern service industry development, curb energy-intensive and high-emission industries, and eliminate outdated production capacity. The industrial structure upgrading is conducive to the industry moving towards the middle and high of the global value chain, significantly reducing environmental costs in the production process, and promoting the green transformation and development of RBCs [45]. Thus, we measure ISU based on literature [46]. The ISU is a symbol of industrial structure optimization and upgrading, reflecting the evolution of the primary industry into the secondary and tertiary industries [47]. b) Economic development level (EDL). This paper characterizes EDL with per capita GDP. In general, cities with a higher EDL are able to afford more resource input and financial expenditure for urban green transformation, thus accelerating the improvement of their transformation efficiency. c) Green technological innovation level (GTIL). In this paper, the number of green technology patents obtained is used as a proxy variable for the green technology innovation level [48]. (2) External pull factor: Opening-up level (OUL). This paper assesses RBC’s Opening-up level using the foreign imports and exports data [4]. Table 2 shows the descriptive statistical results.
This paper sets the Tobit regression model of the GTE of RBCs as shown in formula (3):
Data Source
Considering that wastewater emissions are not counted in the “China City Statistical Yearbook” in 2020 and that there are many missing data points before 2010 and environmental data in 2020, this study chose 39 RBCs statistical data in the YRB from 2010 to 2019 to measure GTE and analyze influencing factors of RBCs. The data used are mainly collected from the “China City Statistical Yearbook”, the “China City Construction Statistical Yearbook”, Statistical Yearbooks, and the National Economic and Social Development Statistical Bulletin of varied provinces and cities. Green patent data comes from the China National Intellectual Property Administration (CNIPA). The part of the missing data is imputed by interpolation.
Results and Discussion
GTE in the YRB Analysis
In accordance with the above analysis and collected data, this paper uses the SE-SBM model and window analysis method for measuring the 39 RBCs’ GTE in the YRB from 2011 to 2018. In order to better analyze the GTE differences in varied areas of the YRB, we divide RBCs in the YRB into three categories according to their locations: upper, middle, and lower reaches, then conduct an in-depth analysis, as shown in Fig. 1.
From 2011 to 2018, the overall GTE of the YRB demonstrated a V-shaped growth trend. Specifically, we can divide it into two stages. (1) The first stage (2011- 2013) is the decline period. The average GTE of RBCs in the YRB decreased from 0.6734 to 0.5606, a decline of 16.76%. (2) The second stage (2014-2018) is the rising period. The average GTE of RBCs in the YRB rose from 0.5885 to 0.7652, a decrease of 0.1767. In 2013, the State Council of China issued the National Sustainable Development Plan for RBCs (2013-2020) to accelerate the transformation and development of RBCs and play a positive role in promoting the green transformation of the YRB [49]. On the whole, the GTE of RBCs in the YRB has shown an upward trend. Compared with 2011, the average GTE in 2018 has increased by 0.0918, an increase of 13.64%. However, the average value of GTE of RBCs in the YRB is lower than 0.8, and their development awareness of green transformation is still relatively weak, and there is still much room for improvement. Specifically, from the perspective of cities, the top three cities in terms of green transformation efficiency are Erdos, Yulin, and Wuhai, while the mean values of green transformation efficiency in Baotou, Datong, and Baiyin are in the last three places. It can be seen that the larger cities have invested a large amount of capital, labor, and resource elements in their development, and while their economic and social levels have improved, they have also faced greater environmental pressure and their green transformation efficiency has performed poorly.
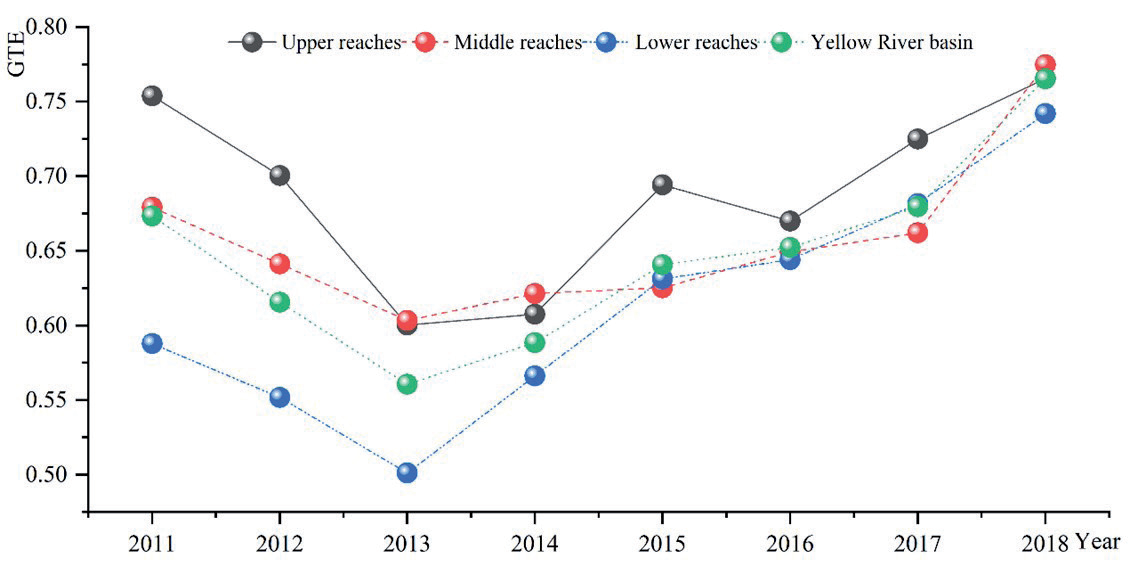
The GTE of RBCs in the upper, middle, and lower reaches of the YRB has significant discrepancies. The green transformation level of upstream RBCs is relatively superior to that of middle and downstream RBCs. From the green development concept, upstream RBCs rely on ecological and resource advantages to strengthen the green industry system and accelerate their green transformation development [30]. The GTE development trends of RBCs in the three regions have certain similarities, showing a “V”-shaped change trend. Specifically, from 2011 to 2013, the GTE of RBCs in the upper, middle, and lower reaches of the YRB demonstrated a downward tendency, with a decrease of 0.1535, 0.0758, and 0.0867, respectively. From 2013 to 2018, except for the short-term decline of RBCs in the upper reaches, the GTE of RBCs in those areas of the YRB showed an upward trend. Among them, the upper reaches have the fastest growth rate, with an increase of 0.2409, and the middle and lower reaches have increased rates of 28.39% and 27.49%, respectively. From 2011 to 2018, the overall development of RBCs in the YRB has shown a good development situation, but still needs further improvement. Cities with low GTE, especially Weinan, Baotou, Datong, Baiyin, etc., should pay more attention to pollutant emissions and accelerate industrial transformation and upgrading.
Environmental pollution and resource constraints have severely restricted the sustainable development of RBCs. Therefore, green transformation has become a realistic demand and an urgent need for their green development stage. RBCs in the YRB must integrate green development into the transformation of development modes in order to achieve green transformation. The green transformation of resource-based cities in the Yellow River Basin shows a fluctuating growth trend. However, since their overall efficiency is not high, the growth advantage should be effectively played to enhance their sustainable development ability [30]. Meanwhile, the green transformation of RBCs in the YRB shows large differences, such as Baiyin and Longnan in the upper reaches of the YRB being at an inefficient stage in the green transformation process compared with other cities. The green transformation of cities in the upstream area is crucial to the development of the whole basin and will affect the rate of overall green transformation development, so it is more essential to improve their green development level from within the region [29].
Evolution Trend of GTE of RBCs in the YRB
The KDE method is used to examine the green transformation evolution characteristics of RBCs in the YRB, mainly from the aspects of distribution, form, ductility, and polarization. Fig. 2 shows the evolution trend of the 2011-2018 GTE of RBCs in the YRB.
Fig. 2a) shows the dynamic evolution trend of the GTE of RBCs in the YRB. From a peak movement perspective, the main peak first shifted to the left and then to the right in 2011-2018, indicating that the GTE of RBCs first decreased and then continued to rise. The shrinking peak indicates that the balance of development between cities has increased. There is no double peak phenomenon, which indicates that there is no polarization phenomenon. In recent years, the green transformation development of RBCs has received more and more government attention in China, and an abundance of policies have been successfully released and implemented, such as “Several Opinions on Promoting the Sustainable Development of RBCs” and “National Sustainable Development Plan for RBCs”, providing support for the green transformation of RBCs. At the same time, RBCs continue to optimize their industrial structure and enhance their technological innovation capabilities to accelerate the green transformation [50].
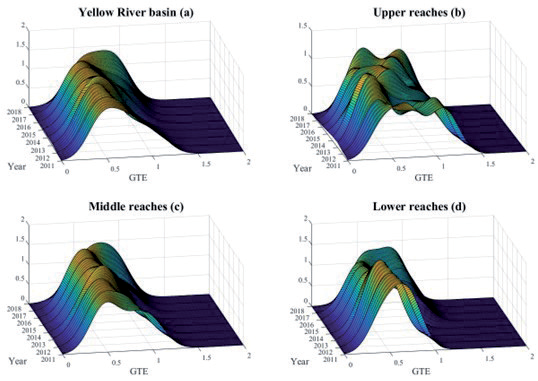
Fig. 2b), c), and d) show the distribution dynamics of the GTE of RBCs in the upstream, midstream, and downstream of YRB. We can see that the GTE dynamic evolution process of RBCs in three areas of the YRB has its own regional characteristics and time period characteristics and is the result of the superimposed symbiosis of the two. In the RBCs of the upper reaches, the main peak of the GTE curve “shifts first to the left and then to the right”, showing an evolutionary trend of “declining-rising”, and the GTE distribution curve has always had double peaks, but the position between the two peaks has shrunk and the distribution curve has become narrower. It shows that there is polarization in the green transformation of RBCs in the upper reaches, and the gap between cities is constantly narrowing. The height of the main peak of the GTE distribution curve of RBCs in the middle reaches continues to rise, the position moves to the right, and the shape gradually becomes “narrow and sharp.” The level of RBC green transformation in the midstream of the YRB has generally improved, and the absolute difference between cities has shown a shrinking trend. The main peak change trend of the GTE distribution curve of RBCs in the downstream of the YRB is similar to the midstream of the YRB. However, the GTE distribution curve of RBCs in the lower reaches has double peaks in 2018, and the main peak shape has widened, indicating that there is polarization and the gap between cities is increasing.
Tobit Regression Analysis
Tobit model regression is carried out for GTE in the RBCs of the YRB. Table 3 shows the regression results of influencing factors.
(1) The ISU has a substantial positive effect on the GTE of RBCs in the YRB at a significance level of 1%. That is, the industrial structure upgrading will help strengthen resource allocation and usage efficiency and effectively drive the RBCs green transition [45]. The tertiary industry occupies a dominant position in energy consumption, added value, and employment absorption and has become the main direction for the RBCs industrial structure upgrading [5]. From 2011 to 2018, the average of 39 RBCs tertiary industry proportions in GDP in the YRB fluctuated from 30.94% to 43.67%, an increase of more than 40%. Emissions for typical three industrial wastes (waste water, soot, and SO2) have been greatly reduced by 40.80%, 73.82%, and 75.61%, respectively. The industrial structure upgrade has efficiently promoted the decline in resource consumption and pollutant emissions for the economic growth of RBCs in the YRB and helped improve the efficiency of green transformation.
Table 2.
Descriptive Statistics for Variables.
| Variable | Obs. | Mean | Std. Dev. | Min | Min |
|---|---|---|---|---|---|
| GTE | 312 | 0.6536 | 0.2254 | 0.2976 | 1.1917 |
| LNISU | 312 | 0.8873 | 0.0676 | 0.6768 | 1.0028 |
| LNEDL | 312 | 10.6266 | 0.5780 | 8.7729 | 12.4564 |
| LNGITL | 312 | 4.4646 | 1.2888 | 0.0000 | 6.9985 |
| LNOUL | 312 | 12.4711 | 1.8012 | 7.8003 | 16.6068 |
Table 3.
Tobit regression results.
| Variables | LNISU | LNEDL | LNGTIL | LNOUL | Constant | Observations | Number of cities |
|---|---|---|---|---|---|---|---|
| GTE | 0.5247* | 0.0727** | 0.0483*** | -0.0292** | -0.4360 | 312 | 39 |
| Std. Err. | (0.3040) | (0.0347) | (0.0137) | (0.0128) | (0.3830) |
(2) The EDL positively affects the GTE of RBCs in the YRB, passing the 5% significance test. Comparable to the findings of [51]. That is, the RBCs green transformation is intimately related to the EDL. The RBCs with a higher EDL can invest more financial resources and richer resources to provide strong resource support for urban green transformation, thereby accelerating the GTE of RBCs’. Ordos, whose per capita GDP ranks among the top in China, has successively promoted the construction of numerous major projects and promoted the transformation of energy production, transmission, and consumption methods. It is recognized as a “sample of RBCs green development”.
(3) The GTIL has a positive coefficient of 0.0483 and passes 1% significance. The level of technological innovation at which the number of green patent applications is a proxy variable has a crucial influence on improving the green transformation of RBCs. The R&D and application of green technologies such as new energy and high-efficiency energy-saving will help strengthen the green bias of technological progress, which in turn will help the green transformation and development of RBCs [48].
(4) The coefficient of the OUL is negative and relatively significant, passing the 5% significance test. It shows that the opening-up level has a negative impact on improving the RBCs green transformation. Although trade liberalization will have a certain optimistic effect on China’s RBCs green transformation through mechanisms such as technology spillovers, based on the leading role of the scale effect, trade liberalization will still increase the city’s energy consumption and pollution emissions [41].
Conclusions
Improving GTE is an essential path for promoting the RBCs green transformation and achieving its sustainable development in the YRB. Therefore, we built an input-output indicator system to measure the GTE of RBCs in the YRB from the perspectives of economic development, social progress, environmental improvement, and resource conservation, which offers fresh ideas for the green transformation assessment. Then we used SE-SBM, window analysis, and the KED method to measure and analyze the GTE of 39 RBCs in the YRB from 2011 to 2018 and explore their transformation and evolution trends from a time and space perspective. Finally, this study examined the influential factors using the Tobit model that affect the GTE and provided important decision support to promote the RBCs green transformation in the YRB. The following three conclusions were drawn.
(1) From 2011 to 2018, the overall GTE of RBCs in the YRB demonstrated a “V-shaped” upward tendency. Compared with 2011, the average GTE in 2018 was 0.7652, an increase of 13.64%. The GTE of RBCs in the upper, middle, and lower reaches of the YRB are dissimilar. The upstream RBCs’ GTE is better than midstream and downstream. For example, the average values of Ordos and Wuhai are 1.0888 and 1.0118, respectively, which is in the leading position. (2) From the results of KED analysis, the GTE of RBCs in the YRB is developing in a higher direction, and the regional balance has improved. The dynamic evolution of the GTE of RBCs in the upper, middle, and lower reaches of the YRB has its own regional characteristics and time period characteristics. (3) The Tobit regression results show that the ISU, the EDL, and the GTIL have a positive impact on the green transformation of RBCs in the YRB, while the OUL has a negative effect on it, with coefficients of 0.5248, 0.0727, 0.0483, and -0.0292, respectively.
The following development suggestions are based on the green transformation situation, trend, and influence factors of RBCs in the YRB.
(1) RBCs in the YRB should implement the concept of green sustainable development, adhere to local conditions, and fully consider the differences in green transformation of different RBCs [5]. Cities with low GTE, such as Datong, Baiyin, Baotou, etc., should strengthen pollution emission control, accelerate industrial upgrading, and optimize resource allocation to improve environmental problems and increase resource utilization. Cities with intermediate GTE, such as Jinzhong and Weinan, etc., should strengthen technological research and development, industrial structure upgrading, and energy structure optimization to break through development bottlenecks. Cities with high GTE, such as Yulin and Ordos, etc., should be guided by the concept of green and ecological development, continue to optimize the industrial structure, play the policy guidance role, and expand the development of green industries.
(2) Accelerate industrial structure optimization and promote industrial green transformation and upgrading. In the process of industrial green transformation, RBCs in the YRB should adapt to the city’s economic and social development, rely on their own resource endowments, and choose scientific and reasonable industrial development paths. Declining cities should focus on superior industries and carry out vertical industrial expansion to expand and strengthen superior industries. Growing, mature, and renewable RBCs should strengthen the industrial technology level horizontally extend the industry chain, support alternative industries, develop green recycling industries, and make industries more rational. For example, RBCs in midstream and upstream of the YRB can develop tourism based on rich natural ecology, fully explore the development momentum of eco-tourism, and drive the development of other related industries [30].
(3) Strengthen scientific and technological innovation and promote the popularization and application of green energy-saving technologies. Technological innovation is a crucial means of urban transformation. Therefore, in the future development process, RBCs in the YRB should make use of their own resource advantages, rely on reasonable and effective allocation of scientific and technological resources, strengthen scientific and technological innovation, increase the added value of products, and enhance their position in the industrial chain [4].
(4) Establish a sound institutional guarantee system. The green transformation of RBCs in the YRB is inseparable from relevant institutional guarantees. The government should give certain policy support to enterprises, research and development institutions, etc., to give full play to the innovation capabilities of relevant entities. In addition, the government should strengthen environmental requirements and advance green and clean technology use by increasing the pollution costs of enterprises [48]. At the same time, managers should improve the market mechanism, optimize resource allotment efficiency, and promote the industrial upgrading and green transformation of RBCs. For industries that are weakly dependent on resources, such as green cycles and high tech, the government should provide industrial funds, credit, and other financial support and policy guidance to accelerate their development and growth [15].

