

Introduction
As a type of environmental regulation, corporate environmental credit can effectively contribute to environmental governance. Existing research typically classifies formal environmental regulations into two categories: command-and-control regulations and incentive-based regulations. Command-and-control environmental regulation encompasses direct administrative interferences such as sewage charges, resource and carbon taxes, and environmental regulations [1-2]. Market-based incentive-oriented environmental regulation includes green financial reforms, green credit policies, and carbon emissions trading [3-5]. The study about the assessment of the policy effects of these two types of environmental regulatory measures has indicated that an adequate regulatory intensity generally achieves better policy output, and the long-term benefits surpass the short-term effects for longer periods [6]. Moreover, incentive-based environmental regulations prove to be superior to command-and-control environmental regulations in the long term [7]. The second type of environmental regulation mainly belongs to the green finance policy, whereby resources are directed to flow from pollution-intensive and energy-intensive industries to low-carbon and pro-environmental industries, thereby performing the role of environmental governance and facilitating sustainable development [8].
Since ECS constitutes one of the significant components of the green finance policy and there is no research directly related to the implementation effect of the ECS micro-policy, we follow the indicators used in the existing literature to evaluate the implementation effect of the green finance policy, including firms' green behavior and evaluation. There are three principal indicators categorized by current studies on corporate green behavior. The first is about green innovation. Available studies classify the factors influencing corporate green innovation into positive and negative categories. Positive factors primarily encompass intellectual property rights, operating costs, tax expenditures, environmental regulations, and so on [2, 9-12], while negative factors mainly comprise risk-taking and air pollution [5, 13]. The second is green total factor productivity (GTFP). Current literature suggests that green total factor productivity, innovation efficiency, emission trading system, and sewage charges are all factors facilitating GTFP [1, 14]. Nevertheless, the two types of environmental regulations have different impacts on GTFP. Command-and-control environmental regulations have an inverted U-shaped relationship with GTFP, while incentive-based environmental regulations have a U-shaped relationship with GTFP [7]. The third is green investment or environmental investment. In contrast to other investigations on green behavior, the majority of factors influencing green investment are positive factors such as policy support [9, 10, 15], media attention [16], and climate change [17] in existing studies.
Generally, there are two common green evaluation indicators. The first indicator is corporate social responsibility (CSR). External factors such as air pollution [18] and environmental regulations [11] all promote CSR, while internal factors such as board size, family ownership, and institutional investors have diverse impacts on CSR in various countries [19]. The other indicator is environmental, social, and corporate governance (ESG). There are relatively fewer studies on the factors influencing corporate ESG scores, and current research indicates that the pledged equity of controlling shareholders has a negative effect on corporate ESG performance [20]. Female CEOs can contribute to corporate ESG scores [21]. Firms with poor financial performance might turn to improve ESG performance [22].
The existing literature mainly focuses on the relationship between business credit and green behavior, with few studies directly associating environmental credit with corporate green behavior and evaluation. On the one hand, extant studies exploring the influence of business credit on corporate green behavior indicate that business credit can facilitate corporate green behavior and concurrently exhibit an inverted U-shaped relationship with green total factor productivity [23]. On the other hand, there exists literature concerning the impact of corporate green behavior on corporate credit ratings. The principal conclusion of this type of literature is that the more environmental activities a firm undertakes, the greater reputational capital it acquires from its socially responsible activities, which in turn enhances the firm's ESG score as well as its credit rating. In recent years, certain scholars have also noted that environmental credit scores exert an enhancing effect on the quality of corporate disclosure, which consequently has a specific impact on corporate green behavior [24]. Additionally, the research regarding environmental credit primarily focuses on the role, demerits, and suggestions for improvement of the ECS.
Based on the existing literature, we find that current research on the ECS does not conduct an in-depth exploration of its implementation effects. On the one hand, existing studies focus on empirically verifying the correlation between common green financial policies and individual green behaviors of enterprises. On the other hand, current research focuses on qualitative examinations of the shortcomings and improvement routes of the corporate ECS. Few studies quantitatively analyze the actual policy effects of the ECS, specifically examining its impact on corporate green behavior and evaluation to verify its role in promoting corporate green transformation. This paper enriches the aforementioned research and offers a reference basis for research in this domain.
On December 18, 2013, the Ministry of Environmental Protection of China, the National Development and Reform Commission, the People's Bank of China, and the former China Banking Regulatory Commission jointly released the Measures for the Evaluation of Enterprise Environmental Credit (for Trial Implementation). These measures were implemented on March 1st, 2014. This policy document delineates the scope of the evaluation of corporate environmental credit and classifies corporate environmental credit into four grades. The evaluation indicators primarily encompass four aspects, including pollution prevention and control, ecological protection, environmental supervision, and social supervision. For the four categories of enterprises with varying environmental credit evaluations, the policy stipulates corresponding incentives and constraints. Based on the above policy documents, initially, this paper employs the difference-in-differences (DID) model to comprehensively investigate the influence of the ECS on the green behaviors and green evaluations of enterprises by adopting the "Enterprise Environmental Credit Evaluation Measures (for Trial Implementation)" implemented in 2013 as an exogenous shock to test the effect of the ECS on the green transformation of enterprises. Particularly, we designate pollution-intensive enterprises as the experimental group and non-pollution-intensive enterprises as the control group, while considering environmental investment and ESG score as green behavior and green evaluation, respectively. On this basis, we conduct a sequence of robustness tests to validate the robustness of the fundamental hypotheses supported by the baseline regression. Secondly, we analyze the asymmetry of this effect with the moderation effects of regional green financial development, regional pollution control, corporate environmental information, and corporate environmental certification. Eventually, we examine the impact of corporate green behavior and green evaluation on corporate financial performance and explore the motivation of corporations to undertake green behavior and enhance their green evaluation.
The contributions of this study may be the following three aspects: Firstly, this paper innovatively examines the influence of environmental credit on the green behavior of enterprises by regarding the "Enterprise Environmental Credit Evaluation Measures (Trial)" as an exogenous shock event, thereby enriching the related research on environmental credit. Secondly, corporate environmental credit constitutes an essential part of the green financial system and a significant link in the corporate credit system. Nevertheless, prior studies merely examine the impact of green financial policies on individual facets of corporate green behavior. This paper systematically analyzes the micro role of green financial policies from both the aspects of green behavior and green evaluation to broaden the research perspectives of green financial policies. Thirdly, previous research only explored the average treatment effect of green financial policies and did not reflect the motivation of enterprises to participate in green finance. In this paper, we explore the heterogeneous effects of ECS and the motivation of enterprises to engage in green behavior. This paper provides empirical evidence for environmental credit and corporate environmental behavior and emphasizes the significance of corporate environmental credit, which promotes enterprises to undertake green environmental protection activities.
Theoretical Analysis and Research Hypotheses
Environmental Credit, Green Behavior, and Green Evaluation
The influence of ECS on green behavior is manifested as follows: On the one hand, the ECS performs the role of command-and-control environmental regulation, publicizes the environmental credit of enterprises, enhances the efficacy of government supervision, and also strengthens the oversight of the environmental behavior of enterprises with the aid of the public's power. This transparency mechanism significantly increases the reputational risk of pollution-intensive enterprises, impelling them to respond actively to carbon reduction and emission reduction and to voluntarily enhance their environmental performance which protects their corporate image [25]. On the other hand, the ECS offers policy support to pollution-intensive enterprises in activities such as energy conservation, emission reduction, and environmental improvement [26], reduces the financial cost of enterprises in environmental protection activities, and stimulates enterprises to increase environmental protection investment.
The impact of ECS on green evaluation is shown as follows: Firstly, the ECS, by punishing polluting behaviors and encouraging environmental protection actions, vigorously urges pollution-intensive enterprises to engage in energy conservation, emission reduction, and environmental improvement practices, jointly facilitating substantial enhancement of corporate environmental performance. Secondly, ECS forces pollution-intensive enterprises to improve their own environmental behaviors, and the enhancement of environmental performance helps enterprises to improve their relations with shareholders, investors, regulators, and other stakeholders, ultimately promoting enterprises to undertake more social responsibilities [27]. Finally, the introduction of the ECS results in restrictions on the finance activities of pollution-intensive enterprises, thereby enhancing their awareness of implementing the ESG concept and establishing a favorable corporate image to alleviate their own financing constraints [22]. Based on the above analysis, we present the first research hypothesis.
H1: The establishment of ECS leads to an augmentation in green behaviors and an enhancement in the green evaluation of pollution-intensive corporations, thereby fostering their green transformation.
Moderation Effects
Firstly, the greater the degree of regional green finance development, the more conducive the ECS to play a policy effect and, the more it promotes pollution-intensive companies to adopt green behaviors. The policy effect of ECS is consistent with the concept of ESG. The development of green finance not only strengthens the financial regulation on environmental activities of pollution-intensive enterprises but also significantly boosts the intrinsic and extrinsic motivations of firms to shift towards green operations by escalating the cost of non-compliance and offering incentives for green financing [28]. Secondly, regional environmental governance constitutes another crucial element that facilitates the green transformation of enterprises. The superior the regional environmental governance becomes, the less pressure the central government imposes on local governments regarding environmental governance, and the more space and resources local governments possess to support local enterprises [29]. Simultaneously, regional environmental governance can exert a "waterlogging effect", utilizing government conduct to drive corporate behavior and guide enterprises to engage in pro-environmental and green activities. On the basis of the above discussion, we obtain the following research hypotheses:
H2: Regional green financial development and environmental governance investment can augment the positive influence of the ECS on green behavior and green evaluation of pollution-intensive enterprises.
As a crucial indicator of the efficacy of their environmental management, the environmental performance of enterprises shows the policy implementation of the ECS. The lack of a green development concept is mainly due to deficiencies in environmental performance, which reflects that enterprises excessively emphasize short-term economic benefits but ignore the long-term burdens of business activities on the natural environment. Pollution-intensive enterprises often show a bias towards polluting activities due to resource allocation, restricting the effectiveness of ECS, which results in internal resource competition that constrains their green transformation. It is the number of environmental certifications and the degree of environmental performance that become visual measurements of its green commitment and implementation. Environmental performance and environmental certificates not only reflect the green image of the enterprise but also signal the attention and commitment of the corporation to its environmental responsibility. Hence, the implementation of the ECS is more likely to motivate such enterprises with high environmental performance and environmental certificates, which enhances the policy enforcement of the ECS and promotes the green transformation process at the enterprise level or even in the entire industry [30]. According to the above, we propose the third research hypothesis of this paper:
H3: Corporate environmental performance and environmental certification can enhance the positive influence of the ECS on the green behavior and green evaluation of pollution-intensive corporations.
Data and Methodology
Data Sources
In this paper, we conduct Chinese A-share listed firms in Shanghai and Shenzhen spanning from 2010 to 2018 as research samples and select the samples in accordance with the following methods: Firstly, we eliminate samples with special treatment or financial alerts during the sample period (ST, PT, *ST). Secondly, we exclude samples with missing data in the principal variables. Eventually, we acquired 8,687 annual sample observations of 1101 firms. Referring to Nguyen et al. and Zhang et al. [31-32], in compliance with the Guidelines for Environmental Information Disclosure of Listed Companies revised by the Ministry of Environmental Protection in 2010 and the Guidelines for Industry Classification of Listed Companies revised by the Securities and Exchange Commission in 2012, we ultimately identify sixteen pollution-intensive industries as pollution-intensive, such as coal, mining, textile, tanning, paper making, petrochemical, pharmaceutical, chemical, metallurgy, and thermal power. There are 2690 sets of sample data for 335 enterprises as pollution-intensive industries, and 5997 sets of sample data for 766 enterprises as non-pollution-intensive industries. To mitigate the influence of outliers, we winsorize the variables at the 1% and 99% levels.
Table 1.
Variable symbols and descriptions.
Corporate green investment data and corporate financials are from the CSMAR and Wind databases, corporate ESG score data are from Bloomberg ESG Disclosure Scores, and regional environmental data and economic data are from provincial statistical yearbooks.
Variable Definitions
Green Behavior (EI)
In this paper, we employ firms' environmental investment as a proxy variable for firms' green behaviors, specifically referring to environmental remediation costs/total assets, which denotes the environmental remediation activities of the firms in the pollution-intensive industries where they are located.
Green Evaluation (ESG)
We use the Bloomberg ESG Score as a proxy variable for green evaluation and explore the variability of the influence of ECSs on the three dimensions of environment, society, and corporate governance in the replacement measurement of core variables of robustness check.
Control Variables
Referring to Karaman et al., Hu et al., and Zhu and Wang [33-35], we select the corresponding control variables in this paper. Specific control variables encompass Return on Assets (ROA), Operating Income Growth Rate (Growth), Percentage of Net Cash from Investing Activities (ICF), Institutional Shareholding (InShare), and Dual (Dual). Table 1 shows variable symbols and descriptions.
Empirical Model
To analyze the impact of the ECS on the green behavior of pollution-intensive enterprises, we designate the enterprises in the pollution-intensive industry as the experimental group and the remainder as the control group, thereby constructing the following DID model:
where EIit represents firms' environmental investment, ESGit represents firms' ESG scores; DIDit is the difference-in-difference variable; Xit is a series of control variables; λt denotes time fixed effects, ηj denotes industry fixed effects, and εi represents the residual term.
Table 2.
Statistical analysis.
Statistical Analysis
Table 2 Panel A presents the descriptive statistics of the principal variables. From the descriptive statistics, we find that, on one hand, the mean value of EI is 0.05, the maximum value is 2.09, and the minimum and median values are both 0, which suggests that green behaviors vary considerably among different firms. On the other hand, the maximum of ESG amounts is 3.77, the minimum is 2.21, the mean value is 2.97, and the median value is 2.99, indicating that the disparity in green evaluation between different enterprises is relatively small. Table 2 Panel B illustrates the differences in means and medians of green behavior (EI) and green evaluation (ESG) of pollution-intensive companies before and after the promulgation of the ECS policy. Based on the t-test results, we find that the ECS prompts the increase of green behaviors that are pollution-intensive and enhances the green evaluations that preliminary support H1.
Empirical Result
Parallel Trend Test
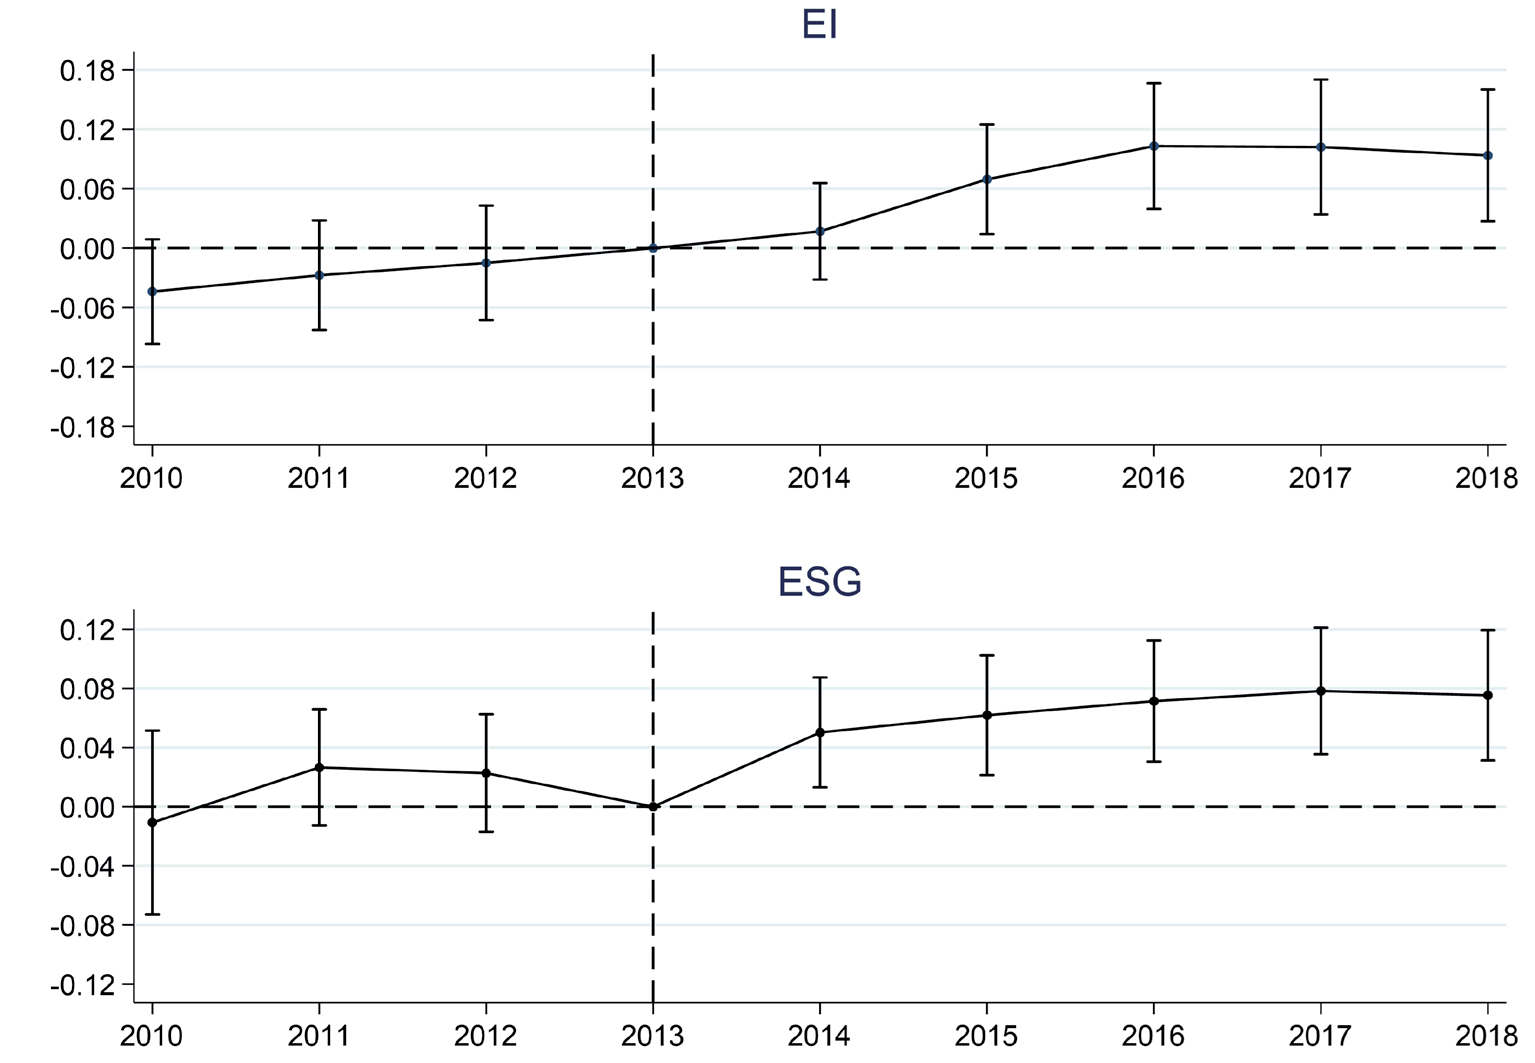
Fig. 1 shows the results of the parallel trend test. The test findings reveal that prior to the establishment of the ECS in 2014, the coefficients of green behavior (EI) and green evaluation (ESG) lacked significance at the 95% confidence level. After the establishment of the ECS in 2014, the coefficients of green behavior (EI) have become significantly positive since 2015, and the coefficients of green evaluation (ESG) have become significantly positive since 2014. This implies that there is no remarkable disparity between the green behavior and green evaluation of pollution-intensive and non-pollution-intensive corporations before the enforcement of the ECS, which means the models pass the parallel trend hypothesis test.
Baseline Regression Results
Table 3 displays the regression results of baseline models that examine the connection between the ECS and green behavior as well as the green evaluation of pollution-intensive corporations. The table reveals the regression findings of the benchmark regression, model (1), where the first two columns of the regression results exclude control variables and the last two columns incorporate them. From the results, we discover that on the one hand, when the explanatory variable is EI, the estimated coefficients of the DID in columns (1) and (3) are respectively 0.1145 and 0.1149, and both are significantly positive at the 1% level, which suggests that the green behavior of pollution-intensive companies increases after the establishment of the ECS. On the other hand, when the explanatory variable is ESG, the estimated coefficients of DID in columns (2) and (4) are respectively 0.0683 and 0.0661, and both are significantly positive at the 1% level, which indicates that the ECS improves the ESG scores of pollution-intensive enterprises. In summary, the establishment of the ECS prompts pollution-intensive enterprises to undertake green behaviors and enhance green evaluation, thereby promoting the green transformation of enterprises that support H1.
Table 3.
Benchmark regression results.
Moderation Effects
To test hypotheses 2 and 3, we analyze the impact asymmetry of the ECS on the green behavior and evaluation of pollution-intensive firms at both regional and firm levels. Specifically, we introduce four moderation variables that are regional green financial development index (GF), regional pollution control investment (PI), the number of corporate environmental violation incidents (EVL), and environmental certification (EC), to construct moderation effect models based on model (1).
Table 4 demonstrates the regression results of the moderation effect models. From the regression results, we find firstly that the estimated coefficients of DID×GF in Columns (1) and (2) are respectively positively significant at the 10% and 1% levels, suggesting that the higher the degree of development of green finance in the region, the more enhanced is the role of the ECS on the green behaviors and green evaluations of pollution-intensive enterprises. Secondly, the estimated coefficients of DID×PI in column (3) are positively significant at the 1% level yet statistically insignificant in column (2), which means that regional pollution control strengthens the positive impact of the ECS on green behavior but weakens the positive impact on the green evaluation. Third, the estimated coefficients of DID×EVL in columns (5) and (6) are statistically insignificant, which demonstrates that negative environmental events undermine the facilitation of green behaviors and evaluations by the ECS. Fourth, the estimated coefficients of DID×EC are statistically insignificant in Column (7) yet significantly positive at the 1% level in Column (8), indicating that environmental certification attenuates the positive effect of the ECS on green behavior and enhances the positive effect on green evaluation. Consequently, the above regression results validate H2 and H3.
Green Behavior, Green Evaluation, and Finance Performance
To explore the motivation of firms to undertake green behaviors and enhance green evaluations, we introduce corporate finance performance variables. We classify corporate finance performance into the following three indicators: environmental subsidies (EPS), business credit (NTC), and finance constraints (FC). The formulations are as follows: EPS = environmental subsidy operating income, and NTC = [(accounts payable + notes payable + advance receipts) - (accounts receivable + notes receivable + advance receipts)] / total assets. Referencing Hadlock and Pierce and Li et al. [36-37], we utilize the FC index as a proxy for finance constraints and adopt the following probit model to define the probability of the occurrence of finance constraints, thereby generating the financing constraint index. The larger the finance constraint index is, the more severe the finance constraint enterprise faces.
Table 4.
Regression results of moderation effects.
[i] Note: T value is in parentheses. ***, **, and * indicate significant at the 1%, 5%, and 10% levels, respectively. GF is constructed using the entropy method based on regional green credit, green securities, green insurance, and carbon finance data; regional pollution control investment. PI is represented by the ratio of the amount of regional pollution control investment to the regional gross domestic product. EVL refers to the number of corporate illegal events. EC represents enterprises that have obtained at least one ISO14001 certification or ISO9001 certification.
The probit model of constructing the Finance Constraint FC Index is as follows:
where Q is the finance constraint dummy variable that is standardized by the mean values of three variables that are firm size, age, and cash dividend payout ratio are standardized on a yearly basis. If the mean value of firms is higher than one-third of the quartile, Q takes 0, signifying a low degree of financial constraint. On the contrary, Q takes 1. Asset represents the natural logarithm of the firm's assets, Leverage refers to the asset-liability ratio, CD denotes the cash dividend adjusted by asset, MB implies the book-to-market ratio, NWC represents the net working capital, and EBIT indicates EBIT adjusted by asset.
Table 5 illustrates the regression results of the influence of green behavior (EI) and green evaluation (ESG) on corporate financial performance. We obtain the subsequent conclusions from the regression results: The estimated coefficients of EI in columns (3) and (5) of Panel A are all statistically significant at the 5% level, and the estimated coefficients of ESG in columns (2), (4), and (6) are respectively significant at the 1%, 5%, and 1% levels. This indicates that the green behavior of firms enhances business credit and mitigates finance constraints, and green evaluation facilitates obtaining environmental grants, business credit, and alleviates finance constraints. The aforementioned regression results show that the enhancement of corporate green behavior and green evaluation effectively improve financial performance. Furthermore, we conduct subgroup regressions of the pollution-intensive companies, and Panel B displays these regression results. The estimated coefficients of the principal explanatory variables in Columns (2), (3), and (6) remain significant, and the estimated coefficients of EI in Column (3) are larger and more significant than the corresponding coefficients in Panel A, which implies that green behavior plays a greater role in the acquisition of business credit for pollution-intensive firms; there is a stronger contribution of green evaluation to the environmental subsidies of pollution-intensive firms and a stronger weakness of their finance constraints. In conclusion, the improvement of financial performance may be a potential motivation and goal for firms to undertake green behavior and enhance green evaluation.
Table 5.
Motivational analysis: regression results for corporate finance.
Robustness Tests
Placebo Test
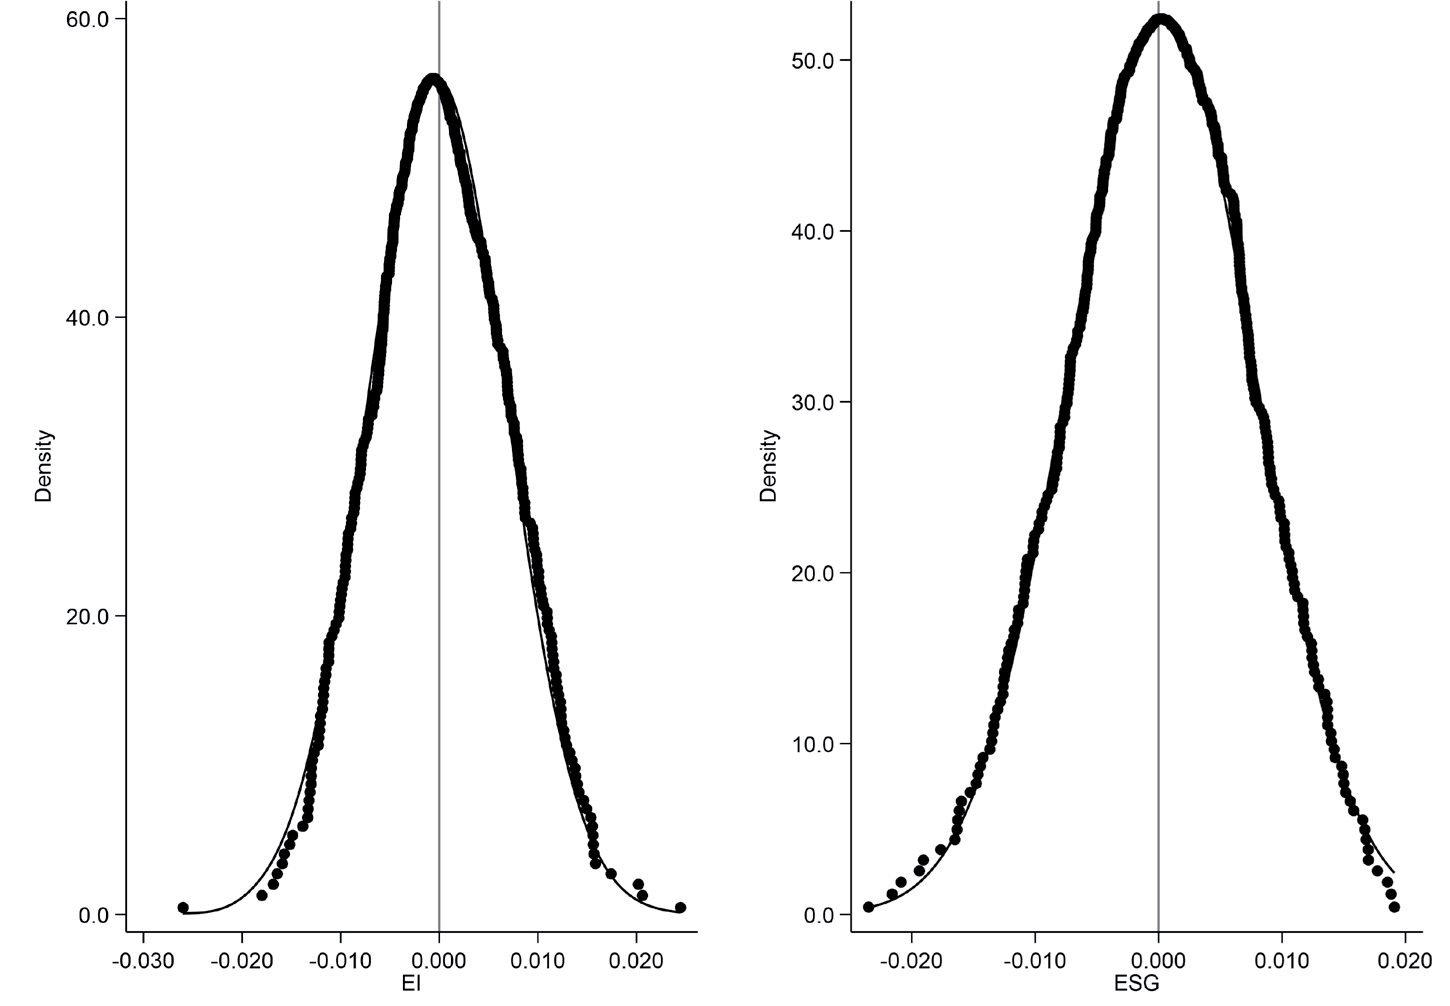
To check whether the baseline regressions are disturbed by unobservable factors, we employ a nonparametric replacement test to undertake a placebo test for the ECS, green behavior, and green evaluation. Fig. 2 reveals the results of the placebo test. From the test results, we discover that the mean value of the estimated coefficients of the 500 random samples approximates zero, and the baseline regression coefficients of the DID variables on green behavior (EI) and green evaluation (ESG) are 0.1150 and 0.6608, respectively, which are conspicuously distinct from the related coefficients obtained from the nonparametric test. Consequently, the test results preclude the likelihood that the policy effect of ECS stems from other unobservable factors, which means the baseline regression results are robust.
Replacing Measurement of Core Variables
In order to further verify the robustness of the baseline regression, we replace firms' environmental investment (EI) with firms' green investment (GI) and substitute the total ESG scores with the E, S, and G scores of the three dimensions. Green investment (GI) refers to the green-related investment in construction in progress after asset standardization. Table 6 presents the regression results replacing the measurement of explanatory variables. From the regression results, we obtain the following: Firstly, the estimated coefficient of the DID in column (1) is significantly positive at the 1% level, which indicates that firms' green investment increases subsequent to the enactment of the ECS. Secondly, the estimated coefficient of the DID is significantly positive at the 1% level in column (2), at the 10% level in column (3), and statistically insignificant in column (4). This means that the enhancement of the ECS on corporation environmental scores (E) is greater than social responsibility scores (S), while the ECS does not have an impact on enterprise internal governance (G). Thus, the regression results after replacing the variables are consistent with the baseline regression results (Table 3), which demonstrates the robustness of the baseline regression.
Table 6.
Robustness tests: regression results with replacement of explanatory variables.
Table 7.
Robustness tests: regression results with the adding fixed effects and area variables.
[i] Note: T value is in parentheses. ***, **, and * indicate significant at the 1%, 5%, and 10% levels, respectively. CGD = frequency of "green development" keywords/total word frequency in the government work report, EL is the logarithmic value of the number of provincial regulations, and DPI is the environmental pollution index attained by the entropy method of provincial "three wastes" emissions.
Adding Fixed Effects and Area Variables
To further examine the robustness of the baseline regression, we add fixed effects and regional variables into the baseline regression to control the influences of other fixed effects and regional circumstances on firms' green behavior and green evaluation. Table 7 presents the corresponding regression results. We add firm-level and city-level fixed effects, and the regional variables are as follows: city green development concern (CGD), the number of provincial environmental regulations (EL), and the provincial environmental pollution index (DPI). The regression results reveal that the DIDs are all significantly positive at the 1% level, which is consistent with baseline regression, which suggests the robustness of the baseline regression.
Excluding Other Policy Events
During the sample period ranging from 2010 to 2018, the subsequent three policy events might disrupt the baseline regression results: First are the Green Credit Guidelines promulgated by the former China Banking Regulatory Commission in 2012. Second is the Guiding Opinions on Establishing a Green Financial System People's Bank of China jointly released by the Securities Regulatory Commission, along with seven other departments in 2015. The last one is the establishment of the first batch of pilot zones for green financial reform and innovation in eight locations across five provinces (regions), Zhejiang, Jiangxi, Guangdong, Guizhou, and Xinjiang, approved by the State Council in 2017. To eliminate the interference resulting from the above three types of policies, we exclude the samples prior to 2012 on the one hand and construct the green financial policy variable (GFP) and the green financial reform pilot variable (GFR). GFP represents the cross-product of the policy time and the dummy variable of pollution-intensive firms, and GFR constitutes the cross-product of the policy time and the dummy variable of pilot provinces, which are incorporated into the baseline regression to re-estimate model (1). Table 8 depicts the relevant regression results. We find that the estimated coefficients of DID remain significantly positive at the 1% level, which suggests that the baseline regression results still remain valid after eliminating the interference of relevant policy events.
Table 8.
Robustness tests: regression results excluding interference from other policy events.
Table 9.
Robustness tests: DDML/PSM-DID regression results.
Double Debiased Machine Learning
To further examine the validity of the DID estimator, we adopt the estimation approach of Double Debiased Machine Learning (DDML), referring to Chernozhukov et al. and Chiang et al. [38-39]. Based on the causal inference of DDML, we re-estimate the DID model. Table 9 Panel A shows the regression results of DDML-DID. The regression results are consistent with the baseline regression results, which demonstrate that the baseline regression estimator is valid.
Propensity Score Matching
To mitigate the sample selection bias, we apply the propensity score matching (PSM) approach with 1:1 nearest-neighbor matching, considering firm-level control variables as the covariant variables. After passing the common support and parallel trend hypothesis tests, we eventually obtained 4047 sets of matched sample data. On this foundation, we subsequently conduct the baseline regression and the regression with alternative variable measures. From the regression results in Panel B of Table 9, we find that the estimated coefficients of DID remain significant, which shows that the baseline regression is robust.
Conclusions
Regarding the Enterprise Environmental Credit Scoring Measures (Trial) promulgated in 2013 as an exogenous event, this research utilizes the DID method to analyze the impact of the ECS on green behavior and the evaluation of pollution-intensive enterprises, which tests the policy effect of the ECS. The conclusions are presented as follows: Firstly, the ECS increases green behavior and evaluation of pollution-intensive enterprises, particularly environmental and social responsibility scores of ESG, thereby facilitating green transformation. After conducting a series of robustness tests, the baseline results remain valid. Secondly, regional green finance reinforces the contribution of the ECS to green behavior and evaluation. Regional environmental governance enhances the positive influence on green behaviors but attenuates the promotion of green evaluation. Negative environmental incidents undermine the facilitation of the ECS on green behavior and evaluation. Environmental certification strengthens the implication of the ECS on green evaluation yet weakens the positive effect on green behaviors. Thirdly, green behavior increases business credit; however, green evaluation enhances environmental subsidies and business credit, thereby alleviating the firm’s financial constraints. In addition, green behavior is more conducive to obtaining business credit for pollution-intensive enterprises, whereas green scores are more beneficial to acquiring environmental subsidies and mitigating financial constraints.
According to the above conclusions, we provide the following suggestions for enhancing the ECS and facilitating the green transformation of pollution-intensive enterprises: First, intensify green development attention and environmental governance efforts. Local governments should pay attention to regional green development and contribute to the construction of ecological civilization while concentrating on economic construction. Second, policymakers could integrate the environmental violations of enterprises into the ECS and the ESG assessment systems that are the basis of the ECS and ESG system database. Policymakers can share this information with regulators, investors, and financial institutions such as banks to enhance the ECS and ESG evaluation systems in order to enhance their effectiveness. Last, enterprises need to consciously implement the ESG concept, incorporate green transformation in the formulation of corporate strategy, and adhere to the path of sustainable development, which may alleviate finance constraints and promote high-quality development.

