

Introduction
Banana (Musa spp.) cv. is a major herbaceous plant in the family of Musaceae that produces one of the most extensively consumed fruits in tropical and subtropical regions [1]. Pakistan produced 154,800 tons of bananas on average from 34,800 hectares. Sindh province in Pakistan holds the largest percentage of banana production, with 87% of the total area [2]. The average yield of bananas is low due to different factors such as pathogen-infected suckers used for planting the new crop and unavailability of tissue-cultured plants [3], crop management, diseases (Banana Bunchy Top Virus, Panama wilt), saline soils, etc. [4]. Salt destroys plant tissue‘s metabolism by altering growth attributes and physiological mechanisms, leading to increased resilience against stress imposed by salt [5]. Pakistan covers 79.6 million hectares of total land, with 6 million hectares affected by salinity [6]. Plants grown in salty environments generate and store a variety of solutes, including polyols, proline, sugar, and betaine, which are amino acids [7]. Solutes are crucial in compensating for the osmotic stress caused by salinity [5]. Plant metabolic component variations can be observed through in vitro culture [8]. In vitro culturing of a plant is a valuable approach for determining abnormal factors in plantlets growing under biotic or abiotic stress conditions [9]. The germplasm can easily be screened for abiotic stresses in a short time under controlled conditions.
To determine the salinity tolerance of in vitro-grown germplasm, plant growth parameters, including fresh and dry weight, shoot and root length of plantlets, along with physiological responses such as photosynthesis, osmotic potential, and proline content, are commonly measured [10]. Salinity is one of the most important abiotic factors affecting plant proliferation efficiency both in vitro and ex vitro. Root and shoot inhibition is the most common response to salt stress recorded in in vitro-grown plants. Thus, the plant tissue culture technique is a helpful tool for evaluating the impact of different salt concentrations on the morphological characteristics of plant growth and development [11, 12]. The present study was designed to assess the salt tolerance (NaCl) of four micro-propagated banana varieties. Determining the genetic variation is a crucial component of any breeding strategy aimed at producing genetically resistant genotypes to salt. This study aimed to provide appropriate determination standards for saline climates and to illustrate the link between the seedling factors that were taken into account.
Experimental Methods
Plant Material and Experimental Site
The experiment was conducted on the in vitro explants of four banana varieties, viz., NIGAB-1, NIGAB-2, Pisang, and Grand Naine. These varieties were obtained from the National Sugar and Tropical Horticulture Research Institute (NSTHRI), in Sindh, Pakistan.
Experimental Procedure
Four-week-old NIGAB-2 (V-1), Pisang (V-2), NIGAB-1 (V-3), and Grand Naine (V-4) suckers were harvested from a banana field in the Thatta district (Pakistan). The suckers were separated, revealing a single shoot tip measuring 5 cm in length and 4 cm at the base. After adding a few drops of Tween-20, these explants were surface sterilized for 15 minutes using 50% commercial bleach (Clorox 5.75% NaOCl). The explants were cut in the laminar flow cabinet to their final size of 3-5 mm after thoroughly cleaning with sterile water. The explants were propagated on MS medium supplemented with 5 mg/l of BAP and 1 mg/l IAA. The cultures were incubated at 25±2ºC with a 16-hour fixed light period. In the in vitro cultures of four banana varieties, multiplication was carried out on Murashige and Skoog (MS) medium supplemented with 30.0 g/l sucrose, 4.0 mg/l benzylaminepurine (BAP), 100 mg/l KH2PO4, 1 mg/l indole acetic acid (IAA), and 2.2 g/l gellen gum (gelling agent). After 4 weeks of culturing on multiplication media, healthy and uniform plantlets were selected and cultured on rooting medium (MS medium with 2 mg/l IAA), containing different concentrations of NaCl (10, 25, 40, 55, 70, 85, and 100 mM). Fifty (50) explants were used in each treatment of NaCl.
After 10 weeks of culturing on rooting media supplemented with different concentrations of salt solution, the plantlets were removed from the glass jars and washed with distilled water to remove the gel. Measurements of the plant’s height were recorded with the help of a measuring scale, biomass (fresh and dry weight) was recorded with the help of a digital electronic balance (Cat # 18091001), and lengths of roots and shoots were also measured with the help of a measuring scale. The number of roots and shoots was counted manually.
Chlorophyll Content
The chlorophyll content of the leaves was measured using a SPAD 502 Chlorophyll meter.
Proline Content
Proline content was measured by following the protocol described by Bates et al. [13]. 0.5 g of each leaf sample was taken and homogenized in 10 ml of aqueous sulfosalicylic acid (3%). Then, the mixture was filtered through filter paper. After filtration, 2 ml of the filtrate was reacted with 2 ml of glacial acetic acid and 2 ml of acid ninhydrin in a test tube (1.25g of ninhydrin was dissolved in 30 ml of glacial acetic acid and 20 ml of 6 M phosphoric acid). The mixture was then kept in a 100°C water bath for 1 hour. The reaction mixture was placed on ice to reduce its temperature. Afterward, 4 ml of toluene was added to the reaction mixture and vigorously mixed for 15 to 20 sec using a test tube shaker. The chromophore-containing toluene was then extracted, and the absorbance was read at 520 nm using a spectrophotometer. A standard curve was prepared.
Total Sugars
Total sugars were measured following the protocol of Dubois et al., 1951. Plant material (leaves sample) of 0.5 grams was weighed and homogenized in 10 ml of 80% ethanol. The mixture was kept in an 80ºC water bath for 1 hour. After cooling, the mixture of 0.5 ml of sample was added to 1 ml of 18% phenol and incubated at room temperature for 1 hour. After incubation, 2.5 ml of conc. H2SO4 was added to the mixture. The mixture was then mixed vigorously. The absorbance of the mixture was then read at 490 nm [14, 15].
Proteins
The protein content was checked by following Bradford’s 1976 method. Fresh plant material (leaves sample) of 0.5 grams was homogenized in 5 ml of 0.15 M NaCl. The homogenate was then centrifuged at 1000 rpm for 15 minutes. 0.5 ml of water was added to 0.5 ml of supernatant. 3 ml of 5-fold diluted Bradford reagent was then added to the mixture. The mixture was then vortexed, and the absorbance was read at 595nm using a spectrophotometer.
Na+: K+
A flame photometer was used to estimate Na+ and K+. The plant samples (leaf samples) were dried in an oven for 72 hours. 0.5 g of each dried sample was taken for acid digestion, added to the nitric and perchloric acid mixture, and incubated for 24 hours. The digested mixture was then diluted ten times and filtered. Filtrate (1 ml) was then mixed with 4 ml of distilled water and 5 ml of lithium chloride solution (LiCl2). The flame photometer was calibrated using 20 mM and 10 mM standard solutions of Na+ and K+ [16].
Statistical Analysis
The statistical analysis was done using Statistics 8.1 software, and for the calculation of analysis of variance, a two-factor factorial completely randomized design (CRD) was applied to the data collected during the research. Each treatment had 3 replications (15 explants per replication), and we used 45 plants for each treatment. DMRT (Duncan’s multiple range test) was applied to find the least significant difference among the mean values.
Results and Discussions
Physical Parameters
All the morphological plant aspects, including the number of leaves, shoots, roots, root length, plant height, and biomass, were decreased due to an increase in salt stress, as shown in (Fig. 1). Plant height variation was observed among different banana varieties at different salt stress levels (Table 1). Banana variety Grand Naine showed the maximum tolerance among the tested varieties to salt stress up to 100 mM NaCl with the tallest plantlet height of 9.66 cm, followed by NIGAB-1 (8.62 cm). The other two varieties, NIGAB-2 (5.41 cm) and Pisang (4.69 cm), were statistically different (p>0.05). Balasubramaniam et al. (2023) reported that the excess amount of salt in soil retards the normal growth, development, and other physiological functions of the plant by excessive accumulation of Na+ and Cl– and nutrient deficiency [17]. A statistical difference was found among varieties in terms of the number of shoots per explant (Table 2). By increasing the salt concentration, the root length and the number of shoots were reduced in each variety, and a maximum (4.47) mean number of shoots was recorded in NIGAB-2, followed by Pisang with 4.22 shoots per explant. Meanwhile, NIGAB-1 and Grand Naine produced 3.88 and 3.86 shoots per explant, respectively. Variety NIGAB-2 produced the maximum mean number of 9.2 leaves per explant, followed by NIGAB-1 with 6.55 leaves per explant. Pisang produced the least number of leaves per explant (Table 3). Similarly, significant differences were observed among varieties for the number of roots per plant. Pisang produced 8.21 roots/plant, followed by NIGAB-2 (7.05) and NIGAB-1 (6.74), while a minimum of 5.47 roots/plant was recorded on Grand Naine. The variety NIGAB-1 produced a maximum mean root length (4.09 cm), followed by NIGAB-2 with a root length of 3.67 cm, while varieties Grand Naine and Pisang produced root lengths of 3.50 cm and 3.16 cm, respectively (Table 4).
The root and shoot proliferation results strongly conform with [18, 19], who reported reduced plant growth in the in vitro banana study due to salt stress by increasing the salt concentration in the MS medium from 10 mM to 100 mM. The plant’s shoot and root lengths were affected due to salt stress (Table 5). The biomass of each variety was reduced by increasing the stress, and NaCl treatments also affected fresh weight. NIGAB-1 produced a maximum mean fresh weight of 12.06 g, followed by NIGAB-2 (9.64 g), while Grand Naine and Pisang produced a fresh weight of 7.48 g and 7.27 g, respectively (Table 6). Similarly, the dry weight was also affected by the in vitro application of different concentrations of NaCl. NIGAB-1 produced a maximum mean dry weight (0.55 g), followed by NIGAB-2 (0.51 g), while Grand Naine and Pisang produced a dry weight of 0.38 g and 0.36 g, respectively (Table 7). Similar results have been described by [20], those who reported that in the sugarcane varieties grown to analyze the salt tolerance. All the considered parameters to check the effect of salinity showed inhibition due to the presence of sodium chloride. As per chlorophyll content (Table 8), NIGAB-1 and Grand Naine showed maximum tolerance among the tested varieties to salt stress up to 100 mM NaCl. Pisang and NIGAB-2 were statistically different from the above-mentioned varieties and produced less chlorophyll (21.26 and 17.84 nmol/cm2). The banana variety NIGAB-2 produced 17.84 nmol/cm2 chlorophyll content (Table 8). The results were similar for other species, such as Atriplex prostrate and Solanum lycopersicum, whose leaf area and fresh and dry weights of plantlets were significantly reduced due to the increase in salinity [21, 22]. NaCl threatens cultivated plants due to its effect on plant photosynthesis and causes osmotic and ionic imbalance, ultimately negatively affecting plant metabolism and growth [23, 24].
Fig. 1.
Box plots of physical analysis in the present study with different treatments T1 (10 mM), T2 (25 mM), T3 (40 mM), T4 (55 mM), T5 (70 mM), T6 (85 mM), and T7 (100 mM), and varieties V1 = NIGAB2; V2 = Pisang; V3 = NIGAB1; V4 = Grand Naine under in vitro conditions.
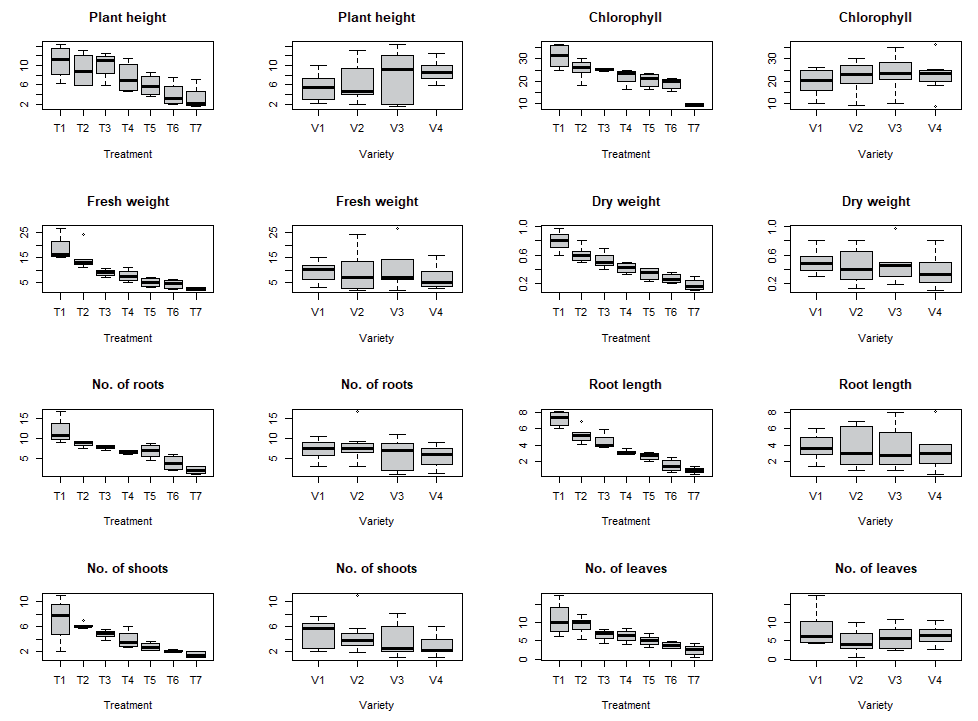
Table 1.
Effect of different salt concentrations (NaCl mM) on plant height (cm) of in vitro-grown banana varieties.
Table 2.
Effect of different salt concentrations (mM) on the number of shoots per explant of in vitro-grown banana varieties.
Table 3.
Effect of different salt concentrations (mM) on the number of leaves in in vitro-grown banana varieties.
Table 4.
Effect of different salt concentrations (mM) number of roots in in vitro-grown banana varieties.
Table 5.
Effect of different salt concentrations on root length (cm) of in vitro-grown banana varieties.
Table 6.
Effect of different salt concentrations (mM) on the fresh weight (g) of in vitro-grown banana varieties.
Table 7.
Effect of different salt concentrations on the dry weight (g) of in vitro-grown banana varieties.
Chemical Parameters
Secondary metabolites, including proline and total sugars, showed a negative relationship between salt stress and growth efficiency of micro-propagated plants at shoot proliferation as well as in root initiation and plant growth (Fig. 2). Total sugar was increased by boosting the concentrations of NaCl treatments. Maximum total sugar (1.17) was observed in the banana variety Pisang, followed by NIGAB-2 and NIGAB-1 with total sugar of 0.94 and 0.92, respectively. At the same time, the minimum total sugar (0.70) was observed in the banana variety Grand Naine. Proline was increased by boosting NaCl concentrations. Maximum proline (0.170) was observed in the banana variety Pisang, followed by NIGAB-2 and NIGAB-1 with proline of 0.149 and 0.145, respectively. Meanwhile, a minimum proline (0.89) was observed in Grand Naine. Protein was also affected by salt concentrations. Maximum protein (3.42) was observed in the banana variety NIGAB-1, followed by Pisang and Grand Naine, with a protein content of 3.23 and 3.12, respectively. Meanwhile, a minimum protein (3.04) was observed in the banana variety NIGAB-2. K+ ion was increased by boosting the concentrations of NaCl treatments at different levels in vitro. Maximum K+ ion (5.26) was observed in the banana variety NIGAB-2, followed by NIGAB-1 and Pisang, with K+ ions of 5.14 and 4.86, respectively. Meanwhile, the minimum K+ ion (3.63) was observed in the banana variety Grand Naine. Na+ ion was increased by boosting the salt concentrations of NaCl treatments at different levels in vitro. Maximum Na+ ion (3.91) was observed in the banana variety Pisang, followed by variety NIGAB-2 with Na+ ion of 3.66, while minimum Na+ ion (1.92) was observed in banana variety NIGAB-1. This study on salt stress concluded that the physical growth of bananas was adversely affected by increasing salt stress (>25mM). Different varieties have shown inconsistent responses to all applied treatments of salt stress.
Table 8.
Effect of different salt concentrations on chlorophyll content of in vitro-grown banana varieties.
Among all four evaluated varieties under different salt stress levels, NIGAB-1 showed maximum tolerance to salt stress, while Pisang was categorized as the least tolerant. The level of proline shows the level of cell injury, as confirmed by [25], who reported that an elevated proline level indicates the extent of cell injury. As the stress level increases, the level of proline also increases.
The tested plants’ sodium and potassium ion balance was disturbed by varying salt stress. Salinity problems are mostly caused by excess NaCl concentration, which results in increased osmotic pressure [26]. Imbalanced nutritive ions in the cells can directly induce harmful effects on both plant structure and enzymatic activity. NaCl affects the ionic activity of plants, which disturbs all the other cellular mechanisms of the plant, including the enzymatic activity of cells, resulting in abnormal plant growth.
Fig. 2.
Box plots of Chemical analysis in the present study with different treatments of NaCl T1 (10 mM), T2 (25 mM), T3 (40 mM), T4 (55 mM), T5 (70 mM), T6 (85 mM), and T7 (100 mM) and four varieties V1 = NIGAB2; V2 = Pisang; V3 = NIGAB1; V4 = Grand Naine under in vitro conditions.
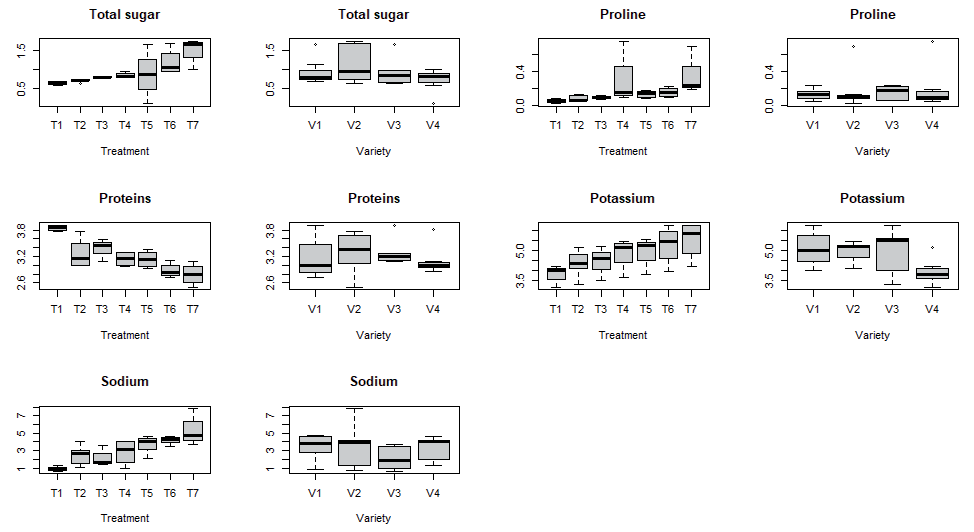
Fig. 3.
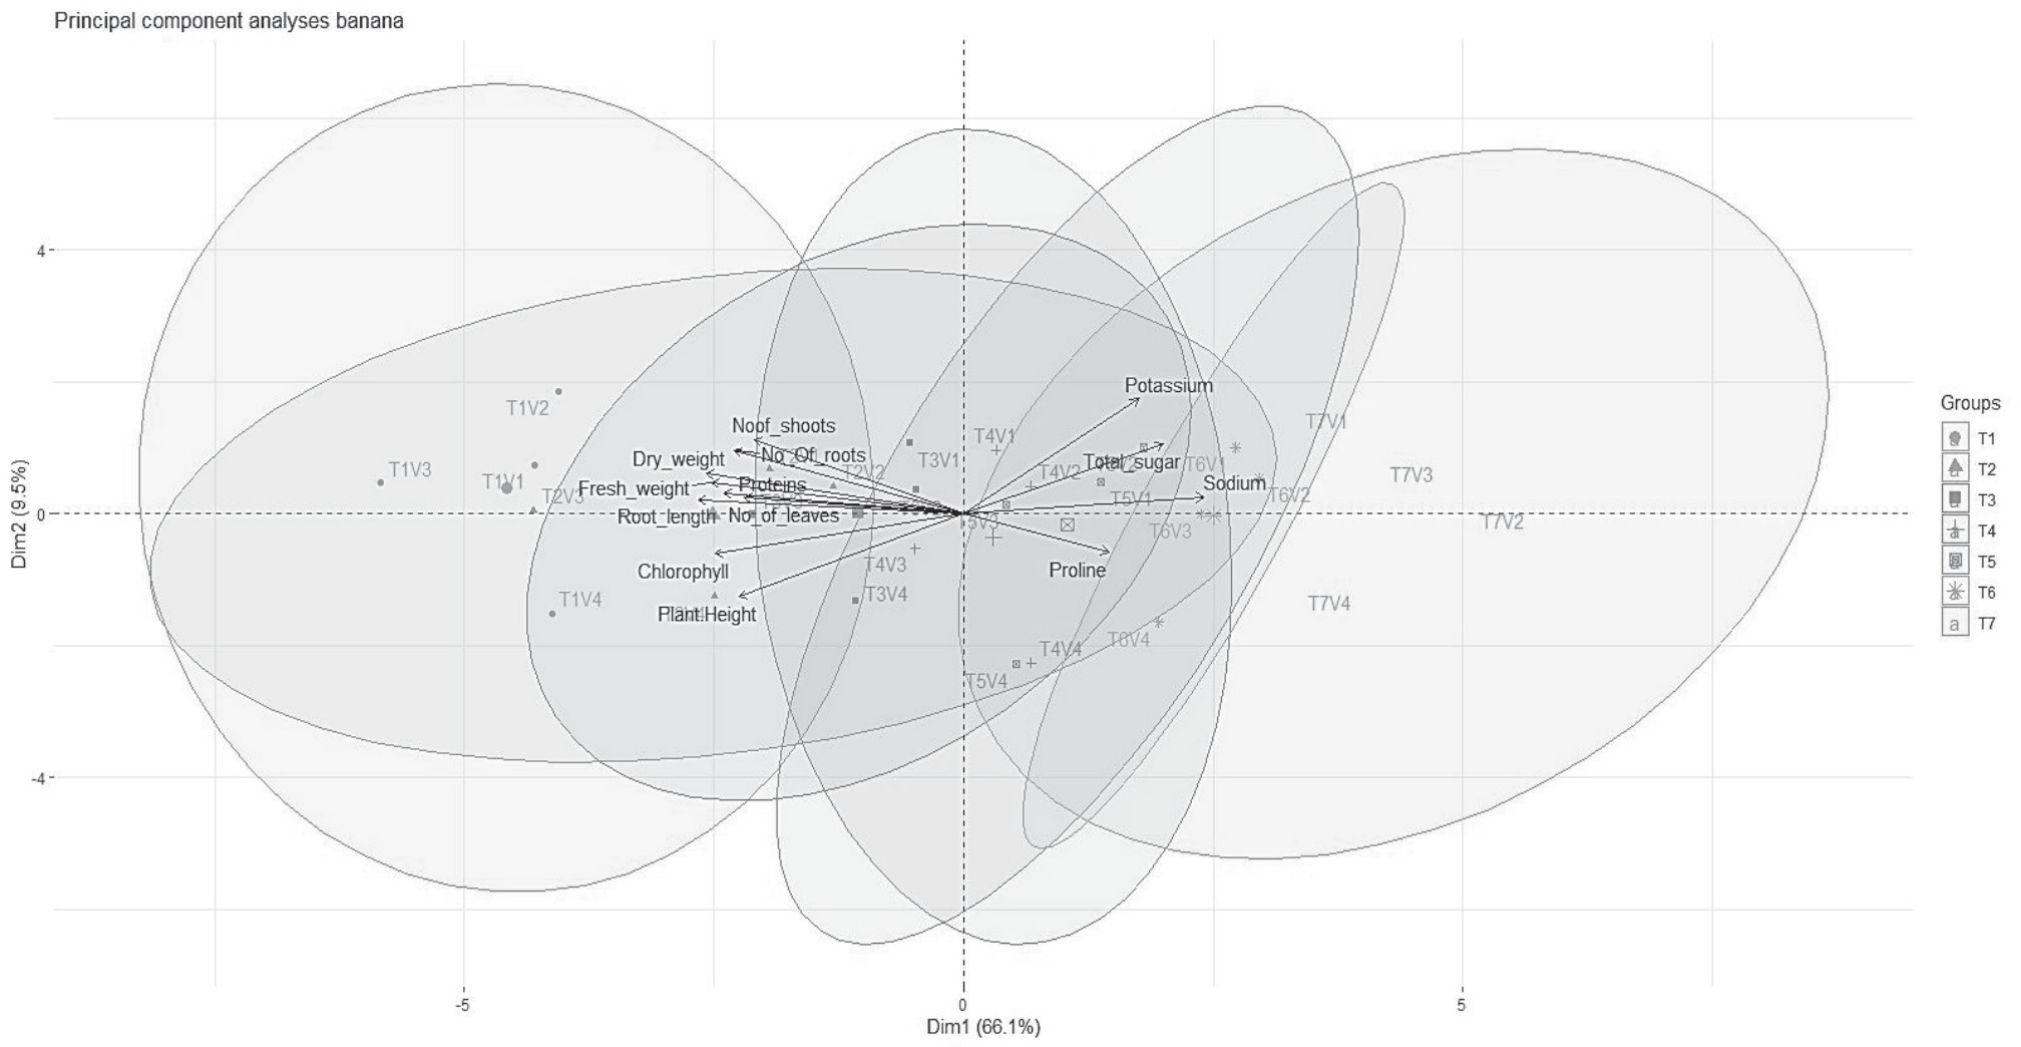
Biplot of the first two principal components for agronomic and chemical traits of bananas. T1 (10 mM), T2 (25 mM), T3 (40 mM), T4 (55 mM), T5 (70 mM), T6 (85 mM), and T7 (100 mM) and varieties V1 = NIGAB2; V2 = Pisang; V3 = NIGAB1; V4 = Grand Naine under in vitro conditions.
The total proline content of the stressed plants increased by boosting the salt stress [27]. Proline content in Pisum sativum L. increases with additional salt (NaCl) stress from low to higher and low to higher amounts of Na+ in growing tissues [28]. Each of these may be acting as an indicator of salt stress. Our findings demonstrated that, due to salt stress, K+ levels in all four cultivars significantly decreased. Xie et al. (2021) suggested that the decrease in K+ uptake could be caused by the excessive amount of Na in the medium, as high Na content is known to have an antagonistic effect on K+ absorption in plants. Meanwhile, K+ concentration decreased significantly [29]. It is responsible for imparting salt tolerance to plant tissue, but proline accumulation seems to be a symptom of a cell’s injury rather than an indicator of salinity resistance [30]. Proline’s tendency to drop indicates a vital period for growth regardless of whether the plantlet is in a stressed or non-stressed environment [31, 32]. Proline may be overproduced only when the degree of stress exceeds that of a critical point for plant growth.
Principal Component Analysis
The PCA analyses can give us good information about the relationship between variables. So, to study the relationship of the chosen variables with the yield, a biplot chart of PC1 and PC2 (Fig. 3) was performed. It is possible to observe in Fig. 3 that there exists a direct relationship between fresh weight and proteins, proline, chlorophyll, and all other traits apart from sodium, potassium, and total sugar. Sodium, potassium, and total sugar have an inverse relationship between fresh weight, proteins, proline, chlorophyll, plant height, dry weight, number of roots, root length, number of shoots, and number of leaves. So, the right management of these variables will be important to increase the banana yield.
Conclusions
Four banana varieties were evaluated under different salt concentrations. The physical growth of banana varieties was negatively impacted by raised salt stress. Different varieties have reacted differently to each salt stress treatment depending on the genotype. This is due to the genetics of the varieties, the salty environment, and their interactions. PCA showed an association among all the studied parameters. NIGAB-1, NIGAB-2, and Grand Naine had the greatest resistance to salt stress, whereas Pisang had the least tolerance. The study results can be used in future breeding programs for screening salt-resistant genotypes.

