

Introduction
Wheat, a self-pollinating annual crop, plays an imperative role among the few crop species being extensively grown as staple food sources in the world [1]. Wheat grain yield and yield components are heavily influenced by genotype and environment. Breeders explore the correlations between yield and its components when new cultivars are developed through breeding. The study of the direct and indirect effects of yield components provides the foundation for a successful breeding program, and thus the problem of yield growth may be more effectively addressed because of yield component performance and selection for closely linked characters. Grain size and weight were maintained in some varieties with a higher number of spikes and grains per spike [2]. The knowledge of the genetic relationship between the grain yield and its components under water stress conditions would provide appropriate information for selecting wheat varieties [3]. Early vigor is a physiological trait that is expressed by either a rapid improvement in the leaf region or an increase in crop ground cover [4]. The best wheat breeding program is determined by genetic variation, seed traits, and the main factors of seedling vigor [5]. Daniel et al. [6] established a link between digital ground cover analysis and solar light interception by calculating the normalized difference vegetation index (NDVI) and leaf area index. To explore computer software-aided seed morphological details, image analysis techniques can be applied for a variety of purposes [7]. The digital image is translated to digital values using digital image analysis (DIA) [8]. Vernier calipers were used to determine grain length and width [9]. Cui et al. [10] used a simple ruler to determine grain dimensions, including grain length, grain width, and grain diameter ratio.
Seed morphometry was utilized by Jamil et al. [11] to investigate the effect of seed shape on wheat grain yield. There are considerable relationships between grain yield and 1000-grain weight, the number of spikes per plant, the number of spikelets per spike, the number of grains per spike, and the length of the spike. Abhari et al. [12] evaluated that grain yield is strongly affected by water stress because of the reduction in the number of spikes per m2, the number of grains per spike, and the 1000-grain weight. Pearson’s correlation analysis revealed that the correlation between yield and yield contributing traits was found to be positive and significant only for plant height with an increase in spike length, seed circularity, and spike weight.
With the path analysis, the role of individual character in determining the grain yield as well as the thousand grain weight was observed for grain yield by Dağüstü [13]. Path analysis of the yield components described that the components having the highest correlations to yield also had the greatest direct effects on the grain yield. This study uncovers an intricate relationship among seed morphometric and yield-related traits in bread wheat (Triticum aestivum) by employing advanced statistical techniques. We underpinned novel insights into the complex interplay of these traits using structure equation modeling (SEM). This study hypothesized that there exists a significant relationship between seed morphometric and yield-related traits in bread wheat. The objective of the present study was to quantify the cause-and-effect relationship among yield and contributing traits, highlight the correlation among studied traits, and use that information to mine trait importance and classification with the help of principal component analysis (PCA).
Materials and Methods
Multivariate analysis of 16 studied variables from five bread wheat varieties (Punjab-2011, Faisalabad-2008, Gandom-1, Galaxy-2013, and Johar-2016) was done by Pearson’s correlation analysis using corrplot-package (2017) in R software. These five wheat varieties were specified for the semi-arid region and tested in a field of one acre for each variety at an agri-field situated in Burewala at 30°10’30”N and 72°46’1”E. In each field, ten random samples of a one-meter square area were marked. Five varieties were evaluated with sixteen traits to prepare a data set of sixteen columns and 50 rows (10 samples of each of the five varieties; 10 × 5 = 50) in a randomized complete block design (RCBD).
After one month of planting, photographs of ground cover by wheat crop were taken of a maximum of one-meter square without including shadows. Fifty photos were taken from fifty samples chosen from five cultivars. Using ‘Adobe Photoshop CS3 Extended’ software, the percent ground cover (% GC) was calculated by the following formula: % GC = (mean gray value / 255) × 100.
At crop maturity, plant height (cm) was measured from root to spike tip, omitting awns. Spike length was determined using a measuring tape. The spikes chosen were of varying lengths; the spike length of five spikes was accurately measured with a scale and averaged using a measuring tape. Weighing five spikes (g), each sample on a computerized weighing balance was used to determine the weight. Five spikes were threshed into each sample, and the grains (gm) of each spike were weighed independently. A thousand kernels were counted and weighed for TKW from fifty samples of each of the five varieties. Grain yield was calculated as the weight of total grains in a one-meter sample area. Digital image analysis (DIA) of the seed was performed as reported by Jamil et al. [14].
The univariate analysis of this study has been reported as a separate work (under publication). To check the overall variability expressed by the studied variables, principal component analysis (PCA) was performed using XL-STATS (2010). On the basis of multicollinearity statistics and the percentage of contribution in variation, twelve variables were selected, and a multiple regression model was generated by taking grain yield as a dependent variable. By using LISERAL software, a structural equation model was built. Multiple regression analysis was done using XL STATS-2010 with 12 selected variables; 11 independent and one dependent variable, which was grain yield.
Results
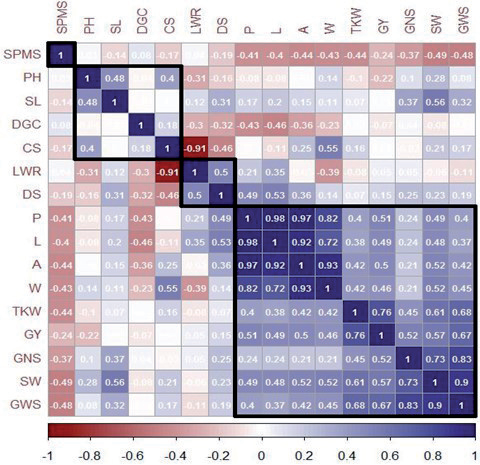
Pearson’s correlation coefficient (r) was calculated among the studied variables, and the absolute value of ±0.28 was found to be significant at the 0.05 level of significance. In the correlation rectangle (Fig. 1), the order of the variables was according to their agglomerative hierarchical clustering (AHC); hence, three groups of variables were generated. Plant height, spike length, digital ground cover, and seed circularity were placed in one group; length-width ratio, and distance from the center of gravity were in the second, and the rest of the nine variables were in the third cluster.
Spikes per square meter square were found to be negatively significant correlated with grain weight per spike, seed width, grain numbers per spike, spike weight, thousand kernel weight, seed area, seed length, and seed perimeter. Plant height was found to increase significantly with an increase in spike length, seed circularity, and spike weight. There was a significant difference in spikelets per spike, spike weight, and grain weight per spike. Digital ground cover was negatively significant correlated with length-width ratio, the distance from the center of gravity, seed perimeter, seed length, and seed area. Seed circularity was negatively significant correlated with length-width ratio and positively correlated with the width of the seed.
There was a negatively significant correlation between the length-width ratio in plant height, digital ground cover, and seed circularity. The distance from the center of gravity was found to be increased and significantly correlated with seed perimeter, seed length, and seed area. Seed perimeter was positively significantly correlated with seed length, seed area, seed width, thousand kernel weight, grain yield, spike weight, and grain weight per spike. Seed length was found to be positively significant correlated with seed area, seed width, thousand kernel weight, grain yield, spike weight, and grain weight per spike. The seed area was positively significant correlated with the thousand kernel weight, grain yield, spike weight, and grain weight per spike. The seed width was found to be increased and significantly correlated with thousand kernel weight, grain yield, spike weight, and grain weight per spike. Thousand kernel weight was positively significant correlated with grain yield, grain number per spike, spike weight, and grain weight per spike. Grain yield was increased and significant correlated with grain number per spike, spike weight, and grain weight per spike. Grain numbers per spike were positively significant correlated with spike weight and grain weight per spike. There was a positively significant correlation between spike weight and grain weight per spike.
Fig. 1.
Pearson’s Correlation Coefficient (r) among the studied traits. Variables have been ordered by the agglomerative hierarchical clustering (AHC) method, and the absolute r-value ± 0.28 has been calculated as significant at a p-value<0.05. Three rectangle boxes at the diagonal indicate the related clusters of the studied
Principle component analysis (PCA) revealed 57 percent of overall variation. Principle component one captured 38 percent of the variation, and principle component two explained 18.36 percent of the variation. The values of the highest eigen vector on principle component one and principle component two were represented by area (0.346) and length-width ratio (0.525), respectively. So, the highest correlation of area (0.862) and length-width ratio was observed with principle component one and principle component two, respectively. Seed area, perimeter, length, and width showed a 45 percent contribution to variation out of total variation along principle component one (x-axis).
Grain weight per spike, thousand kernel weight, grain yield, and spike weight exhibited 37 percent variation along principle component one (x-axis). On principle component two’s (y-axis) length-width ratio, seed circularity and distance from the center of gravity contributed 76 percent of the variation out of the total variation captured by principle component two. Squared cosines of spike weight, thousand kernel weight, grain yield, grain weight per spike, area, perimeter, length, and width were the largest at principle component one, and length-width ratio, seed circularity, distance from the center of gravity at principle component two (Table 1). Fifty observations were further color-classified with respect to five wheat varieties.
A multiple regression model was applied to assess the effect of ten independent variables selected out of a total of sixteen studied variables on the basis of multicollinearity statistics. The variables for which the variation inflation factor (VIF) value was less than 7 and the tolerance was greater than 0.1 were used in model building. The multiple regression model with ten degrees of freedom showed a mean square of 827.26 with a 12.83 F value; the error mean square of the model was 64.48, and the model was significant. The unstandardized coefficients of independent variables and the intercept model are given in Table 2.
Table 1.
Principal component analysis (PCA) of sixteen studied traits along with eigenvector and squared cosines of the variables and values in bold correspond for each variable to the factor for which the squared cosine is the largest.
Plant height and spike length negatively determined the grain yield with -0.23 and 1.44 values of beta coefficients, respectively. All eight other variables (spike per meter square, spike weight, grain number per spike, grain weight per spike, thousand kernel weight, seed length, seed width, and digital ground cover) positively determined the grain yield. Spike per meter square and thousand kernel weight with 0.43 and 0.81 values of beta coefficients, respectively, determined grain yield positively significant (p-values of 0.006 and <0.0001) respectively. The model was validated by predicting the grain yield using the beta coefficient values of independent variables. A scatter plot (Fig. 2) was generated between the predicted grain yield (x-axis) and the observed grain yield (y-axis). Ten independent variables explained 77 percent (R2 = 0.77) of the variation in grain yield with a 64.48 mean square error (Fig. 3).
Table 2.
Summary of the multivariate regression model for the grain yield as a dependent variable.
Discussion
Pearson’s correlation analysis revealed that the correlation between yield and yield contributing traits was positive and significant only for plant height with an increase in spike length, seed circularity, and spike weight. Our study is in corroboration with Ahmed et al. [15], who revealed the relationship between yield, height, grain weight spike, and grains per spike. The effective capacity of grain yield could be increased by obtaining the maximum expression of spike length, number of spikes per plant, number of grains per spike, and grain weight per spike. Fellahi et al. [16] reported positive and significant relationships between grain yield and biological yield, and similarly between straw yield and the number of spikes per plant.
Fig. 2.
Scatterplot showing prediction of grain yield by multiple regression model Simple linear regression was performed to check the effect of DGC (%) on seed shape (area, perimeter, and length). All three simple regression models were significant (Fig. 3). The coefficient of determination was 0.22, 0.19, and 0.13 for all three traits (seed length, perimeter, and area). It was noticed that DGC negatively determines the seed shape parameters.
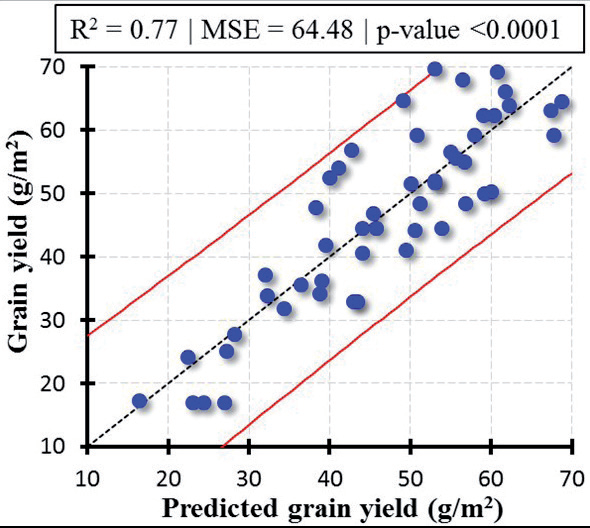
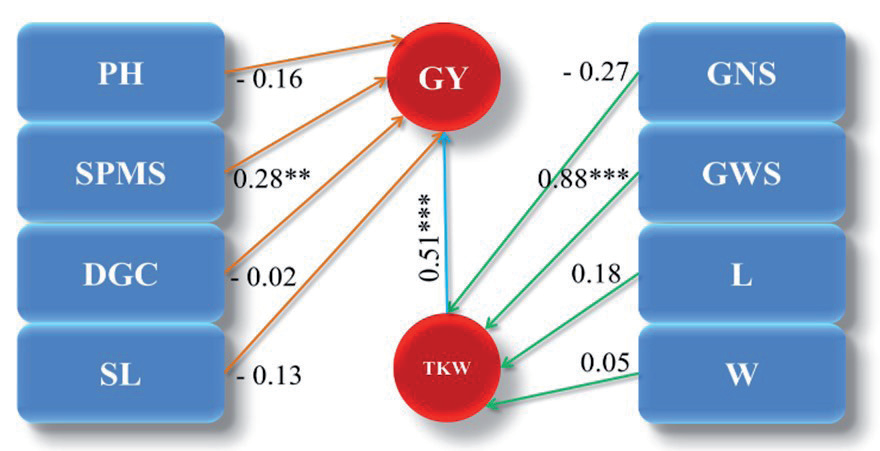
Fig. 3.
Path diagram for grain yield and thousand kernel weight illustrates contributing traits with their direct and indirect effects.
The existence of a significant r-square in a regression model equation indicates the effectiveness of bread wheat traits to improve grain yield [17]. They showed regression coefficients and the probability of the possible related variables in predicting wheat grain yield. They observed 98% of the total variation within the components contributing to grain yield, while the remaining 2% may be due to residual effects or error. The biological grain yield, harvest index, and spike weight per unit, with an R square of 98.3%, justified the maximum yield [18]. In stepwise regression, grain yield was viewed as a dependent variable, and other attributes were taken as independent variables [19]. They examined VIF, which varied between 1.05 and 1.91; thus, there was no multicolinearity between independent variables. 75% of grain yield changes were explained by spike per meter square, thousand grain weight, and plant height. In his study, the number of spikes per meter square was most important due to the 43% grain yield variation.
The structural equation was modeled as a path diagram, and traits affecting grain yield and TKW directly are shown. The indirect effect of GNS, GWS, L, and W via TKW on GY has been expressed in this structure equation model. It explains that TKW significantly affects grain yield and is noticeably affected by GWS. The direct effect of SMPS was significant on grain yield and GWS on TKW. With the path analysis, the role of individual character in determining the grain yield as well as thousand grain weight was observed. In past research, path analysis for grain yield analyzed similar results [13].
All seed morphometric traits were correlated with GWT, which determined the grain yield. GWS was strongly positively correlated with seed width, grain numbers per spike, and distance from the center of gravity, which included mean seed diameter. There was a negatively significant correlation between the length-width ratio and plant height, digital ground cover, and seed circularity. Pearson’s correlation coefficient (r) was calculated among the studied variables, and the absolute value of _+0.28 was found to be significant at the 0.05 level of significance. Cabral et al. [20] studied the correlation between seed morphometric traits and grain yield.
The analysis of variance revealed by Nukasani et al. [21] emphasized that the mean sum of squares of various characters like plant height, tillers, spike length, spikelets per spike, number of grains per spike, grain weight per spike, thousand grain weight, and grain yield are significant, therefore indicating the presence of a sufficient amount of variability among the pre-breeding lines selected for study. These five varieties, which were selected on the basis of their performance (tested as unpublished data) in semi-arid regions were used to formulate the association between grain yield and related traits. The size of a seed serves as a crucial physical indicator, influencing factors such as yield, market grade, and the efficiency of the harvest process [22].
The ultimate outcome of plant growth, the final grain yield, is influenced by a multitude of genes, nearly all of which contribute in some way, either directly or indirectly, to the overall yield. Consequently, enhancing yield is a challenging and complex undertaking [23]. Traditionally, grain yield is represented as the product of various sub-traits known as “yield components”. These components encompass two primary parameters: the number of spikes per unit area and the grain yield per spike [24].
The process of seed germination plays a crucial role in the transition from seeds to seedlings for crop plants. Optimal germination, whether occurring under stressful or favorable environmental conditions, empowers plants to flourish and achieve higher yields in both challenging and favorable environments [25]. The correlation between kernel diameter and kernel weight was found to be particularly robust. These findings indicate that focusing on kernel diameter could be a strategic approach in breeding programs with the goal of enhancing kernel weight and overall yield in wheat [26]. To pinpoint the most suitable combination of studied attributes for grain yield, we performed PCA and biplot analyses using mean values [27]. Wheat yield is a multifaceted characteristic comprising three primary components: the number of spikes per unit area, kernel number per spike, and thousand kernel weight (TKW). Among these, TKW demonstrates relatively high heritability and functions as a quantitative trait. As a crucial element of grain yield, TKW is predominantly influenced by both grain size and the process of grain filling [28].
A comprehensive set of data from the current experiment was subjected to structural equation modeling (SEM) analysis to evaluate how various parameters influence the grain yield performance of genotypes [29]. The size of seeds plays a pivotal role in determining crop yield, making it a crucial trait that has been extensively focused on in the selection of modern cultivars [30]. The size of the seeds exerted a notable impact on the establishment of stands, competitiveness against weeds, nutrient absorption, yield, and the overall performance of wheat planted using both conventional and conservation sowing methods [31]. Past research has suggested that enhancing agronomic traits in wheat is an effective approach to increasing overall wheat yield [32]. Kernel shape serves as a valuable breeding trait as it plays a role in determining flour yield in conjunction with grain size and uniformity, thereby contributing significantly to the commercial value of the grain [33].
The market value of wheat is intricately linked to the characteristics of its grain size and shape. Buyers typically prefer uniform kernels with specific shapes, as these contribute to an efficient milling processes and ultimately affect the quality of the final flour product. Seed morphometric traits serve as indicators of the extent to which wheat can be milled efficiently and also reflect the overall quality of the flour produced. This study aimed to elucidate the influence of kernel size and shape parameters on various traits contributing to wheat yield. Through comprehensive analysis, this research identified how variations in these parameters impact yield and related attributes. The findings underscore the importance of considering grain size and shape beyond mere aesthetic features, highlighting their significant implications for the economic value, processing efficiency, and overall quality of this essential crop.
Conclusion
The present research aims to highlight the multivariate analysis of seed morphometric and yield-related traits in wheat crops. The effect of agronomic traits on grain yield was quantified to check the most influential trait, which was the number of spikes m-2. Therefore, spikes m-2 were observed as the most valuable trait for the selection of high yielding heritable crops. On the other hand, thousand grain weight (TKW) also significantly contributed to grain yield, and this effect was further dissected through path coefficient analysis to check TKW-contributing traits. The TKW was determined by the grain weight per spike. In the future, the breeding program may consider two qualities, the first (SPMS) directly impacting grain yield and the second (GWS) directly affecting TKW and indirectly affecting grain yield through TKW, when selecting and breeding elite germplasm to improve grain production. In summary, understanding and optimizing grain size and shape parameters in wheat production and trade is crucial. These characteristics significantly impact the economic value, processing efficiency, and overall quality of wheat.

