

Introduction
Vegetable sources and agro-industrial residues are frequently overlooked as potential reservoirs for phenolic compounds. The extraction of bioactive compounds is a separation process aimed at recovering and purifying plant materials, making them applicable in various fields [1, 2]. Traditional methods of phytochemical extraction, such as maceration and Soxhlet extraction, have drawbacks, such as high usage of organic solvents and prolonged extraction times, resulting in elevated energy consumption and increased costs [3–5]. To decrease the time required for extraction, as well as lower energy consumption and production costs, innovative extraction technologies such as microwaves, ultrasounds, supercritical fluids (SF), etc. can be used for extraction [6, 7]. A possible replacement that uses less energy and solvent is ultrasonic-assisted extraction (UAE). Moreover, they are affordable, safe, and easy to use. The core idea behind UAE is cavitation by the sonic process, which releases bioactive compounds by dissolving the plant matrix’s cell walls [8]. It is frequently used to extract different phytochemicals [9]. Utilizing the mechanical effects of ultrasound to improve mass transfer and enable better solvent penetration into cellular materials, UAE greatly improves bioactive compound extraction with higher yields [9–11].
Antioxidants are a class of chemical compounds that have the ability to stabilize free radicals by donating free electrons and thus combat the ill effects of oxidative reactions. They are essential for the elimination of free radicals, making a substantial contribution to an individual’s health and wellbeing, and preserving the acceptability of food products [12]. The food industry is primarily concerned with the neutralization of free radicals by incorporating antioxidants in a food product and has an emphasis on the development of newer products that will help stabilize free radicals in the body when consumed. Polyphenolic and flavonoid compounds constitute a major class of antioxidants. As the food industry is concerned with the incorporation of antioxidants in various food products, new techniques for the extraction, identification, purification, and recovery of antioxidants continue to emerge [13, 14]. In this study, pea pods, which are typically thrown in trash cans or utilized as animal feed, were utilized for their advantageous properties. The possibility of utilizing green pea peels for applications other than standard animal feed is increased by research showing them to be a great source of nutritional fiber and antioxidants [15]. The current study focused on the harnessing of green pea peel waste for extraction of phenolic compounds using ultrasonic assisted extraction technique.
Experimental
Materials
Fresh green peas were procured from a local market in Nagpur, India. The peels were sorted, cleaned, and washed thoroughly to remove dirt and impurities. Chemicals and reagents used in this study were purchased from HiMedia (Mumbai, India).
Preparation of Extracts
Conventional Solvent Extraction (CSE)
The fresh green pea peel was washed and cleaned. After cleaning and washing, the peels were ground in a grinder (Jaipan JBU-05 750 W) to obtain a paste to reduce the particle size, as a smaller particle size (300 µm) facilitates the effective extraction of polyphenolic compounds. Ten grams of the paste were soaked in 100 mL of methanol for 48 h with stirring intervals of 24 h at a controlled temperature of 37°C. Whatman filter paper no. 42 was used to filter the extract, ensuring that the extract was particle-free. The extract obtained was clear and free of solid particles. The extract was then concentrated using a Superfit R150 rotary vacuum evaporator until the volume was halved. The temperature of the rotary vacuum evaporator was controlled at 50°C, and the solvent (methanol) was evaporated at 200 rpm. The concentrated extract was stored in dark-colored bottles in an LG refrigerator at 4.4°C. Exposure of the extracts to bright light was avoided to a possible extent during the extraction, concentration, and storage processes.
Ultrasound Assisted Extraction (UAE)
The paste was prepared using a method similar to that of the conventional solvent extraction process. The ultrasound-assisted extraction process was carried out using a probe sonicator (PCI analytics, 230 V AC, 50 Hz), with variations in ultrasound power (20%, 40%, 60%, and 80%), while maintaining the time set at 10 min. The Total Phenolic Content (TPC) of the obtained extracts was determined, and the extract with the highest TPC (20% power for 10 min) was selected. Subsequently, the ultrasound time was varied (5, 10, 15, and 20 min) at a constant power of 20%, and the effect of these parameters on the antioxidant activity was further studied. The temperature of the sonicator was set at 37°C. Whatman filter paper No. 42 was used to filter the extract, ensuring that the final product was clear and devoid of solid particles. The extract was concentrated using a rotary vacuum evaporator (Superfit R150) until the volume was reduced to half, maintained at a controlled temperature of 50°C in a rotary vacuum evaporator, and the solvent (methanol) was evaporated. The concentrated extract was stored in dark-colored bottles in a refrigerator (LG Appliances) at 4±1°C. Exposure of the extracts to bright light was minimized to the greatest extent possible during the extraction, concentration, and storage process.
Variations of UAE (Power Variations)
First, the power of the probe-type sonicator was varied by maintaining the time constant, that is, 10 min. The temperature of the sonicator was set at 37°C. The formulated variations are presented in Table 1(a).
Time Variations in UAE
The samples obtained after the variation in power were analyzed for total phenolic content, and it was observed that 20% power gave the best results, that is, the TPC was highest in UAE1. Therefore, 20% power was kept constant and the time was varied from 5 min to 20 min, maintaining the temperature of the probe at 37°C (Table 1b).
Antioxidant Activity
Owing to the complex makeup of phytochemicals, evaluating the antioxidant activity of a plant extract necessitates the application of several techniques. Consequently, to assess the antioxidant capability of plant extracts, it is imperative to use commonly recognized assays. Many techniques have been developed to evaluate antioxidant activity and clarify the mechanisms by which antioxidants function.
Total Phenolic Content (TPC)
TPC of the peel extract of green peas was evaluated with minor modifications [16]. A gallic acid calibration curve (20–100 µg ml-1) was plotted to compare the spectrophotometric absorbance and reported results as mg/g of extract.
Metal Chelating Activity
We utilized specific modifications to determine the chelation of ferrous ions by our sample, following the process outlined by Dinis et al. [17]. We added known volumes (90, 105, 120, 135, 150, and 165 µL) of 1 mM Ethylenediaminetetraacetic acid (EDTA) to a final volume of 2.7 mL in a set of six test tubes. We then added 2 mM FeCl2.4H2O solution (0.1 ml) and 5 mM ferrozine (0.2 ml) and carefully mixed the contents. The mixture was incubated for 20 min and recorded absorbance at 562 nm wavelength. The below equation was used to compute the metal chelating activity of the extract.
Free Radical Scavenging Activity (DPPH Assay)
A DPPH (2,2-diphenyl, 1, picrylhydrazyl) assay was employed to investigate the antioxidant activity of peel extract using a spectrophotometer (517 nm) as described by Raza et al. [18]. The activities were calculated using the below equation, and results were reported as % inhibition.
FRAP (Ferric Reducing Antioxidant Power) Method.
One hundred 100 µL samples +900 µL distilled water +2 ml FRAP (reagent) were added to a cuvette. The tubes were then inverted and mixed. The samples were then left to stand for 30 min in the dark. Transfer to cuvettes. Zero spectrophotometer at 593 nm, using a blank. Read at 593 nm. 1 mM FeSO4.7H2O was used as a standard to prepare the standard curve, and the FRAP value of Dsamples was determined relative to ascorbic acid (10 mM) [19].
Statistical Analysis
The measurements were performed three times, and the outcomes are represented as the mean ± standard deviation. Statistical significance was evaluated by employing GraphPad Prism software (version 8.0) through one-way ANOVA. Moreover, the least significant difference (LSD) test was conducted to analyze differences in mean values, with a significance level of 0.05 and a 95% confidence interval (P < 0.05).
Results and Discussions
Effect of Ultrasound Power on Total Phenolic Content of Samples
The effect of sonication power was studied at 37°C using methanol as the solvent for a constant time of 10 min. The power of the probe sonicator was varied (20%, 40%, 60%, and 80%) and UAE1, UAE2, UAE3, and UAE4, respectively, and the TPC of the samples was 1.06±0.01, 0.973±0.012, 0.939±0.012, and 0.938±0.014, respectively. The results showed that at low power, the extraction process is faster and more efficient as high power degrades the bioactive compounds, and this may be a reason why the TPC at powers of 60% and 80%, that is, UAE3 and UAE4, did not show significant differences. TPC was the highest in UAE1 among the four extracts. Similar findings were detected during the UAE of southern Algerian potato cultivars, and the findings of the study agreed with Lanez and Haoua [20], where the TPC of Clinacanthus nutans leaves was found to be higher at low ultrasound power [20, 21].
Effect of Ultrasound Time on Total Phenolic Content of Samples
After obtaining the results of the power variations, it was observed that UAE1 (20% power) showed the highest phenolic content, and the power of 20% was kept constant for further investigations. The power and temperature were optimized first, and the extraction times (5, 10, 15, and 20 min), that is, UAE5, UAE6, UAE7, and UAE8, were varied to determine the total phenolic content of the extracts. The results showed that the TPC of UAE5, UAE6, UAE7, and UAE8 were 1.33±0.02, 1.06±0.01, 0.96±0.025 and 1.01±0.04. Beyond a 6-minute extraction time, no notable differences in phenolic content were observed. Optimum results were obtained at low ultrasound power for a short period of time. In the present work, UAE5 extracted with a power of 20% and a time of 5 min was found to have a higher TPC. Sahurkar and Karadbhajne [6] presented comparable results in their investigation of ultrasonic-assisted extraction of polyphenols and antioxidants from Nigella sativa seeds [22]. Fig. 1(a) shows the comparison of the TPC of UAE5 with CSE, clearly showing that the TPC in the extract UAE5 is greater than that obtained by CSE. UAE5 is an extract with low ultrasonic power and a short extraction time. Thus, it can be concluded that ultrasonic-assisted extraction is a promising method for the extraction of bioactive compounds. When the variables associated with ultrasonic-assisted extraction (i.e., power, temperature, and extraction time) are monitored within limits, ultrasonic-assisted extraction provides a higher yield of bioactive compounds. Similar findings were reported in the Ultrasonic-Assisted Extraction and antioxidant activity of flavonoids from Adinandranitida leaves and the UAE of phenolic and flavonoid contents from the phyllanthusniruri plant [22–24].
The United Arab Emirates (UAE) enhances the release of extractable compounds and facilitates the movement of these compounds by breaking down plant cell walls, leading to increased swelling and a more rapid rate of mass transfer. This process results in improved extraction efficiency or a decreased extraction time. UAE is a straightforward, cost-effective, and environment-friendly method. The significant benefits of this process include high yields and rapid extraction rates. The increased extraction of polyphenols during ultrasound treatment is likely linked to the breakdown of cell walls in green pea peels into smaller particles as a result of the cavitation power of ultrasound [25].
Metal Chelating Activity
The extracts were tested for metal chelating activity in comparison with the standard EDTA solution at various concentrations ranging from 33.48 µg/ml to 61.38 µg/ml. The highest metal chelating activity shown by the standard was 96.35% at an initial concentration of 33.484 µg/ml and 93.17% at a concentration of 61.38 µg/ml. All formulated extracts of fresh green pea peel were tested in the concentration range of EDTA. CSE, UAE1, UAE2, UAE3, UAE4, UAE5, UAE6, UAE7, and UAE8 were tested for metal chelating activities against a standard EDTA solution. The chelating activities of all extracts were evident, showing a concentration-dependent pattern. However, compared to EDTA, the results of the extracts were lower than the standard. From the iron-chelating data, it is evident that the extracts may play a noteworthy role in oxidative damage.
The metal chelating activity of CSE was 86.69±0.086 at lowest concentration and 73.94±0.23 at its highest concentration. Among the power variations of UAE, i.e., UAE1, UAE2, UAE3, and UAE4 the highest activity was shown by UAE1, i.e., 88.74±0.3 at the highest concentration and 85.22±0.31 at the lowest concentration used, and among the time variations of UAE, i.e., UAE5, UAE6, UAE7, and UAE8, the highest metal chelating activity was exhibited by UAE5 at its lowest concentration, 92.96±0.23 and 76.75±0.43 at its highest concentration. It can be estimated that UAE5 exhibited the highest metal-chelating activity. Thus, the extract obtained at 20% power for 5 min exhibited the highest metal-chelating activity. The metal chelating activities of all extracts and standards are presented in Table 2 (a, b, and c). Kanatt et al. [25] investigated the UAE and antioxidant activity of flavonoids from Adinandranitida leaves. Similar results were reported for the determination of antioxidant activity in green pea peel [26]. The metal chelating activities of the extracts were determined by comparison with a standard EDTA solution. The metal-chelating activity was estimated at different concentrations of the standard and sample. Table 2 presents the results. A comparison of the metal chelating activities at different concentrations of EDTA, CSE, and UAE5 is shown in Fig. 1(b). The Figure clearly shows that ultrasound-assisted extraction improves the yield of antioxidants. The CSE and UAE5 graphs are below the standard graph. The metal-chelating activity of CSE was lower than that of UAE5, as clearly seen in the graph.
Fig. 1.
(a): Comparison of TPC of UAE5 with CSE, (b): A comparison of metal chelating activities at different concentrations for EDTA, CSE and UAE5, (c): Comparison of IC50 values of metal chelating activities of standard, CSE and UAE5, (d): A comparison of metal chelating activities at different concentrations for EDTA, CSE and UAE5
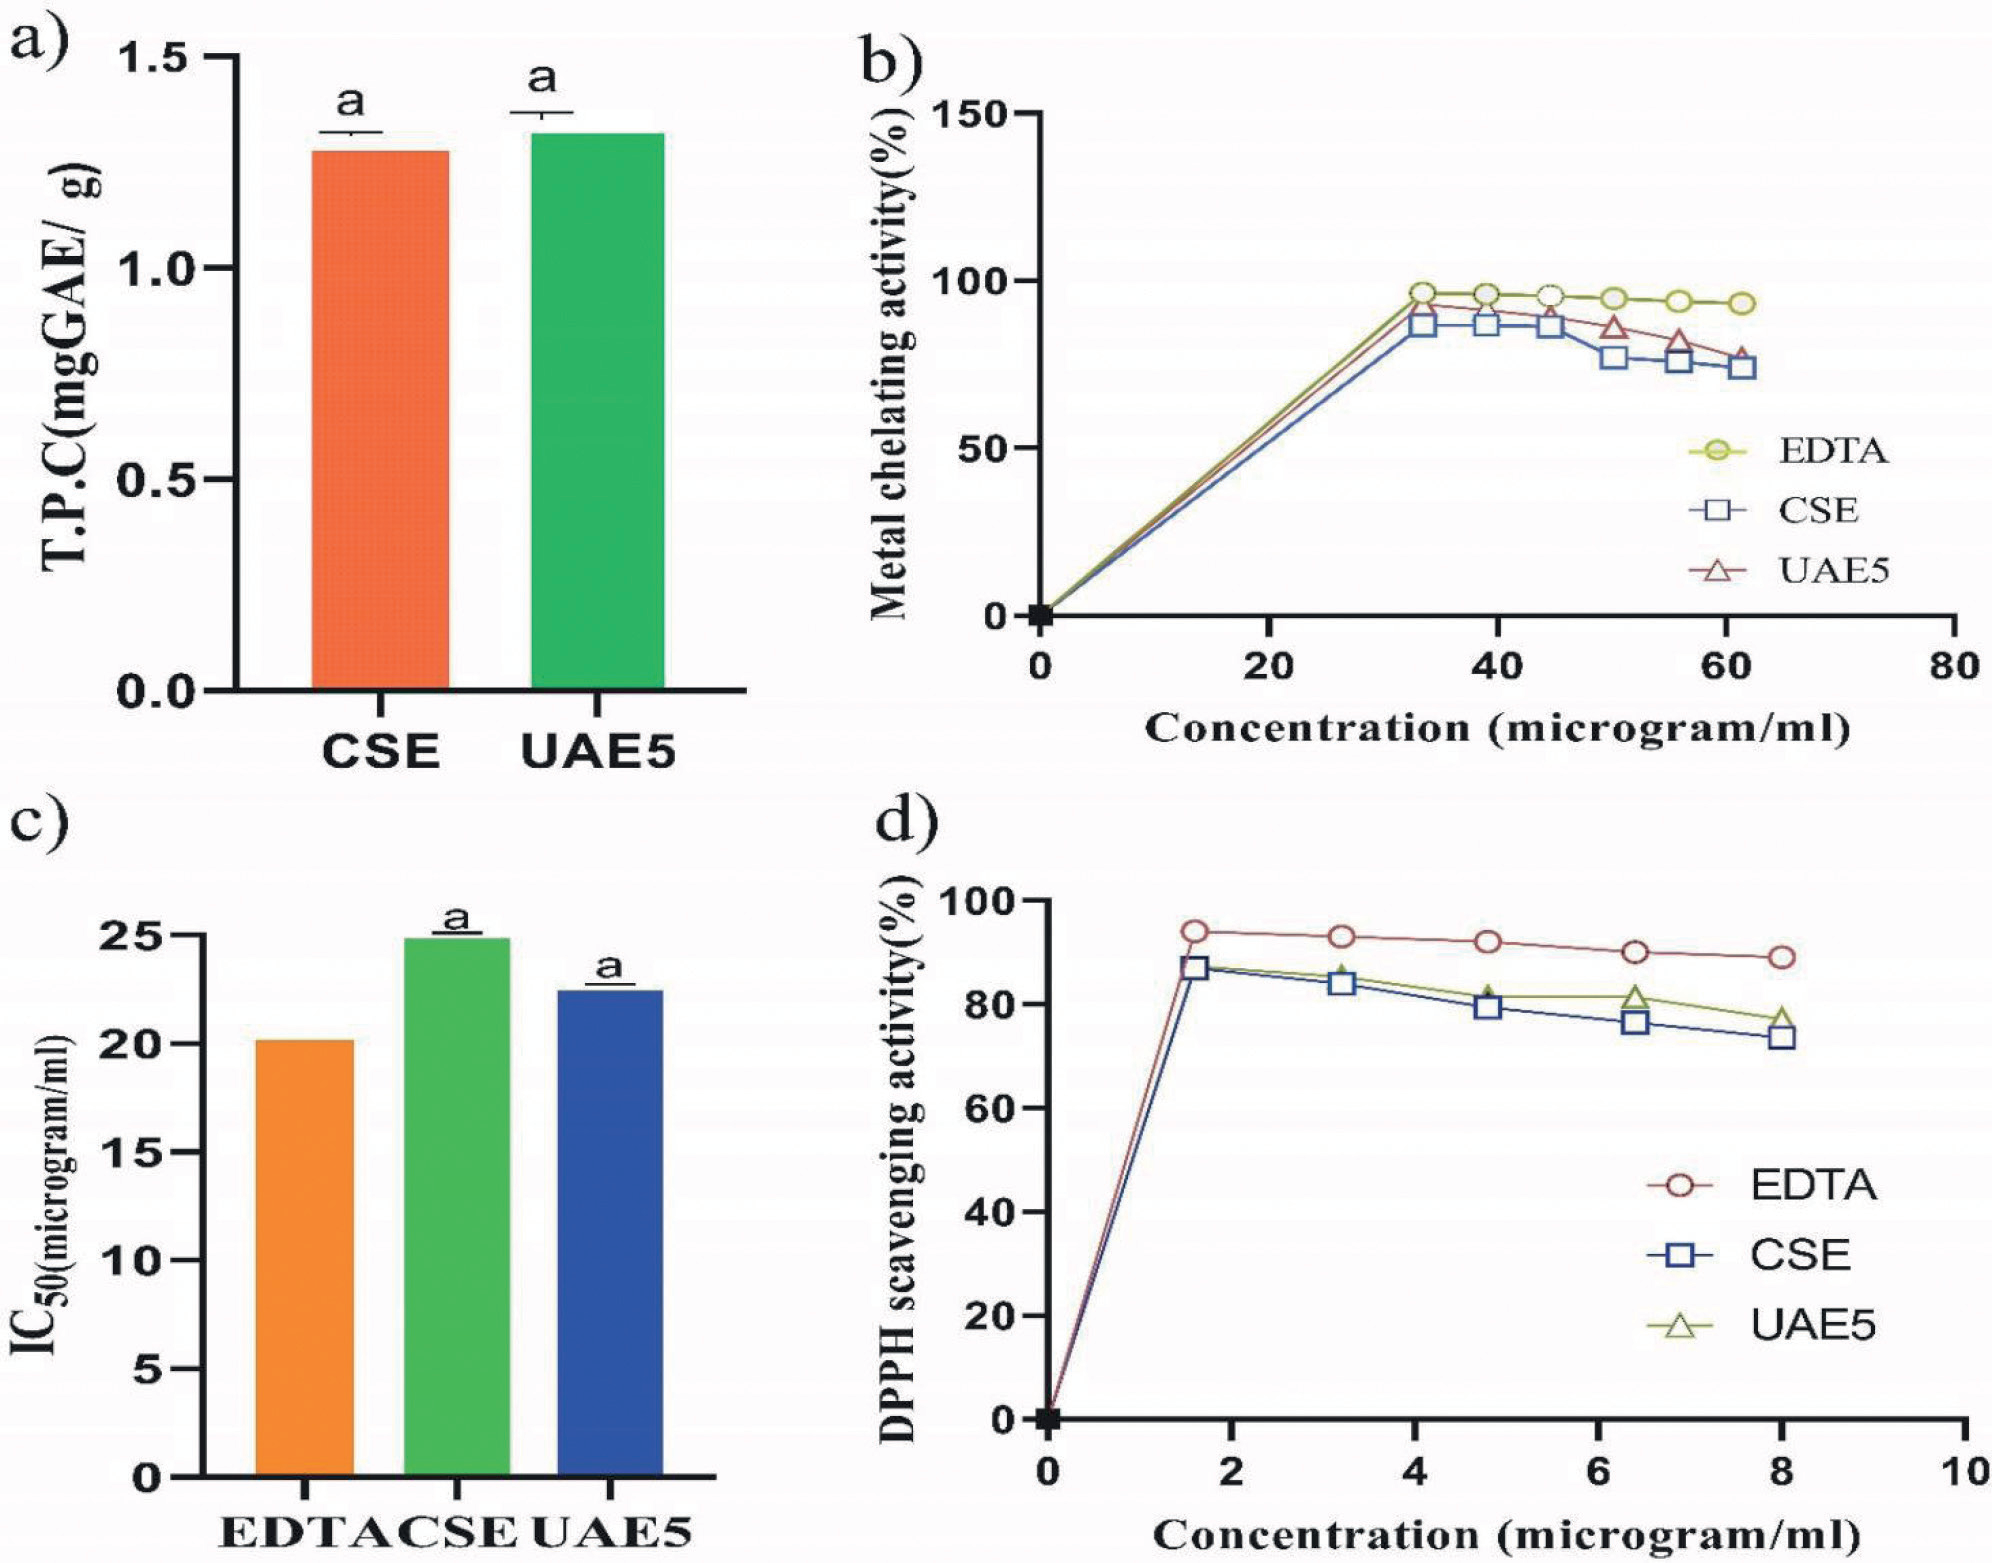
Also, the IC50 values were determined for the standard and sample. Usually, this concentration has been reported in studies related to the determination of metal-chelating activity. Fig. 1 (c) shows a comparison between the IC50 values of EDTA and CSE. The CSE value was higher than that of the standard. The IC50 of the extract CSE for chelating activity was 24.57±0.03 µg/ml, which is higher than the positive standard EDTA, i.e., 20.22 µg/ml. Similar results were reported on the antioxidant activity of Habbe Sara [27]. Considering the power variations of UAE, that is, UAE1, UAE2, UAE3, and UAE4, the IC50 values of the extracts were compared with those of EDTA. The IC50 of the extract UAE1 for chelating activity was 23.22±0. µg/ml, which is lower than that of the positive standard EDTA, i.e., 20.22 µg/ml. The values of IC50 for extracts UAE1, UAE2, UAE3, and UAE4 were 23.22±0.08 µg/ml, 23.69±0.05 µg/ml, 24.96±0.04 µg/ml, and 24.82±0.036 µg/ml. The IC50 values for UAE1, UAE2, UAE3, and UAE4 were higher than those of the standard. The IC50 value of UAE1 was higher than that of the other extracts.
The IC50 values of UAE5, UAE6, UAE7, and UAE8 were compared to those of the standard. The values were higher for the extract than for EDTA. It was noted that the extract UAE5 showed the highest value of IC50. The IC50 values of UAE5, UAE6, UAE7, and UAE8 for chelating activity were 22.163±0.07 µg/ml,23.22±0.08 µg/ml, 23.29±0.02 µg/ml, and 23.43±0.070 µg/ml, respectively, which were lower than that of the positive standard EDTA, i.e., 20.22 µg/ml. Values close to the standard represent effective chelating activity comparable to that of the standard. A comparison of the IC50 values of the metal chelating activities of the standard, CSE, and UAE5 is shown in Fig. 1(c). It can be observed that the IC50 value of UAE5 was close to standard. Values close to the standard represent an effective chelating activity comparable to that of the standard.
Table 2(a).
Metal chelating activity of CSE.
| Concentration (µg/ml) | Metal chelating activity (%) | |
|---|---|---|
| Standard | CSE | |
| 33.48 | 96.35 | 86.69±0.086a |
| 39.06 | 95.90 | 86.74±0.22a |
| 44.64 | 95.44 | 86.29±0.08a |
| 50.22 | 94.68 | 77.12±0.06a |
| 55.8 | 93.77 | 75.82±0.17a |
| 61.38 | 93.17 | 73.94±0.23a |
Table 2(b).
Comparison of metal chelating activity of standard and power variations of UAE.
Table 2(c).
Comparison of metal chelating activity of standard and time variations of UAE.
DPPH Scavenging Activity
The scavenging activity was quantified as a percentage, representing the ratio of the decrease in absorbance of the test solution to that of the DPPH solution and methanol. The extracts were tested for DPPH scavenging activity in comparison with a standard ascorbic acid solution at different concentrations ranging from 1.6 µg/ml to 8 µg/ml. The highest DPPH scavenging activity shown by the standard was 94.11% at an initial concentration of 1.6 µg/ml and 89% at a concentration of 8 µg/ml ascorbic acid. All formulated extracts of fresh green pea peels were tested in a concentration range of ascorbic acid. The extracts CSE, UAE1, UAE2, UAE3, UAE4, UAE5, UAE6, UAE7, and UAE8 were tested for DPPH scavenging activity against a standard ascorbic acid solution. All extracts demonstrated strong scavenging activity in a concentration-dependent manner. Compared to ascorbic acid, the results of the extracts were lower than those of the standard. From the DPPH scavenging activity data, it is evident that the extracts are good antioxidants that may prevent oxidative damage.
Table 3(a).
DPPH activity of standard and CSE.
| Concentration (µg/ml) | DPPH scavenging activity (%) | |
|---|---|---|
| Standard | CSE | |
| 1.6 | 94.11 | 86.92±0.56b |
| 3.2 | 93.13 | 83.98±0.53b |
| 4.8 | 92.15 | 79.41±0.98b |
| 6.4 | 90.19 | 76.47±0.98b |
| 8 | 89 | 73.25±0.98b |
Table 3(b).
Comparison of DPPH scavenging activity of standard and power variations of UAE.
Table 3(c).
Comparison of DPPH scavenging activity of standard and time variations of UAE.
DPPH activity of CSE was 86.69±0.086 at the lowest concentration and 73.94±0.23 at the highest concentration. Among the power variations of UAE, i.e., UAE1, UAE2, UAE3, and UAE4, the highest activity was shown by UAE1, i.e., 85.94±0.56 at the lowest concentration and 74.19±0.52 at the highest concentration used, and among the time variations of UAE, i.e., UAE5, UAE6, UAE7, and UAE8, the highest DPPH scavenging activity was exhibited by UAE5 at its lowest concentration, 87.25±0.85 and 77.12±0.56 at its highest concentration. UAE5 exhibited the highest DPPH scavenging activity. The extract obtained at 20% power for 5 min showed the highest DPPH scavenging activity. The DPPH scavenging activities for all extracts and standards are presented in Table 3 (a, b, and c). Similar results were reported for the antioxidant activity of green pea peel in the Ultrasonic-Assisted Extraction and the antioxidant activity of flavonoids from Adinandranitida leaves [25, 26].
The graphs of DPPH scavenging activity vs. concentration are plotted for the standard, and samples are shown in Fig. 1(d), and the graphs for the extracts CSE, UAE1, UAE2, UAE3, UAE4, UAE5, UAE6, UAE7, and UAE8 were obtained below the graph of standard ascorbic acid. The graphs obtained agree with the previous reports on the antioxidant activity of Habbe Sara [27]. The graph of UAE5 was closer to that of the standard and exhibited DPPH scavenging activity that was comparable to that of the standard. Thus, the methanolic extracts of fresh green pea peel can be important from the point of view of antioxidant activity and are good antioxidants. In addition, the results agree with those in the antioxidant activity determination of crocus mathewii [28].
The IC50 values of the extract, or the concentration at which half of the DPPH radical can be scavenged. The IC50 values were determined for the standard and sample. Usually, this concentration is reported in studies where DPPH scavenging activity is determined. IC50 of the extract CSE for DPPH scavenging activity was 3.75±0.005 µg/ ml, which is higher than that of the positive standard ascorbic acid, i.e., 3.22 µg/ml. Considering the power variations of UAE, that is UAE1, UAE2, UAE3, and UAE4, the results of the IC50 values of the extracts were compared to those of ascorbic acid. The IC50 of the extract UAE1 for scavenging activity was 3.7±0.02 µg/ml, which is lower than the positive standard ascorbic acid, i.e., 3.22 µg/ml [27]. The values of IC50 for extracts UAE1, UAE2, UAE3, and UAE4 were 3.7±0.02 µg/ml, 3.463±0.098 µg/ml, 3.393±0.028 µg/ml, and 4.31±0.065µg/ml. The IC50 values for UAE1, UAE2, UAE3, and UAE4 were higher than those of the standard and were comparable. The IC50 values of UAE5, UAE6, UAE7, and UAE8 were compared to those of the standard. The values were higher for the extract than for ascorbic acid. A comparison of the time variations of UAE and ascorbic acid is shown in Fig. 1(d). It was noted that the extract UAE5 showed the highest value of IC50. Then IC50 of the extracts UAE5, UAE6, UAE7, and UAE8 for chelating activity was 3.566±0.015µg/ml, 3.7±0.02 µg/ml, 4.346±0.02, and 4.56±0.0321 µg/ml, respectively, which are higher than the positive standard ascorbic acid, i.e., 3.22 µg/ml. Values close to the standard represent effective scavenging activity comparable to the standard. The metal-chelating activity of the extracts was determined by comparison with the standard EDTA solution. The metal-chelating activity was determined at different concentrations of the standard and sample. The results obtained are listed in Tables 3(a), 3(b), and 3(c).
Fig. 2.
Comparison of (a): IC50 values of DPPH scavenging activities of standard, CSE and UAE5, (b): FRAP values for ascorbic acid.
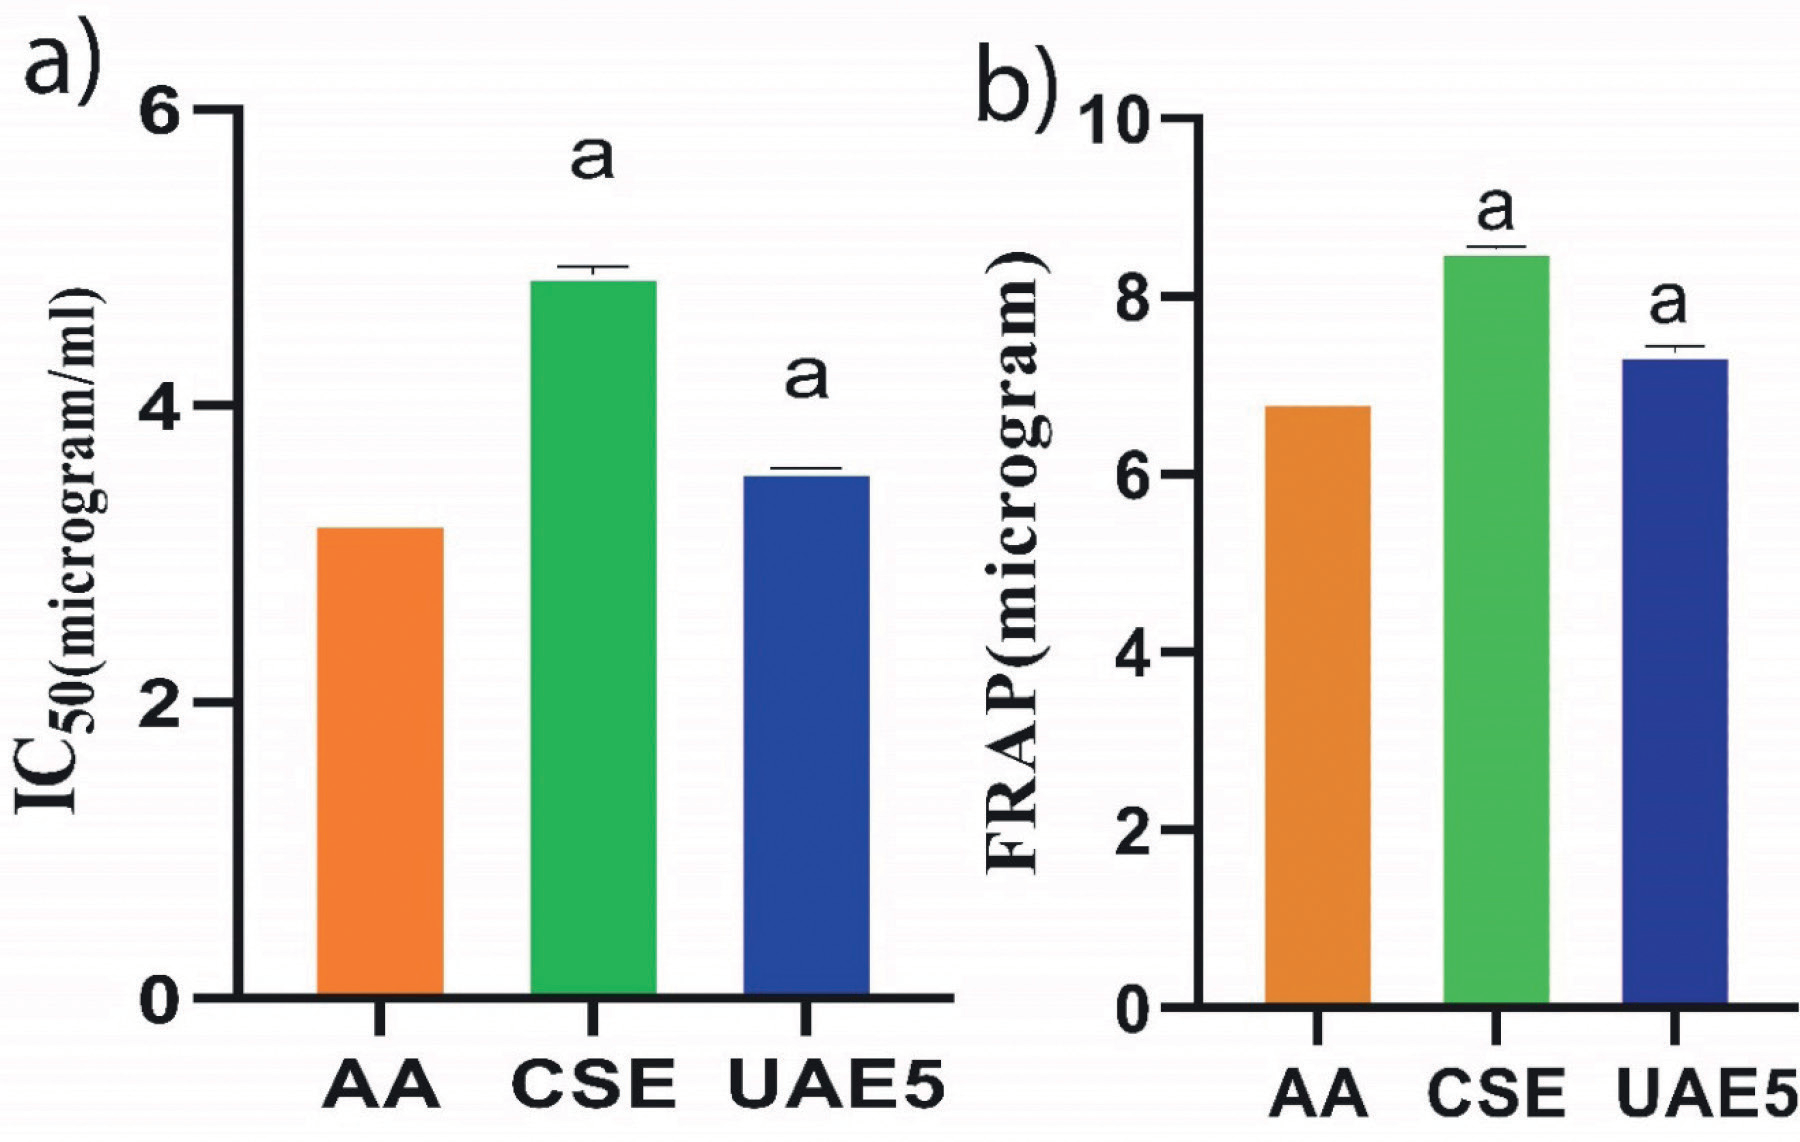
A comparison of the IC50 values of DPPH scavenging activities of the standard, CSE, and UAE5 is shown in Fig. 2(a). It can be observed that the IC50 value of UAE5 was close to standard. Values close to the standard represent effective scavenging activity comparable to the standard.
FRAP Assay
The FRAP value of ascorbic acid determined from the standard curve was reported to be 6.84 µg. The FRAP values of the extracts were determined relative to those of the standard ascorbic acid solution. The FRAP value of CSE was observed to be 8.53±0.017µg. Among the power variations of the UAE, that is, UAE1, UAE2, UAE3, and UAE4, the lowest FRAP value was exhibited by UAE1, that is, 7.58±0.020µg, and among the time variations of UAE, i.e., UAE5, UAE6, UAE7, and UAE8, the lowest value was shown by UAE5, i.e., 7.37±0.068µg. Fig. 2(b) shows a comparison between the FRAP values of CSE and ascorbic acid. CSE exhibited a higher FRAP value than ascorbic acid did. Fig. 2(b) shows a comparison of the FRAP values for ascorbic acid and power variations of UAE. UAE1, UAE2, UAE3, UAE4, and UAE1 showed a low FRAP value and were found to be close to that of standard ascorbic acid. Fig. 2(b) shows the comparison of FRAP values for ascorbic acid, and time variations of UAE, UAE5, UAE6, UAE7, UAE8, and UAE5 were found to be close to the standard. Similar findings were reported by [29], who studied the antioxidant activity of guava fruit extracts. A comparison of the FRAP values for ascorbic acid, CSE, and UAE5 is shown in Fig. 2(b). It can be concluded from the figure that the FRAP value of UAE5 is closer to that of the standard, that is, UAE5 has reducing power.
Conclusions
In this study, two extraction techniques were used to evaluate the antioxidant activity of peel extracts. These techniques include ultrasonic-assisted and conventional solvent extraction. The results indicated that the amount extracted from both total phenolic contents was remarkably improved when using UAE. The antioxidant activity of the extracts was tested using various antioxidant assays, such as metal chelating activity, DPPH scavenging activity, and the FRAPS method. The obtained results were compared with those of standard antioxidants for a better understanding of antioxidant activity. Ultrasonic-assisted extraction with probe sonication at low power and time was found to be the most effective in terms of antioxidant yield. Thus, it can be concluded that ultrasonic-assisted extraction is a better and more environmentally friendly technique that influences the yield of phenolic compounds from green pea peel.

