

Introduction
One of the grains that is most commonly consumed worldwide is rice (Oryza sativa L.), a monocotyledonous plant in the Poaceae (Gramineae) family. It is utilized either directly as human food or indirectly as animal feed, with Asia and Africa consuming more rice than European nations [1]. According to statistics on agriculture and farming in 2022, China consumed more rice than any other nation, with roughly 154.9 million metric tons [2]. The Ministry of Agriculture and Water Resources of the Kurdistan regional government reported that local rice output increased by over three times in the last two years, from 4.939 tons in 2016 to 13.485 tons in 2018 [3]. In the Kurdistan region, the majority of which is produced in Harir, Batas, a Akre, Sharazur and Betwata. High-quality cuisine has traditionally been essential to the Kurdish way of life. Kurds are extremely proud of their rich culinary heritage and varied, delectable cuisine [4]. Local rice production frequently remains low because of its specific smell and taste, and because of rice’s renowned quality, simple marketing [5] and inability to meet demand, a large portion of the daily rice consumption is imported. Each person in the Kurdistan region demands 36 kg of rice a year, which equates to a need for the region of around 250 000 tons. In the area of 100,374 hectares of land in Harir and Batas, 450 dunums of rice can be used, and annual rice production in the area is 600 tons [6]. The majority of the rice that is cultivated in Harir subdistrict has spherical, short grains. Very early types of rice have a biological cycle (days from seedling to harvest) that is as short as 95 days and as long as over 250 days (very late varieties). After seeding, cultivars with medium maturation (120-150 days) can be harvested [7]. The productivity of paddy rice depends on the weather, the type of seeds used, and the soil’s characteristics [8]. Farmers from Harir and Batas reported that small harvests of rice are due to the absence of rain, and the quality of the produce in the Harir subdistrict depends on the availability of water. One of the worst rice crops in recent years may have resulted from drought [9]. Eight thousand liters of water are needed to produce 1 kilogram of rice in order to produce a quality product. It has been demonstrated that the water and air in Kurdistan are more appropriate for the type of rice grown there [10]. The physical conditions, to which the rice plant is subjected during each stage of growth, as well as during harvest, processing, storage, and planting, determine the quality of the seeds. The weather and landscape of the Kurdistan region are suitable for growing rice, which permits an expansion of the area designated for sowing the grain. Rice is rich in micronutrients like vitamins and trace minerals in addition to macronutrients like proteins and carbs. They also supply variety of bioactive, non-nutritive molecules known as antioxidants, such as phenolic compounds [11]. All plant materials, including plant-based food items, naturally include phenolic chemicals, which are secondary plant metabolites. It is believed that both humans and animals need these substances in their diets. According to Huyut et al. [12], they are the most significant class of natural antioxidants. Additionally, due to the widespread usage of medicinal plants in the treatment of many ailments, these plants are now also valuable as novel antibacterial agents [13]. Minerals are vital nutrient elements that are needed in the normal diet as they can support health at an ideal level, and some of them may be toxic to health if consumed in large amounts or exposed to them. Rice is regarded as the greatest cereal due to its high nutritional value and improved digestion [14]. The number of macronutrients such as P, S, K, Ca, and Mg in rice is usually higher than that of micronutrients like Mn, Fe, Cu, Zn, and Se, while Al and heavy metals are undesirable because of their harmful effects [15]. The quality and health of the rice cultivars that consumers eat have increased. As a result, attention must be paid to both rice output and quality. Farmers were motivated to produce higher-quality rice once they were aware of their own rice quality [16]. People who eat rice as their main food have a close relationship between their health and the quality of the rice, which includes minerals and hazardous substances, as well as their percentages [17]. Meanwhile, elemental toxicity has proven to be related to several health risks, such as cancer and neurological disorders. To manage, prevent, and treat metal poisoning that occurs at different levels, including occupational exposure, accidents, and environmental factors, several public health strategies have been used [18]. All rice is white inside, but the rice bran gives different types of rice their distinct colors. Once the bran has been removed, as occurs during the hulling or milling process, the endosperm is typically white. However, the majority of essential elements, such as minerals, antioxidants, and anti-inflammatory compounds, are found in the bran, and different rice grains of different colors have distinct characteristics. In all studies, colored rice demonstrated, in a dose-dependent way, the best antioxidant activity and the largest DNA protection impact. This rice’s intense hue was due to its high anthocyanin content. The author proposed that colored rice sprouts may be used to create useful foods [19]. In the rice samples of Kurdish rice from the Harir sub-district, the impact of harvest time was evaluated with regard to proximate analysis, free phenolic compounds, fatty acid, and mineral content. The rice was harvested at 3, 5, and 6 months of age, following the seasonal patterns of commercial agriculture. The findings of this research may boost the value added to rice products and open up new markets, both of which would benefit farmers financially.
Materials and Methods
Description of the Study Area
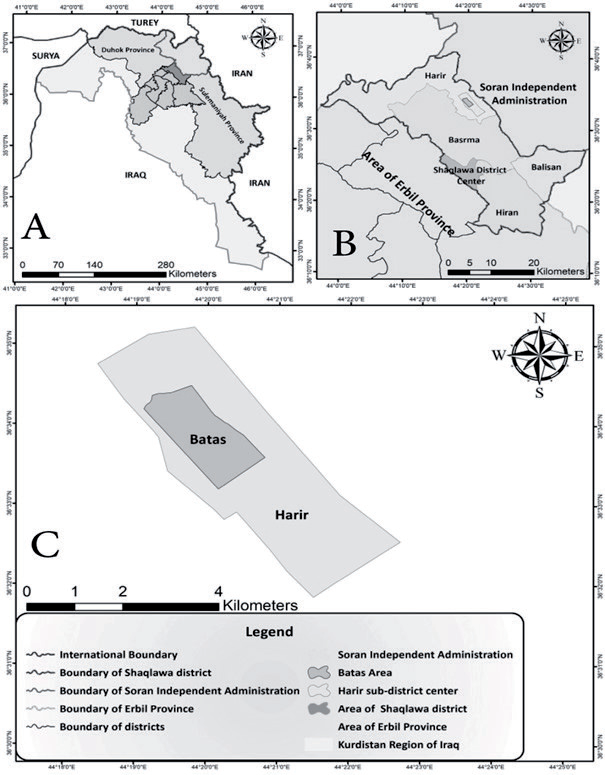
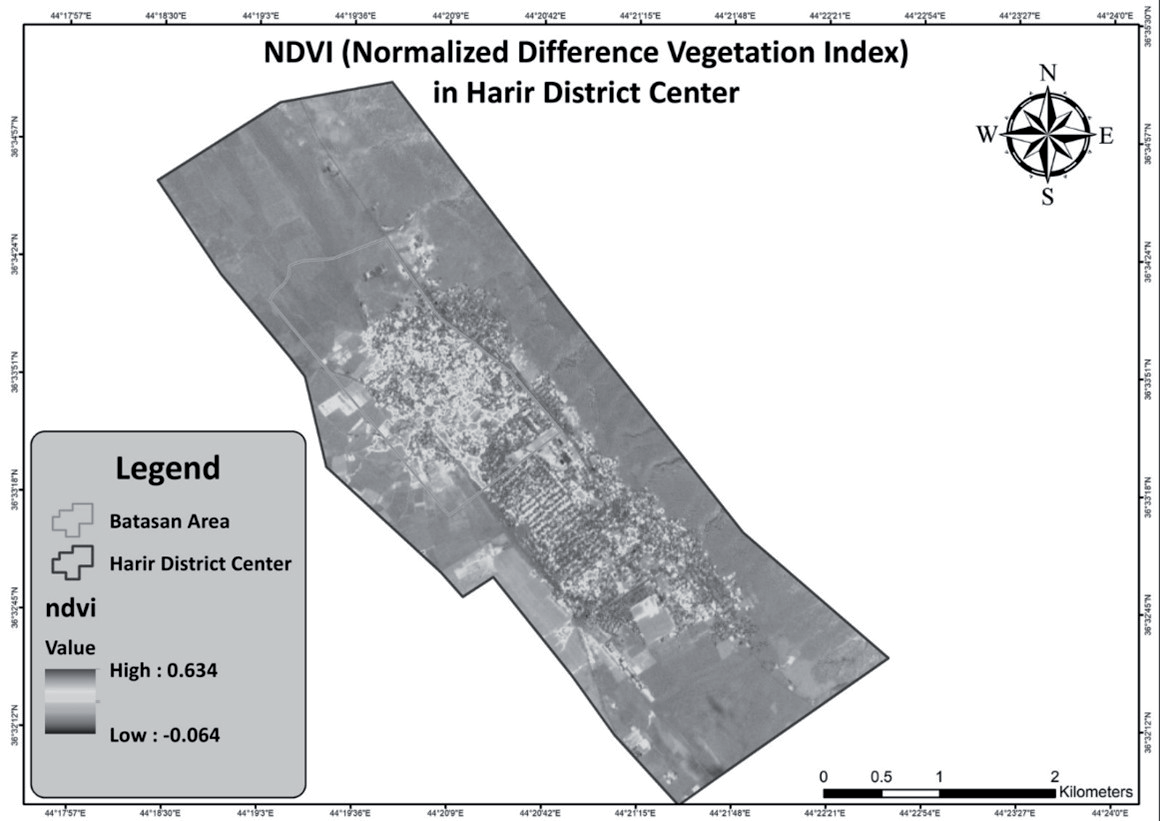
Harir subdistrict is a part of the Shaqlawa district in the Kurdistan Region’s Erbil Governorate. It is located 60 kilometers northeast of Erbil and connects parts of Soran, Badinan, and Erbil to the Iranian border (Fig. 1). The boundaries of Harir extend from latitudes 36°42’23’N and longitudes 44°29’08’E. There are 83 villages in the area surrounding the town of Harir with a population of approximately 22,000 people [20]. The geological formations are sedimentary, and the soil is silty clay with 3-5% organic matter content [21]. Soil temperature increases in the summer due to direct sunlight exposure [22]. Groundwater discharge in the Harir area increases during the rainy season but decreases during the dry season. The climate is semi-arid to arid, characterized by hot, dry summers and cold winters [22]. Soil, water, and temperature have a significant impact on rice crops in Harir’s and Bata’s regions. To evaluate the vegetation cover, the normalized difference vegetation index (NDVI) has been used to evaluate the vegetation cover and monitor crop growth [23], as shown in Fig. 2. NDVI is determined using spectrometric data in the red and near-infrared wavelengths. The data used in spectrometry is typically obtained from distant sensors like satellites. One of the most widely used indicators for tracking vegetation trends at both regional and global scales is the NDVI. This indicator, which ranges from 1 to -1, was developed by Tucker [24], with values greater than zero indicating the presence of vegetation cover and values less than zero indicating the absence of vegetation cover, such as in the desert, bare terrain, clouds, snow, icepack, water body, and glacier [25]. The current study revealed that the NVDI in the Harir area ranged from (0.634 to -0.064), indicating that the vegetation indicators seen through the NVDI are medium to poor.
Cultivated Rice
The harvesting season for rice starts in mid-June and ends in October. Farmers use a machine to level a flat area and prepare the waterlogged soil (Dorykha), which resembles a pond. Two days prior to planting, rice husks should be soaked in water so they turn green at the start of the growing process and the empty seed falls into the water and is discarded. Two varieties of rice husks are used in the Kurdistan region: white flower and Maulawi. The white flower is the most common variety since it is compatible with the water and air of the Harir region and has excellent flavor and quality compared with Maulawi husk. White flowers and Maulawi are also known as Sarda and Garma, respectively. Rice that is irrigated with cold water is of high quality [5]. From the time of planting until harvest, rice crops should be submerged in water. Experience and knowledge determine the best adaptation strategy and rice addition for wet soil. It has made it simpler for farmers to plant 50 kg of rice husks, which can yield roughly two tons of rice [5].
Collect Sample
In the Harir subdistrict, rice was harvested at three distinct ages: 3, 5, and 6 months. Each sample of rice had three replicates and was separated from the husks before being dried in the shade (Fig. 3). The samples were then mashed and kept as a homogeneous powder at –80ºC until extraction.
Proximate Analysis
According to the official analytical methodologies of the Association of Official Analytical Chemists [26], proximate analysis was used to determine the amounts of ash, moisture, protein, fat, and carbohydrates in rice samples. Three copies of each test were run on each sample.
Ash Percent (%): The ash content was calculated using the dry ashing technique [26]. In a furnace (Furnace 62700, Barnstead/Thermolyne, USA) set to 550ºC overnight, 5 g of dried C. nutans leaves were burned. After cooling in a desiccator, the remaining inorganic material was weighed. Where W2 = weight of ash, W2 = weight of sample.
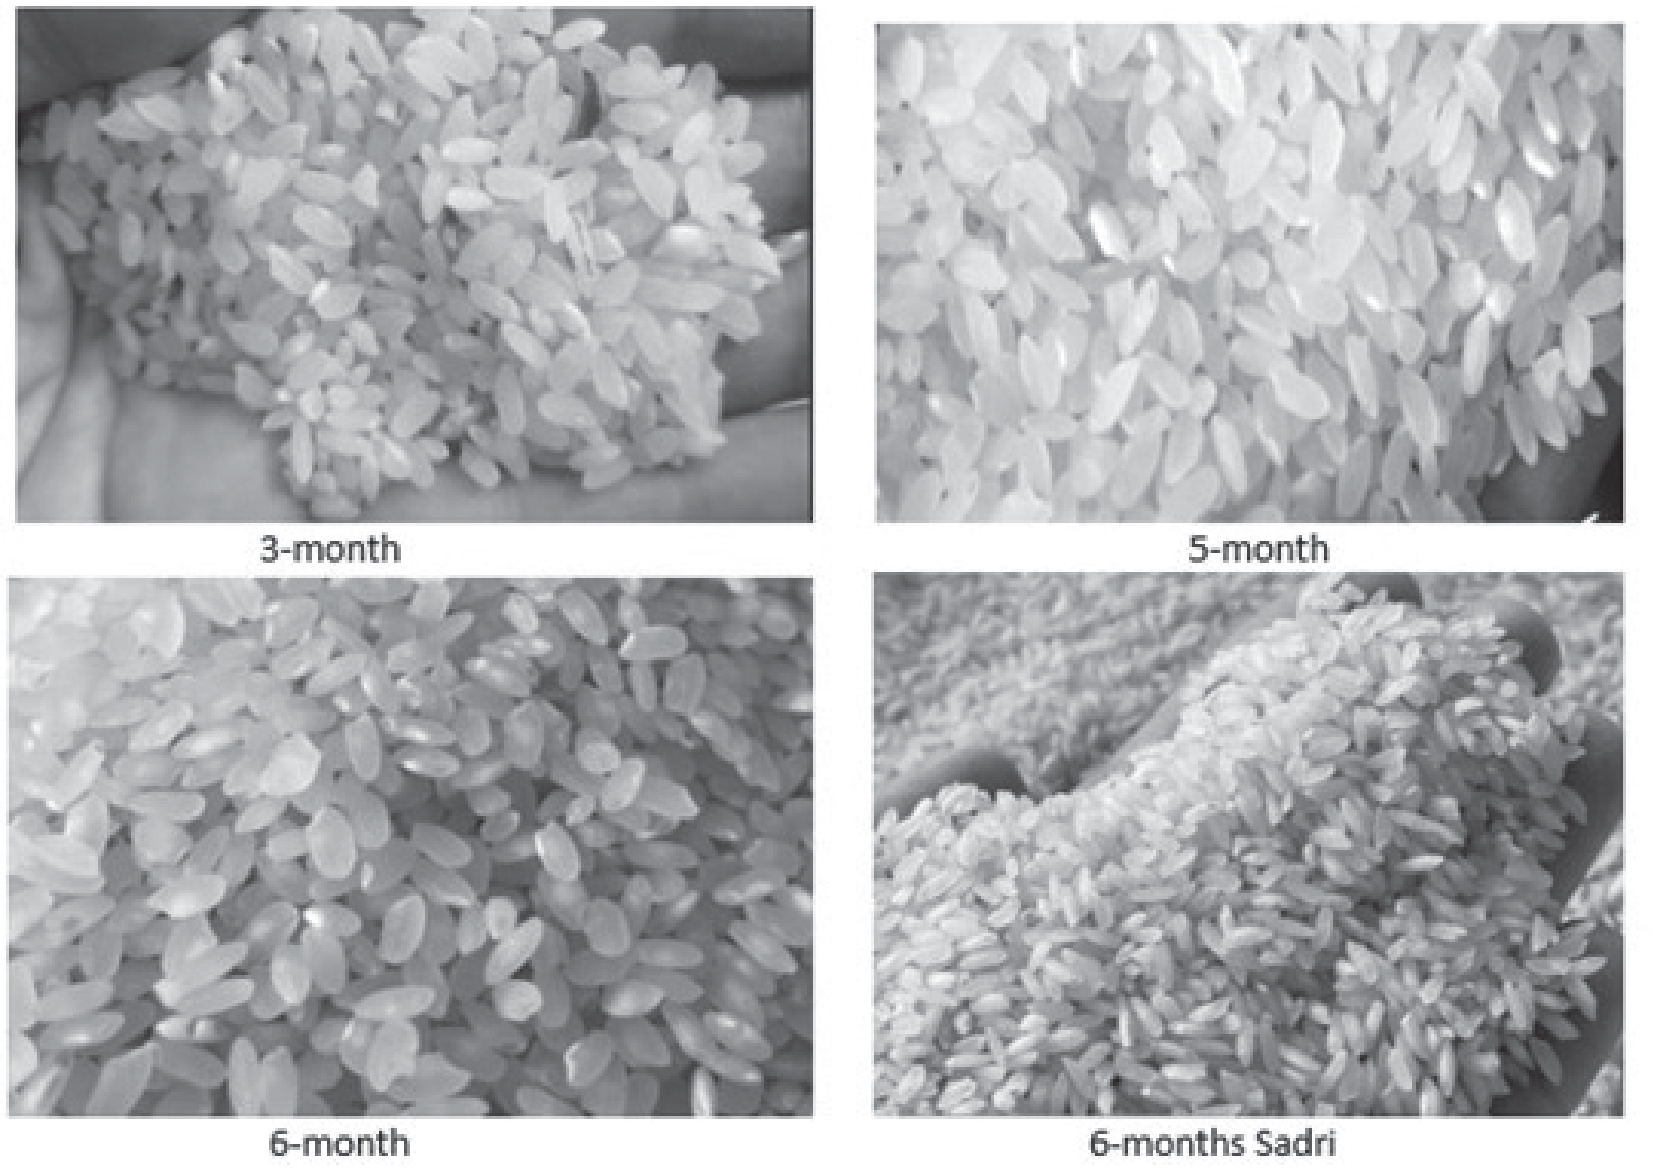
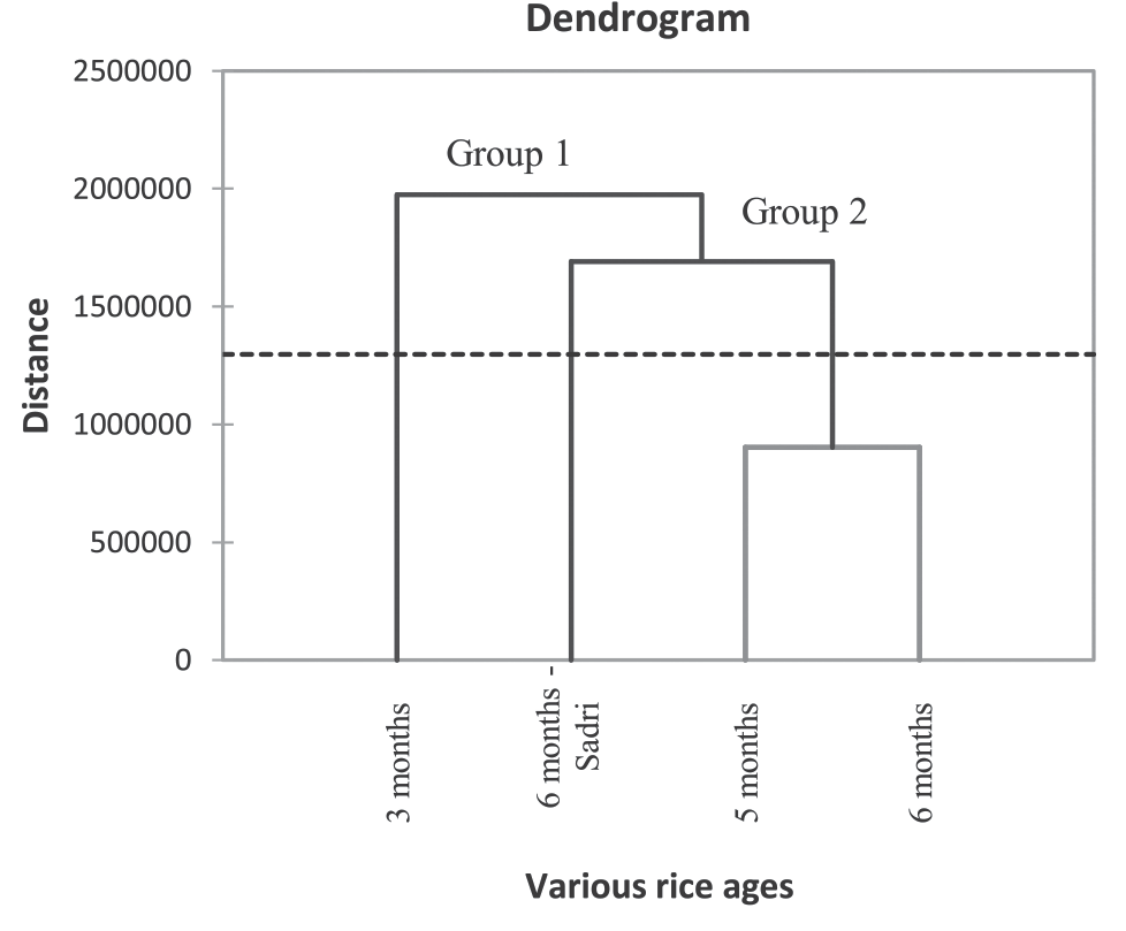
Fig. 4.
Hierarchical cluster analysis (HCA) of different rice ages according to the 37 bioactive compounds.
Moisture Percentage (%): Five g of dried C. nutans leaf samples were weighed using an aluminum dish and baked for the entire night at 105ºC. After being cooled in a desiccator to room temperature (25 0.5ºC), these samples were reweighed. Following is how the moisture content was determined: W2 = weight of the dry sample (g), W1 = weight of the wet sample (g)
Crude Protein (%): Crude protein was calculated using Kjeltec equipment (KjeltecTM 2200, Auto Distillation Unit, FOSS Tecator, Sweden). CuSO4 and KSO4 (in a conc. of 1:7) were first combined with one gram of dried plant material, and then 15 mL of H2SO4 (conc.) was added to the combination in a digestion flask. This combination was heated to a transparent state at 420ºC for two hours before being cooled. The solution was then poured into a a volumetric flask, and additional water was added to make a 100 mL volume. The Klejdahl apparatus received 10 ml of the digested mixture, 10 ml of sodium hydroxide, and 20 mL of boric acid. The liquid was heated while 2-3 drops of methyl red indicator were added, and a yellow tint eventually appeared. This solution was subsequently titrated against 0.1 N of HCl in a burette till the development of pink color. The following formula was used to determine the crude protein percentage. Where S = volume of used hydrochloric acid for sample; B = volume of used hydrochloric acid for blank; W = weight of the sample.
Vitamin C
Nielsen [27] used a mortar and pestle to pound 10 grams of each sample in order to make a plant extract and 50 ml of water was then poured into each sample independently to measure the vitamin C content. One thousand revolutions per minute centrifuged the solutions. To acquire the vitamin C extract, the supernatant was carefully decanted and filtered using filter sheets. The following procedures were used to prepare the indophenol dye’s reagents and the metaphosphoric acid-acetic acid solution: First, a 250 ml beaker with 50 ml of deionized distilled water was used to create the indophenol dye solution. While stirring, 42 mg of sodium bicarbonate and 50 mg of 2,6-dichloroindophenol sodium salt were dissolved. Use deionized distilled water to dilute the mixture to 200 ml. Filter into an amber bottle using fluted filter paper. Before using, cap or lid the bottle and keep it in the refrigerator. In order to create a metaphosphoric acid-acetic acid solution, 100 mL of deionized distilled water was added to 20 mL of acetic acid, and the mixture was stirred to dissolve 7.5 g of metaphosphoric acid. Add distilled water to the mixture to dilute it to 250 ml. Filter into a bottle using fluted filter paper. Before using, cap or lid the bottle and keep it in the refrigerator. 2 ml of the sample extract was combined with 5 ml of acetic acid and metaphosphoric acid as part of the method to measure vitamin C. Titrate with an indophenol dye solution following that. Until a faint but recognizable rose-pink tint persists, the titration’s endpoint is identified as a color (the solution’s preparation is described below). Using the equation below and the volume of titrant for each of your replicates.
where: X = mL for sample titration, B = average ml for sample blank titration F = titer of dye (= mg ascorbic acid equivalent to 1.0 mL indophenol standard solution) E = ml assayed (= 2 ml), V = volume of initial assay solution (= 7 ml) Y = volume of sample aliquot titrated (= 7 ml)
Crude Fiber (%)
According to Taran et al. [28], the technique involved mixing 2 g of plant sample with 200 ml of NaOH (2%) in a beaker, heating it for 30 min in a water bath, and letting it cool to room temperature. Whatman filter paper No. 4 was then used to filter the solution. Hard water was used to wash the filtrates in order to eliminate any acid. The filtrate was then placed in a crucible, dried there for 4 hours at 105oC, and the crucible’s weight (W1) was recorded. After that, the crucible was once more heated to 550ºC for 4 hours in a muffle furnace. After 30 minutes of cooling in the dissector, the crucible was weighed once more (W2).
The authors Dey and Ku determined soluble sugar [29] A homogenate made from 100 mg of seed and 10 ml of ethanol (80%) was centrifuged at 5000 rpm for 15 minutes. By adding distilled water, the volume of the extract was increased to 100 ml. To make the reagent, mix 100 ml of ice-cold 95% H2SO4 with 200 mg of anthrone (9,10-dihydro-9-oxoanthracene). Six milliliters of the anthrone reagent were applied to each test tube after receiving one milliliter of the extract. The tube was then submerged for 10 minutes in a boiling water bath before being allowed to cool under running water. Similar procedures were used to prepare a blank that had no rice sample. After some time, the test tubes began to take on a blue hue. A spectrophotometer was used to detect the hue’s intensity at 620 nm. A standard curve was used to determine how much sugar was present in the sample of rice (Y = -0.0371 + 0.4171, R = 0.97). Standard glucose was created by dissolving 100 mg of glucose in 100 ml of water, and working standard was 10 ml of stock diluted to 100 ml with distilled water. The percentage of carbs was used to express the results. Amount of carbohydrate present in 100 mg of the sample.
Total Phenols
With slight adjustments, the Folin-Ciocalteu technique was used to determine the total phenolic content of seed extracts [30]. In a nutshell, 1 ml of seed extract and 1 ml of Folin-Ciocalteu’s phenol reagent were combined, and the mixture was allowed to react for 5 min. Then, 10 ml of a 7% sodium carbonate solution (w/v) were added, and 25 ml of deionized water was added to make the final volume. Using a Thermo Spectrophotometer (Electron Corporation, Cambridge, England), the absorbance at 750 nm was measured after 1 hour of reaction at room temperature. The results were [Y = 7.7538 x 0.121, with R2 = 0.998], and the total phenolic concentration was expressed as grams of gallic acid equivalents per 100 g of sample on a wet weight basis. Measurements were calibrated to a standard curve of prepared gallic acid solution with different concentrations.
Antioxidant Analysis
The antioxidant activity of the samples was calculated on the source of the scavenging activity of the stable 1, 1-diphenyl 2-picrylhyorazyl (DPPH) free radical [28]. 100 cc of methanol added to a sample weighing 0.0005 grams results in a solution containing 0.004% DPPH. The test tubes were then incubated in the dark for 20 minutes after adding 4 ml of DPPH solution and 1 ml of the sample solution. The prepared solution was introduced to the 517 nm absorbance spectrum after incubation. DPPH in methanol was used as the control, and the difference in absorbance between the control and test samples revealed the degree of DPPH radical scavenging. Three runs of the experiment were completed [28]. Lower absorbance was a sign of a higher scavenging activity. The proportion of scavenging activity determined by the formula: Where B is the sample’s optical density and A is the blank’s optical density.
Polyphenol Extraction
To extract the polyphenols, two grams of the powdered sample were removed. Following this, 4 mL of a methanol solvent containing 1% acetic acid was added. Ultrasonic waves were then used to conduct the extraction procedure for 20 minutes. The phenolic acids were isolated, recognized, and quantified using the HPLC (high-performance liquid chromatography) apparatus model 1100 series (Agilent USA). It was equipped with a column oven set to 25ºC, a degassing system, a 20-microliter injection loop, four solvent gradient pumps, and a diode array detector with settings for 250, 272, and 310 nm, respectively [31].
Fatty Acid Analysis
One hundred grams of plant powder and 500 ml of hexane were put in a flask with a round bottom, and a Soxhlet chamber was then set up to extract the mixture for 6 hours at 50ºC. In order to prevent thermal destruction of the bioactive components, the extracts were heated to a gentle extraction temperature of 50ºC before beginning the distillation process. After the extraction process was complete, the solvent and extractor were put in a water bath to let the solvent evaporate. To extract seed oil, a soxhlet method was employed. The oil samples were thoroughly homogenized using a vortex, and each sample was precisely weighed at 100 mg. The fat was then transformed into methyl ester by adding 3 ml of soap methanolic potassium hydroxide (2 M) and 5 ml of methanolic sulfuric acid (12% v/v). The fatty acid methyl ester was extracted using one milliliter of ordinary heptane, and the fatty acid profile was evaluated using a gas chromatography-mass spectrophotometer (GC-MS) (Agilent HP 6890 Series coupled with Agilent HP 5973 Mass Selective Detector). The standard fatty acid solution made by Sigma Company was used to identify each fatty acid by comparing the inhibition times [31].
Elemental Analysis
In borosilicate glass digestion tubes, the dried samples (0.5 g) and the solid sample were added. 10 mL of HNO3-HCl-H2O2 (8:1:1, v/v/v) were added to each of the tubes, and the tubes were then put on a heating block with the temperature adjusted to rise to 120°C for approximately 3 hours or until the solutions were thoroughly digested. Following completion of the digestion, the clear solutions were poured into 50 mL volumetric flasks and diluted with ultrapure (UP) water. High-density polyethylene bottles were used to hold the diluted samples until analysis. The samples were examined twice. 10 mL of HNO3-HCl-H2O2 (8:1:1, v/v/v) was used as a blank solution [32]. Then, it was examined using two instruments with a broad operating range: an inductively coupled plasma mass spectrometry (ICP-MS) instrument (4500 Elan DRC, Perkin Elmer, ION 300X, USA model) and an inductively coupled plasma-optical emission spectrophotometric (Optima 5300 DV ICP-OES, Perkin Elmer Instruments, USA) [33].
Statistical Analysis
In the current study, all of the data were checked for normality before statistical analysis using the PROC UNIVARIATE SAS software approach. Each result’s means and standard error of the means are shown in the tables (SEM). In order to explain the results of the ANOVA in terms of statistically significant differences in group means, Tukey’s post hoc comparison test was performed (Graph Pad Prism 9.5.1). A 95% level of confidence was used for statistical operations. Additionally, to distinguish the various rice ages by phytochemical substances, principal component analysis (PCA) and hierarchical cluster analysis (HCA) were carried out on the data analyzed with XLSTAT.
Table 1.
Proximate analysis of rice with various ages in the Harir sub-district.
Results and Discussion
Proximate Analysis in Rice Samples
Rice is a key crop in many parts of the world, and people frequently consume it to obtain calories and a variety of nutrients. Kurdish rice 6 months and Sadri are two of the most prominent agricultural products in the Harir subdistrict. Table 1, presents the results of the proximate analysis of the studied rice in Harir sub-district at the stages of growth from 3 months to 6 months. There was a significant difference (p≤0.05) in the proximate compositions of the rice varieties studied. At 3 months of harvest age the ash, nitrogen, protein, vitamin C, and fiber contents were found the highest which were significantly higher than the 5- and 6-month harvest age. The ash content ranged from 8.82 at 6 months to 11.84 at 3 months. The carbohydrate content of the rice variety in Harir sub-district is low ranging from 25.8 at 3 months to 48.5 at 5 months. This is not in agreement with the work of Adeyeye et al. [34] who reported high content of carbohydrates in the studied rice varieties. Vitamin P or rutoside are other names for rutin. Its structure includes the disaccharide rutinose and the flavonolic aglycone quercetin glycoside [34]. According to Ganeshpurkar and Saluja [35], rutin exhibits a variety of pharmacological properties including anti-oxidant, cytoprotective, vaso-protective, anti-carcinogen, neuroprotective, cardio-protective, and anti-hyperglycemic and anti-oxidant activity in streptozotocin-induced diabetic rats [36]. It should be noted that various factors, including the genetic makeup of the rice, the time of harvest, the parts used, and the growing conditions as well as the type of solvent used for the extraction, may have an impact on the types and amounts of compounds found in the current study as compared to earlier reports [37]. Prior studies on the proximate analysis of rice were scarce. The rice bran’s proximate analysis was determined by two researchers. White rice bran from Indonesia was reported to contain 11.22% moisture, 14.39% fiber, 42.87% carbohydrate, 10.74% protein, 11.42% fat, and 8.23% ash [38]. Contrary to our study, Kurdish rice at Harir sub-district contains maximum of 11.84±0.08% ash, 1.77±0.05% moisture, 14.25±0.07% protein, 41.03±0.01% fiber and 48.5±0.28% carbohydrate.
Polyphenolic Compounds in Rice Samples
Table 2 presents the total phenolic compounds through the harvest age of the rice samples in the Harir sub-district by using high-performance liquid chromatography (HPLC). All the compounds showed highly significant differences (p<0.05) among the harvest ages of the rice samples. Nine compounds were identified in our study, the absence of other compounds may be a result of the diversity of these chemicals naturally occurring in plants (as in the current study) or a difference in the growing environment where the samples were collected (as in the prior study). The amount of chlorogenic acid (800.8±0.05 ppm) was the highest among the detected compounds. These compounds are found to be different and related to age (Table 2). At 5 months of harvest age gallic acid recorded the highest (120.4±0.21 ppm) followed at 6 months by sadri (47.4 ±0.20 ppm) in the rice samples. Similarly, caffeic acid recorded the highest (863.6±0.23 ppm) at 5 months of harvest age, which is significantly similar at 6 months of harvest age, followed by at 3 months (502.9±0.05 ppm) harvest age. Chlorogenic acid, rosmarinic acid and quercetin recorded high content in the rice samples studied at 3 months harvest age, with 800.8±0.05 ppm, 67.7±0.11 ppm, and 478.5±0.14 ppm respectively, while the lowest content of these compounds was found at 5 months harvest. This indicated that at the early harvest of the rice samples, the phenolic compounds were significantly high and later decreased with plant age increase. This is in contrast to rutin, coumaric and apigenin compounds that increase as the harvest age of the rice sample increases (Table 2). However, the cinnamic acid compound in the rice samples was found to be significantly highest at 6 months of harvest age (25.4±0.20 ppm) followed by at 6 months Sadri which recorded 11.0±0.57 ppm. Furthermore, the results of the current study showed that different harvest ages of the studied rice samples contained different levels of phenolic compounds. The presence of large amounts of phenolic compounds in the rice samples may contribute to their antioxidant activities and their ability to adsorb and scavenge free radicals [39]. This finding is in agreement with the findings of Aali et al. [40]. Our results indicated that rice from the Harir subdistrict may contain compounds that may play a role as antioxidants, which in turn help in disease prevention. As well as anthocyanin, one of the flavonoid groups, for its cancer preventive activities, several studies have documented the contribution of plant phenolic content to antioxidants, cytotoxicity, and apoptosis in cancer cell lines [41]. Therefore, Harir rice’s phenolic and anthocyanin content may support its antioxidant, cytotoxicity, and induction of apoptosis in cells. It should be mentioned that the second metabolites, or active substances, are produced following photosynthesis in the early green leaves of rice. Different harvest seasons, ages, parts, growth conditions, and the type of solvent used for the extraction could all have an impact on the differences in the types and quantities of chemicals in the same plant found in different research studies. Furthermore, Sumczynski et al. [42], found that different rice cultivars, including rice from the Harir sub-district, exhibit considerable differences in the types and concentrations of phenolic compounds. The formation of phenolic compounds in grains is influenced by a range of factors, including harvesting and planting methods, growth habitats, variety, the ripening phase, storage, and the extraction procedure. Polyphenols’ ability to treat or prevent renal issues has been studied [43]. The interest in these compounds is mostly driven by their ability to control inflammatory and redox pathways. Scientific evidence indicates that reactive oxygen species (ROS) and inflammation play significant roles in the pathophysiologic processes of renal diseases. Acute renal failure, obstructive nephropathy, and chronic renal failure are only a few of the renal impairments that have been associated with oxidative damage [44]. The kidney is an organ that is especially vulnerable to ROS attack [45]. Consequently, anti-inflammatory, antioxidant nutritional and pharmacological therapy may reduce kidney damage [46].
Table 2.
The polyphenol content of rice using HPLC at different stages in the Harir sub-district.
Fatty Acid Content in Rice Samples
The fatty acid content of the studied rice samples by gas chromatography at different harvest ages is presented in Table 3. Twenty-six different fatty acid compounds were detected in the rice samples in this study, which differed significantly when compared with the different harvest ages. All the fatty acid compounds found in the studied rice recorded the highest content at 3 months harvest age compared to other ages except Undecanoic acid methyl ester, Pentadecanoic acid methyl ester, Lignoceric acid methyl ester, alpha-Linolenic acid methyl ester, and Behenic acid methyl ester, which recorded their highest content at 5- and 6-month harvest ages. At 3- and 5-month harvest ages, caprylic acid methyl ester (C8:0) was not detected until 6 months harvest age with a very low amount (0.1±0.02 ppm) but significantly (P<0.05) increased at 6 months Sadri (0.21±0.01 ppm). Capric acid methyl ester (C10:0) increased as high as 15.07±0.02 ppm at 3 months of harvest age, this decreases as the harvest age increases significantly. The fatty acid content of the rice samples ranges from as low as 0.04±0.00 ppm at 6-month harvest age in cis- 11,14-Eicosadienoic acid methyl ester (C20:2) to as high as 31.54±0.01 ppm at 5-month harvest age in Lignoceric acid methyl ester (C24:0). The range is in agreement with earlier results reported by Lourith and Kanlayavattanakul [47]. Rice at three months had a lower percentage of saturated fats (65.7%) and a higher percentage of unsaturated fats (33.51%). This indicated that the content of fatty acids in the studied rice differed with respect to harvest time and age. In this study, the fatty acid contents of the rice in the Harir sub-district studied were low.
Table 3.
The gas chromatography measurements of the fatty acid content of rice at various ages. in the Harir subdistrict.
Mineral Content in Rice Samples
Techniques were used after grounding, and pressing the samples in the sample containers to analyze 17 minerals (Ca, Na, K, Fe, Cu, Zn, Cr, Hg, Cd, Co, Ni, Mg, Mn, Pb, Se, Mo and As) throughout the harvest ages of the studied rice samples in mg/100 g of the Harir sub-district. The maximum amount of mineral was Ca for all the samples, which ranged from 467±0.57 mg/100 g at 6 months Sadri harvest age to 165±0.33 mg/100 g at 6 months harvest age. This is followed by K with concentrations of 176±0.57 mg/100 g and 176±0.56 mg/100 g at 3-month and 6-month harvest ages respectively. The lowest/no amount of minerals recorded in the rice samples at the Harir sub-district during the study period were the heavy metal elements (Cr, Hg, Cd, Co, Pb, Ni and As) except copper, which recorded up to 57.9±0.06 mg/100 g at the 6 -month Sadri harvest age, which was significantly (p<0.05) higher than at 3, 5 and 6 months harvest ages (Table 4). Nowadays, there are many new high-performance and low-cost technologies used to detect the amount of minerals in foods. Different types of food have minerals naturally, and those that are grown straight from the soil, like rice, contain more of them. Human intervention in the form of mining and the use of fertilizers in agriculture can be the primary causes of metal buildup. Since rice is a staple food, cultivating it in hazardous compound-filled soils poses a major health danger to people [48]. Generally, there is a significant difference (P < 0.05) between mineral concentrations in all the samples. Phosphate plays an essential role in cellular energy, the transfer of energy, and protein metabolism [49]. Macronutrients such as Sr were not found in all samples. The Sr has a side effect on health, especially renal function [50] so that means this rice sample will be safe in terms of the Sr. Also, the concentration of Sr In Uruguayan rice was close to our results, which contained a very small amount [51]. According to Abdukadir [1], the samples of Iraqi PDS (public distribution system) rice and India-3 rice did not contain Cr, and other samples had a small amount that did not exceed more than 0.070 mg/kg and was lower than safe limits concluding that in terms of Cr concentration, all rice samples are acceptable for health. This is in line with the findings of this study. On the other hand, all samples contain a small quantity of Cu that is between 57.9±0.06 mg/100 g and 33.1±0.05 and its source may come from soil, fertilizer, or during the whitening process for rice to look brighter and whiter [51]. Among all the rice samples analyzed, the macro-mineral K, which was between 176±0.57 to 131±0.43 mg/100 g, and the macro-mineral Mg, was between 67.3±0.05 and 23±0.33 mg/100 g, respectively, were comparable to the observations of Malaysian rice [48]. In addition to these, essential micronutrients such as Mn, Zn, and Fe were found in low amounts in all samples, but Zn was higher than Mn and Fe. Generally, a low level of Zn in polished rice is reported compared to unpolished rice [52]. In this study, all samples contained Zn ranging between 154±0.57 mg/100 g and 87±0.57 mg/100 g in the Harir sub-district. Staple foods such as rice may have a deficiency in Zn and Fe. In addition, Zn, Fe, Ca, and Mn are necessary micronutrients that must be included in a person’s usual diet because a lack of them might have negative health effects [52].
Table 4.
The selected mineral content of rice at different ages in the Harir sub-district.
Classification of Bioactive Compounds in Rice Samples
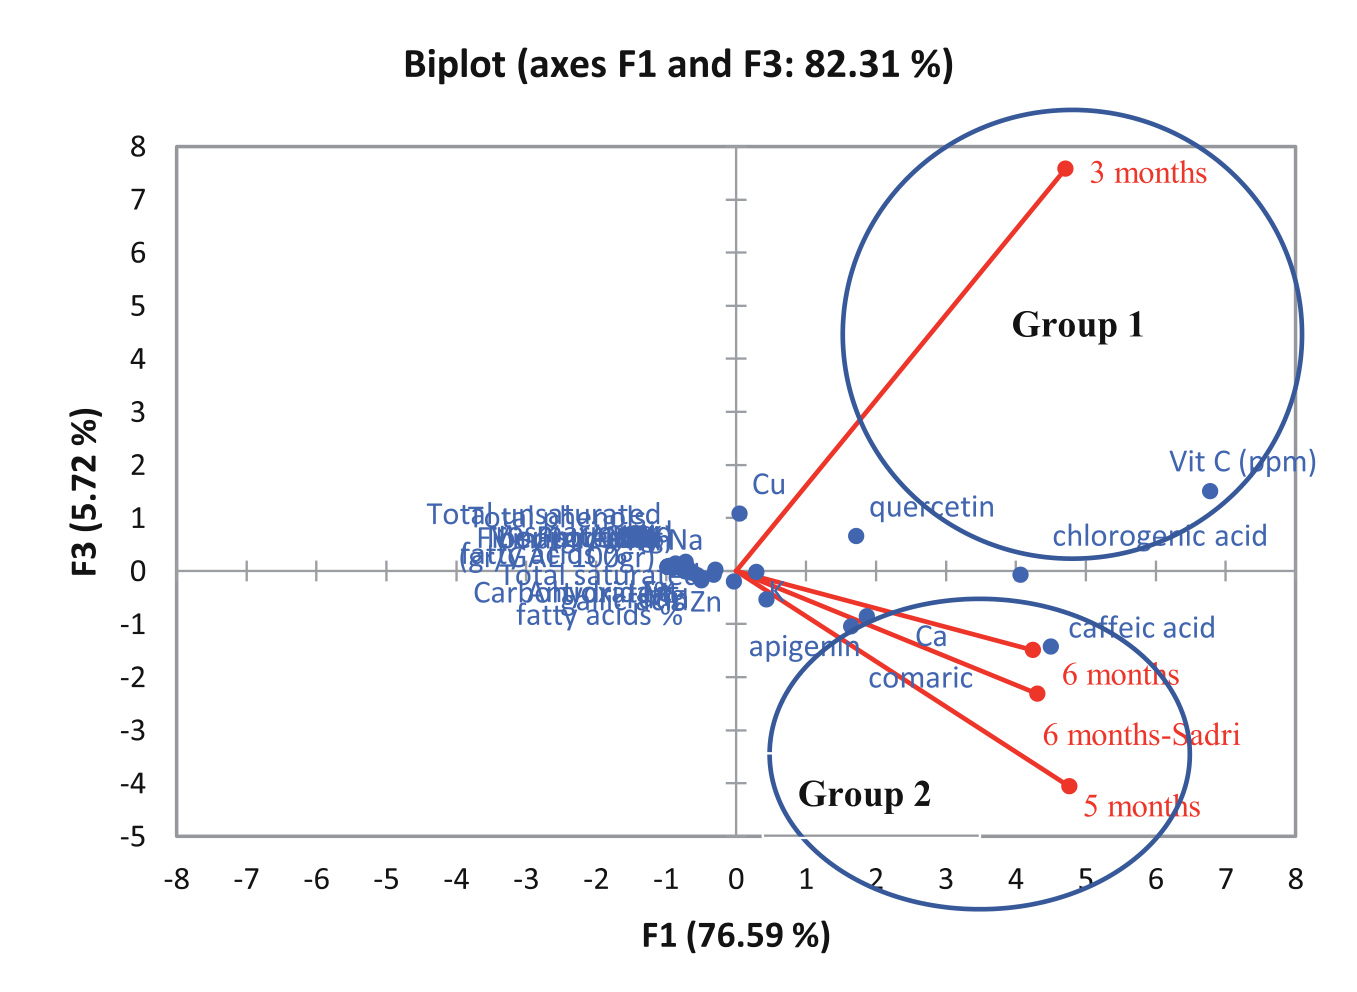
Hierarchical cluster analysis (HCA) and principal component analysis (PCA) classified the variety age according to the 37 bioactive substances characteristics (Ash, moisture%, N%, protein%, vitamin C, Fiber%, carbohydrate%, total phenols, antioxidant, gallic acid, caffeic acid, chlorogenic acid, rutin, coumaric, rosmarinic acid, quercetin, cinnamic acid, apigenin, total saturated fatty acids%, total saturated fatty acids%, Ca, Na, K, Fe, Cu, Zn, Cr, Hg, Cd, Co, Ni, Mg, Mn, Pb, Se, Mo, As). The Ward linkage approach was used to conduct a cluster analysis (Fig. 4). Based on this data, the different rice age groups were separated into two major clusters. The highest value for ash, nitrogen, protein, vitamin C, fiber, quercetin, rosmarinic acid, total unsaturated fatty acids, Na, K, Cd, Pb, and Se was intended for the first cluster, 3 months old rice age. Six months of Sadri were chosen for the second cluster because they had the greatest levels of total phenols, antioxidants, Ca, Cu, and Pb. Fig. 5 shows that the PCA classification is supported by cluster analysis. To make the multi-dimensional graphs simpler and provide a two-dimensional map that explains the observed variance, the PCA was used. The first and third PCA components (76.59% for PC1 and 5.72% for PC3) together explained 82.31% of the overall variance. The first component (PC1) has a close connection to quercetin, chlorogenic acid, and vitamin C. The samples are divided depending on the amounts of caffeic acid, apigenin, coumaric acid, and Ca in the third main component (PC3). The PCA and HCA were viable methodologies for determining the nutritional value of various rice age classifications. Many phytochemical investigations of various age rice have been published, demonstrating their bioactive chemical constituent antioxidant potential. According to numerous study organizations, chlorogenic acid, vitamin C, and polyphenol found in seeds rice has antioxidant properties.
Conclusions
This study is the first to document how the harvest season affects the nutritional and phytochemicals substance extracted from Kurdish rice grown in the Harir sub-district. Our study sheds light on the possible health advantages of Kurdish rice and raises the point that the timing of harvest is crucial for creating functional foods from rice extracts at various harvest ages. It was discovered that multivariate analysis was an effective technique for categorizing the bioactive components of different ages of Kurdish rice. The rice samples typically had a higher amount of the discovered chemicals at the early harvest age (3 months) than at the later stage (6 months). However, the bioactive chemicals are created as a second metabolite following photosynthesis and are then transported to other sections of the plant at a later stage of its life cycle. As a result, at certain points during the plant’s life cycle, different plant parts will have varying types and quantities of chemicals. Regarding bioactivity and the clinical doses for safe intake, more research is needed. Hence, it is recommended that farmers harvest rice at young ages with high phytochemical content in order to increase rice yield and achieve economic independence with fewer inputs of time, labor, and money.

