


Introduction
Rice (Oryza sativa L.) is one of the most important food crops worldwide, as more than half of the world’s population depends on it as a basic food [1-2]. It provides more than 20% of total calories and 15% of the needed protein per person [3-4]. Therefore, the grain quality characteristics, such as grain length and width, protein content, amylose, and milling percentage, are among the most important determining factors in large-scale growing and marketing new varieties [5-6].
The consumer’s choice of variety is determined by high grain quality, nutritional content, an affordable price, and overall taste. The grain quality also determines its economic value, the extent of its exportability, the expansion of its cultivation, and the acceptance of farmers to grow in large areas [7-11]. For these reasons, rice breeders have worked to improve the quality characteristics of modern varieties by transferring genes using traditional breeding through different crosses between varieties [12-13, 4]. On the other hand, biotechnology tools were used to produce many varieties enriched with nutritional elements, such as the Golden rice variety, which has a high value of beta-carotene, which was responsible for producing vitamin A, and this was achieved through genetic engineering [14-16].
Increasing the yield and keeping the superior grain quality was done through hybrid rice, which increases grain yield by more than 20 percent, an advantage over improved inbred varieties. Currently, several hybrid rice and high-yielding rice varieties are cultivated across different countries, and their cultivated area is increasing yearly [6, 8]. Therefore, it is necessary to evaluate these hybrids in terms of grain quality compared to inbred rice varieties [17-19]. In general, there are major factors that affect the quality of rice, including the genetic composition of the variety, environment, harvesting methods, storage, and milling processes [20]. Since genetics plays a significant role in controlling these traits, it is necessary to assess the degrees of inheritance and genetic improvement in new varieties [12, 16, 21]. The objectives of the current study are, first, the evaluation of three hybrids of different types in addition to five rice varieties for the characteristics of grain quality traits. Second, study the assessment of genetic parameters and the relationship between the traits.
Experimental
Rice Genotypes
This study included eight rice genotypes, three hybrids (Hybrid 27P31, Hybrid 28P67, and Egyptian Hybrid1), and five inbred varieties (Giza177, Giza182, Sakha101, Sakha104, and Sakha108) (Fig. 1 and Table 1). The current research was conducted at the experimental farm of Rice Research & Training Center (RRTC). Seeding at 30 days was transferred to the permanent field and transplanted at a spacing of 20×20 cm, with 7 rows wide and 5m long, using a randomized complete block design (RCBD) with three replications. The recommended cultural practices for rice cultivation ensured proper employment.
Grain Quality Characteristics
Grain Dimensions for Paddy and Milling Traits
After harvesting and drying the samples, these traits were measured to reach the optimum moisture percentage of 14% to 16% for each genotype. Grain dimensions for paddy and milling rice, including grain length, grain width, grain thickness, and grain shape (mm) were recorded as the average of thirty paddies and milling grains from each rice genotypes and measure the dimensions to obtain the average length and width of the paddy grains and the same in milling domination traits [22]. To get the paddy shape, the following equation can be used:
Length to width ratio (L/W) = average paddy length/average paddy width ×100
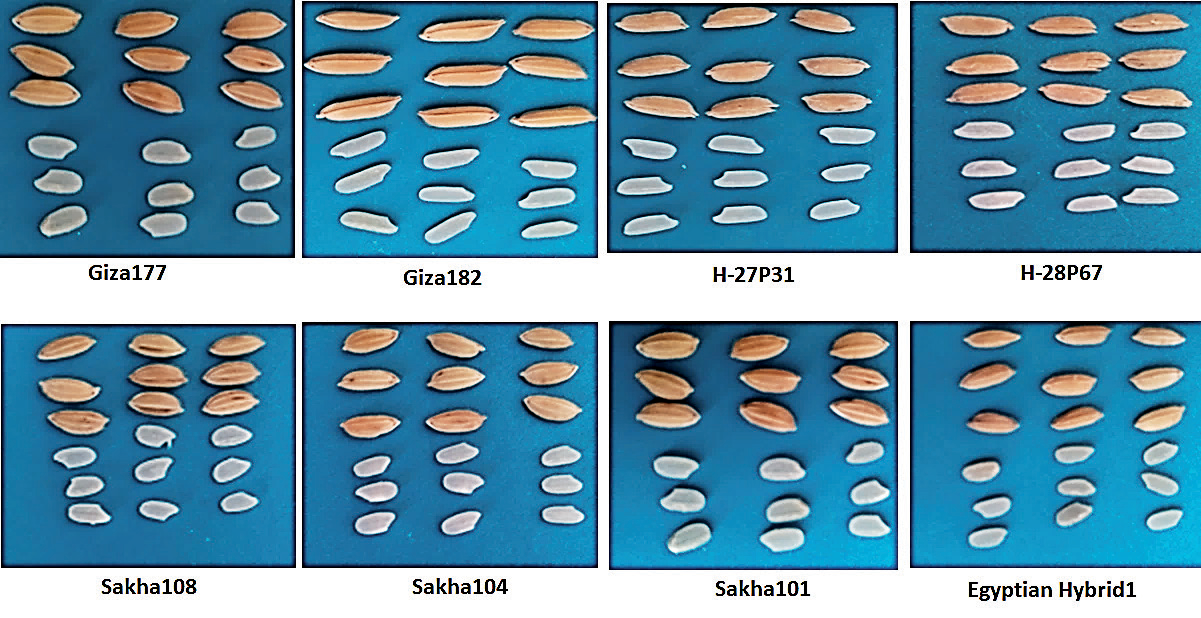
Table 1.
Rice genotypes, parentage, type, origin, and grain type.
Milling Traits
For milling processes, 150 g of each genotype of well-dried paddy was hulled in a mini “Satake Rice Machine” to get brown rice. The brown rice was passed through the “Satake Rice whitening and caking machine” to obtain uniform polished grains. The polished samples were sieved to separate whole from broken kernels. A total of twelve traits, including moisture content, empty and dead grains, total white rice, breakage in white rice, head rice percentage, husking grain ratio, milling, yellow and damaged grains, chalky grain, cracks, hardness ratio, and amylose percentage, were measured using the formula:
Milling% = weight of milled rice divided by weight of brown rice ×100
Head rice% = weight of whole grains/weight of paddy samples ×100
Broken% = weight of broken grains divided by weight of paddy samples × 100
Cracked grains% = number of cracked grains/100 grains ×100
Chalky grains% = weight of chalky grains divided by weight of milled rice ×100
Yellow grains%= weight yellow grains divided by total weight of milled rice × 100.
However, hulling percentage was computed on the amount of weight of hulling rice divided to weight of brown rice by 100, milling percentage was computed on the amount of weight milling rice divided to weight of brown rice by 100, while head rice percentage was computed for the amount of weight of whole grains divided to the weight of paddy samples by 100, as previously detailed by Adair [23].
Cooking Qualities of Grains
The grain cooking test included cracks %, hardness ratio, amylose %, gel stability ratio, gelatinization temperature, and cooking time, which were all determined according to the methods of Williams et al. [24]. However, gelatinization temperature (G.T.), which was visually graded on a 7-point numerical scale devised by Little et al. [25] and Pang et al. [26] and split into classes to represent processes such as alkali spreading and removal of starchy endosperm as follows, 1) no effect on the kernel (very high); 2) swollen kernel (high); 3) swollen kernel, collar incomplete or narrow (high-intermediate); 4) swollen kernel, collar complete and wide (intermediate); 5) split or segmented kernel, collar complete and wide (intermediate); 6) kernel scattered, blending with the collar (low); 7) completely scattered and intermingled kernel (very low). Little et al. [25] and Juliano [27], determined the elongation and amylose percentages and the varieties were classified according to amylose ratio to waxy (0-5.0%), very low (5.1-12%), low (12.1-20%), intermediate (20.1-25%) and high (>25.0%).
Statistical Analysis
Analysis of variance was conducted for each season separately. Two experiments were statistically combined over two seasons because the error variances of the experiments were statistically homogeneous, as reported by Leonard and Clark [28]. Experiments were then subjected to analysis using analysis of variance, which was utilized to separate gross phenotypic variability into components attributed to genetic (hereditary) and non-genetic (environmental) factors, and to estimate their relative magnitudes. Comparably, the overall diversity among phenotypes when produced in a variety of relevant conditions is known as phenotypic variance [29]. Thus, the formula of Wricke and Weber [30], Prasad et al. [31] was used to estimate variance components, genotypic (Vg), phenotypic (Vp), or error (Ve) variances. According to Allard [32], broad-sense heritability (h2b) was calculated on a genotypic mean basis. To assess the genetic relationships among genotypes, dissimilarity coefficients were calculated according to Sneath and Sokal [33]. Similarity matrices were generated using NTSYS-PC version 2.1 [34].
Results
Analysis of Variance
The analysis of variance (ANOVA) for all studied quantitative and grain traits revealed the presence of highly significant differences (P < 0.001) among the eight rice genotypes (Table 2), indicating the existence of high and inherent variation among genotypes. Therefore, there is a high possibility for improvement of grain quality traits through the selection and hybridization of better parental genotypes.
Grain Morphology Measurements
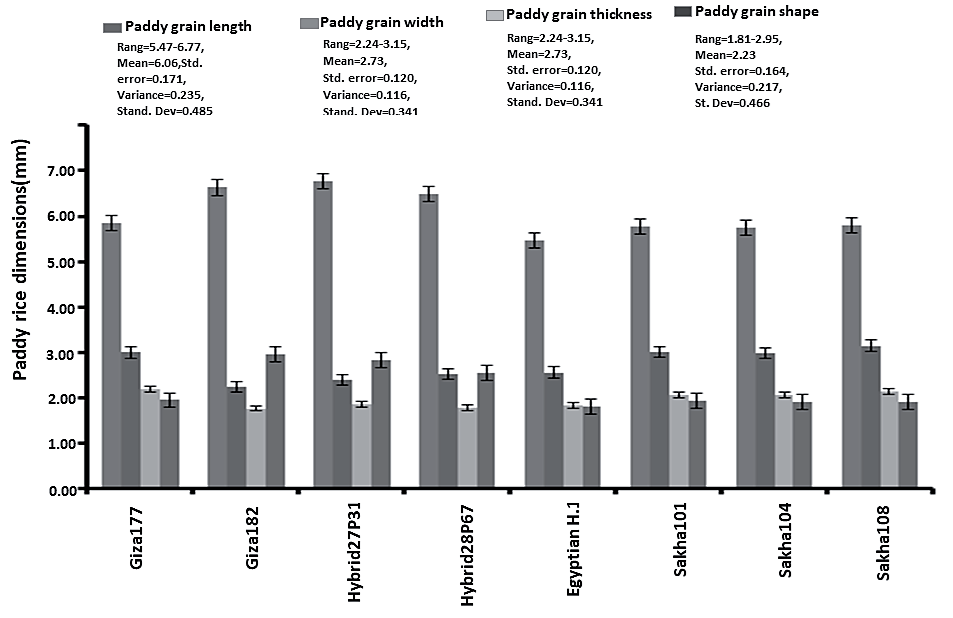
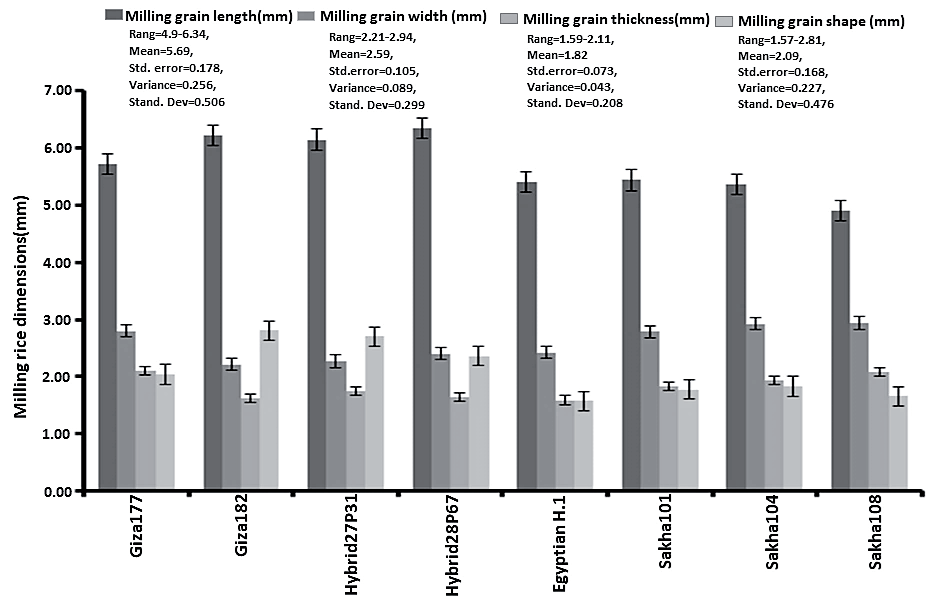
The means of paddy grain and milling grain dimensions (grain length, grain width, grain thickness, and grain shape) are summarized in Table 3. For paddy and milling grains, three genotypes, namely, Hybrid27P31 (6.77mm), Giza182 (6.63mm), and Hybrid 28P67 (6.48 mm), yielded the same length in both paddy and milling rice. In any case, these genotypes are distinguished by their long grain. While in terms of grain thickness and grain width, four genotypes, Giza177, Sakha108, Sakha101, and Sakha104, gave high values, these genotypes belonged to the Japonica type. Meanwhile, Egyptian Hybrid1 gave the lowest value for paddy and milling grain dimension traits (Figs. 2 and 3). These genotypes were produced as Indica-Japonica types (Table 3).
Milling Measurements
Eight characteristics, namely empty and dead grains, total white rice, breakage in white rice, head rice percentage, husking grain ratio, milling, yellow and damaged grains, and chalky grain percentage, were studied in Table 4. For the percentage of empty and dead grains, Giza177, Giza182, and Sakha108 yielded the lowest values: 1.8, 2.73, and 2.73, respectively. On the other hand, Hybrid 28P67 (5.13), Hybrid 27P31 (4.83), and Egyptian Hybrid 1 (4.61) showed the highest values (Table 4). In total white rice percentage, Giza177, Sakha104, Sakha108, and Sakha101 were the highest values and belonged to Japonica types. Breakage in white rice percentage, Japonica type recorded the lowest value. In head rice percentage, the genotypes Hybrid 27P31, Giza182, and Hybrid 28P67 had the lowest values, and these belonged to the Indica type. The two Japonica varieties, Giza177 and Sakha108, yielded the highest values. Generally, Indica and Indica-Japonica have a higher husking grain ratio than the Japonica type (Table 4). In terms of milling percentage traits, all Japonica types yielded a higher height value compared to the Indica and Indica-Japonica types. However, Giza177, Sakha104, Sakha101, and Sakha108 achieved 84.5%, 82.10%, 81.99%, and 81.67%, respectively. In the yellow and damaged grains, the results revealed that Giza 177 was the lowest genotype, while Sakha 104 was the highest one. As for chalky grain%, three genotypes, Sakha104, Sakha101, and Sakha108, gave the highest value (Table 4).
Table 2.
ANOVA of 18 grain quality and 12 quantitative traits of eight rice genotypes under study.
Table 3.
Dimensional characteristics of paddy and milling grains for eight rice genotypes.
Grain Quality Coking Test
The cooking test results are presented in Table 5, revealing that the genotypes ranged from 0.06% with Sakha101 to 8.93% with Giza182 in crack percentage. Additionally, the hardness ratio ranged from 5.39 to 6.53, while in amylose percentage, the genotypes ranged from 17.17% for Giza177 to 23.89% for Hybrid 27P31. Generally, Japonica types had lower amylose percentages, gel stability ratios, and cooking times compared to Indica and Indica-Japonica types (Table 5).
Phenotypic and Genotypic Variability
The results in Table 6 showed that high estimates of genotypic (б2g) and phenotypic (б2ph) variances for all characters studied indicated an improved scope for genetic improvement, suggesting that the environment did not have a critical impact on the variability patterns of these traits (Table 6). The data indicated that the magnitude of genetic variance (б2g) was higher than the environmental variance (б2e) for all studied traits. Therefore, the estimates of genotypic and phenotypic coefficient of variability (GCV% and PCV%), broad-sense heritability (%), and genetic advance as a percentage of the mean for all study traits were calculated, as presented in Table 6. For the genotypic coefficient (GCV%), the results ranged between 3.39% and 86.85% for milling and yellow and damaged grain percentages, and the traits ranged between 41% and 90.97% (Table 6). The phenotypic coefficient of variability (PCV%) was higher than the corresponding genotypic coefficient of variability (GCV%) for all studied characteristics, indicating that the majority of PCV% was contributed more by the environmental effects. Relatively, the genetic coefficient of variability was higher for all studied characteristics, indicating that these characteristics might be more genotypically predominant, and it would be possible to achieve further improvements.
The genetic coefficient of variability refers to the additive and non-additive genetic variance, which played an important role in the inheritance of these characteristics. Heritability and genetic advance are presented in Table 6. All quantitative traits showed heritability estimates ranging from 29.88% for breakage in white rice to 98.45% for elongation when considered in the broad sense. However, heritability in a broad sense estimates were high for all the studied features, indicating that the genetic variance (additive and non-additive) played an influential role in the inheritance of all these traits.
Table 4.
Mean performance for milling processes traits for eight rice genotypes.
Table 5.
Grain quality test for eight rice genotypes.
Table 6.
Genetic parameters for agronomics traits, milling, and grain traits of eight rice genotypes under study.
Correlation Among Traits
Pearson’s correlation analysis for the eight quantitative traits with eight rice genotypes revealed different correlation extents (Fig. 4). Paddy grain length showed a significant positive correlation with paddy grain shape, milled grain length, milled grain shape, husking grain ratio, and amylose %. On the other hand, paddy grain length showed significant negative correlation with paddy grain width, milled grain width, head rice, and milling rice percentage.
The paddy grain width trait showed a significant positive correlation with paddy grain thickness, milled grain width, milled grain thickness, total white rice, head rice, milling percentage, and hardness ratio. On the other hand, significant negative correlations were found with paddy grain shape, milled grain length, milled grain shape, breakage in white rice%, husking grain ratio, amylose%, grain yield day-1, panicle length, and field grains panicle-1 (Fig. 2). In paddy grain thickness, a significant negative correlation was found with paddy grain shape, milled grain length, breakage in white rice%, husking grain ratio, and amylose%. While positively significant with milled grain width, milled grain thickness, total white rice%, head rice%, and milling (%). On the other hand, a positive significant correlation was found with paddy grain shape, milled grain length, milled grain shape, husking grain ratio, and amylose %. While it was significantly negative with milled grain width, head rice, and milling rice. The milled grain length trait was positively correlated with milled grain shape, breakage in white rice. While negatively correlated with milled grain width and head rice%. Milled grain width was significantly negative with milled grain shape, breakage in white rice%, husking grain ratio, amylose%, and positively significant with milled grain thickness, total white rice%, head rice%, and milling (%). As for milled grain thickness, positive significant correlation with total white rice%, head rice%, and milling (%), while negative significant correlation with empty and dead grains%, husking grain ratio, and amylose%. Total white rice% was positively significant with head and milling rice (%), while negatively significant with husking grain ratio, amylose%.
Breakage in white rice%, it was positively significant with head rice% and milling (%), while negatively significant with husking grain ratio, amylose%, and panicle weight. In head rice%, it was negative with the husking grain ratio and amylose. The husking grain ratio trait was positively significant with amylose%, and negatively significant with milling%. Also, milling% was significantly negative with amylose. The hardness ratio was negative with panicle length.
Principal Component Analysis
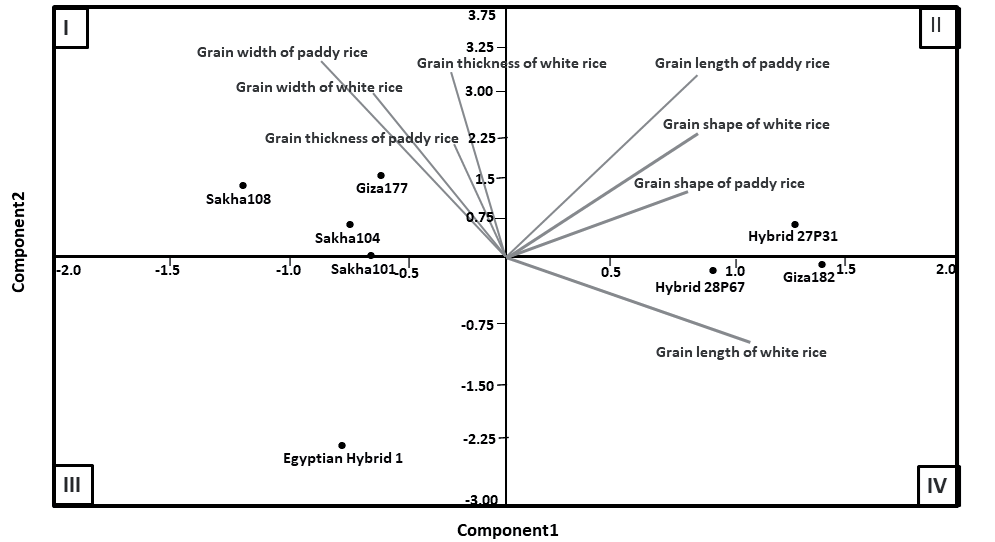
A total of five principal components with eigenvalues greater than one were found (Table 7 and Fig. 5). Although the last two showed eigenvalues less than one were considered non-significant and were therefore overlooked because they were unlikely to have any functional meaning. The five main components of variance % recorded as 1459.50, 98.64, 20.07, 8.22, and 34.86, respectively. The PC1, PC2, and PC3 principal components were responsible for 91.70%, 6.19%, and 1.26% of the total variation, respectively. Principal component analysis of the grain quality characteristics (grain length of paddy rice, grain width of paddy rice, grain thickness of paddy rice, grain shape of paddy rice, width, grain length of white rice, grain width of white rice, grain thickness of white rice and grain shape of white rice) identified three principal components (PC1–3) that accounted for 99.15% of the total variation (PC1 = 91.7%, PC2 = 60.19%, and PC3 = 1.26%). The important variables for PC1 were the grain length of paddy rice, the grain width of paddy rice, grain thickness of paddy rice.
Fig. 4.
Pearson’s correlation analysis for the eight quantitative traits with eight rice genotypes revealed different correlation extents.
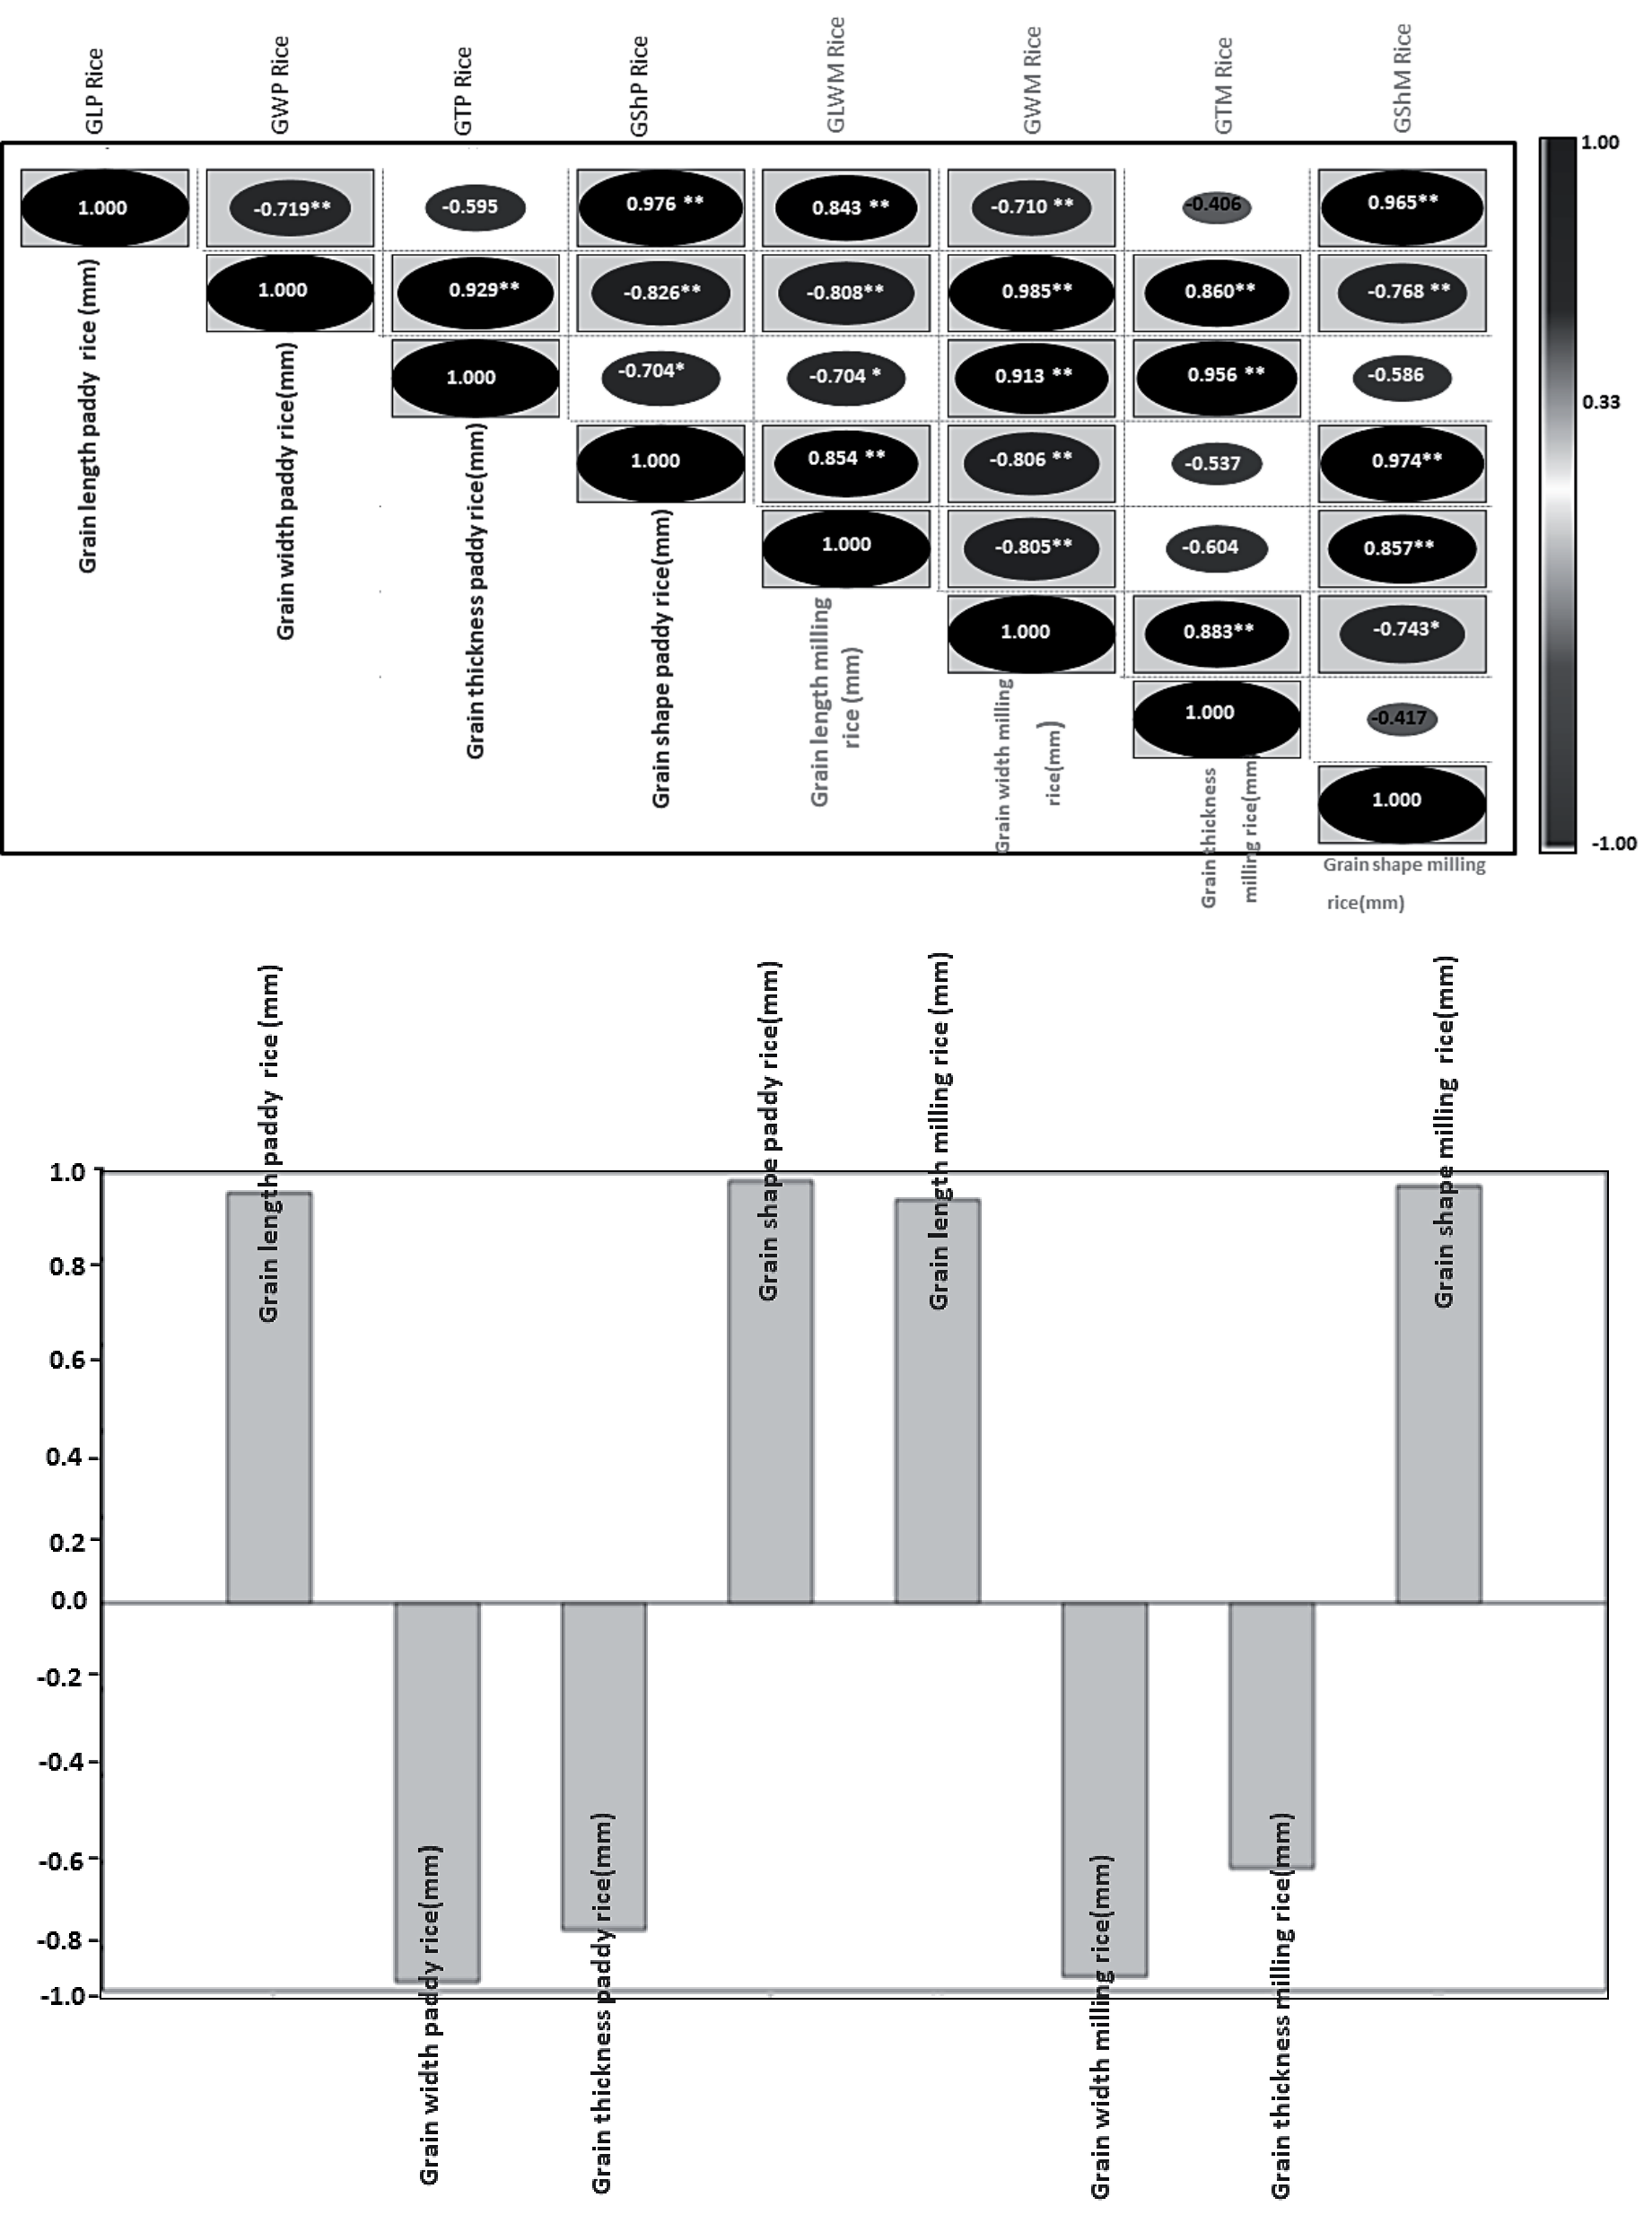
Table 7.
Eigenvalues, % variance, and cumulative % variance of eight morphological traits for principal components.
Cluster Analysis Based on Quantitative Characteristics
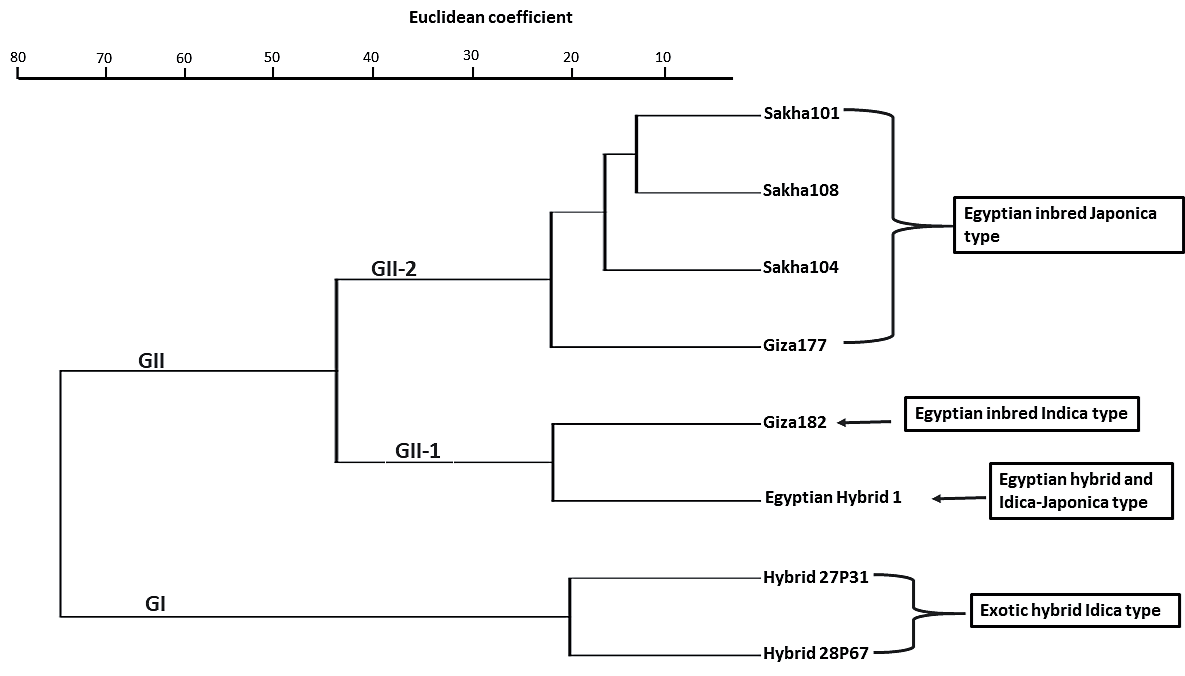
The mean performance and normality of all traits were checked, indicating that all traits had good approximations of normal distributions. The results indicated the presence of two groups (Fig. 6). The first group included the two hybrids (Hybrid 27P31 and Hybrid 28P67), which were imported from the same origin, long grains, Indica type, similar characteristics in plant height, duration, and most other characteristics. The second group included the remaining genotypes but was further divided into two subgroups. The first sub-group included the two genotypes Giza 182, which belongs to the Indian type, and the Egyptian hybrid 1, which belongs to the Indica-Japonica type, and were similar in tillers plant-1, panicles plant-1, and field grains panicle-1 (Fig. 6). The last sub-group included Sakha101, Sakha108, Sakha104, and Giza177, all from Japonica type. Otherwise, Sakha101 variety was used as a parent to produce Sakha108, so closely together. There is also a similarity in characteristics in grain length, grain width, grain shape, plant height (cm), tiller plants, field grains per panicle, husking grain ratio, and milling (%). On the other hand, Giza177 variety was in the branch alone because it is characterized by the shortest in duration, empty dead grains%, husking grain ratio, chalky grain%, and amylose%. While, gave the highest variety in total white rice%, Head rice%, and milling (%) compared with all the genotypes under study.
Discussion
Producing new varieties with high-quality characteristics is one of the main challenges due to global climate change [35-37]. Quality characteristics play an important role in the spread of varieties among farmers and consumers, which allows the variety to remain in their respective cultivated areas [19, 38]. In general, the different types of grain size, shape, and cooking qualities are very important, and it was the focus of this study. The current study was conducted to obtain genetic information for these traits and their correlations, in addition to determining the similarity between the varieties. In the present study, ANOVA for all traits revealed significant differences among all genotypes for all traits. These results indicated considerable variability among genotypes for various traits and substantial heterosis among hybrids. These results were in agreement with previous reports on similar traits [39-42]. In the previously mentioned studies, the authors highlighted the significant differences between these traits, which are attributed to the difference in the genetic makeup of the varieties. Also, the mean performance of the eight rice genotypes revealed that the indica type was higher compared to the Japonica type in grain shape of paddy and milling rice [5, 10]. In addition, the results showed that Japonica-type varieties had a lower percentage of amylose content, a desirable characteristic in cooking processes compared to Indian varieties and hybrid genotypes. Similar results were previously reported by Bian et al. [43]. Estimates of components of variance Genotypic (GCV) and phenotypic (PCV) coefficients of variability, broad sense heritability (h2b) and genetic advance for all studied traits: The estimates of components of variance, phenotypic (σ2Ph), genotypic (σ2g) and environmental (σ2e) variance; phenotypic (PCV) and genotypic (GCV) coefficients of variability and broad-sense heritability (h2b) for different traits are presented. The magnitude of genotypic variance was greater than that of environmental variance for all the studied traits [42]. However, high estimates of phenotypic (σ2ph) and genotypic (σ2g) variances were observed for all traits, indicating a greater scope for genetic improvement in these traits. These findings indicate that these specified traits are highly variable, whereas the environment had a moderate influence, revealing moderate estimates of broad-sense heritability. The results of the current study confirm the findings of Faysal et al. [44], Gaballah et al. [45], and Rezk et al. [13]. All characters studied in various years showed high estimates of heritability, indicating the presence of both additive and non-additive genetic variance in the inheritance of most traits, except for breakage in white rice percentage, which varied between 29.88% and 96.93% for panicle plant-1. These characteristics, however, are more resilient to shifting environments and cultural norms. Thus, it is possible to draw the conclusion that the selection processes it uses are effective in enhancing most of the attributes being evaluated. Some results were previously obtained by Esther et al. [46], Faysal et al. [44], and Rezk et al. [13]. The correlation among different traits helps to identify components with prior importance, allowing for the selection of improved genetic gain in a population. It also determines the strength of relationships among different traits to execute a reliable selection of rice genotypes [47]. Paddy grain length was correlated and significantly positive with paddy grain shape, milled grain length, milled grain shape, husking grain ratio, and amylose %. Negative significant correlations were found with paddy grain width, milled grain width, head rice, and milling rice percentage. This positive and significant correlation between these traits is due to their inheritance as one linkage group or were located in chromosome one [47-49]. The biplot PCA found remarkable findings regarding the relationship between rice grain quality traits. Quadrant-I grouped Japonica type (Giza177, Sakha108, Sakha104, and Sakha101), short grains, and higher value in width of paddy grain, width of white grain, thickness of paddy, and thickness of white grains. In addition, these genotypes originated from the same origin, and common parents contributed to the production of some of these varieties. Quadrant II included only Egyptian hybrid 1, which belonged to the Indica-Japonica type and had fewer grain characteristics compared to the other types. The genotypes in quadrants III and IV included all the Indica types, and most of them exhibited high grain length values in paddy and white rice. Similar results appeared with the principal component analysis in rice germplasm for grain quality traits [50-54]. Finally, the cluster analysis was consistent with the PCA analysis and was divided into two groups. However, parent, pedigree, grain dimensions, and agronomic traits played a major role in the dendrogram partitioning.
Conclusions
The quality characteristics of rice grains are crucial in modern rice breeding programs. This study evaluated eight rice genotypes, including Japonica, Indica, and Indica-Japonica hybrids, with a focus on their grain traits. Analysis of variance (ANOVA) showed significant differences among the genotypes, with Indica types exhibiting a more favorable grain shape compared to Japonica types. While Japonica varieties produced higher percentages of total white rice, milling, and head rice, they had lower amylose content. The phenotypic coefficient of variation was greater than the genotypic coefficient for all observed traits. Heritability estimates varied, ranging from 29.88% for white rice breakage to 98.45% for elongation. Additionally, positive correlations were found between paddy grain shape and several other traits, while negative correlations were noted between paddy grain width and other measurements. Principal component analysis revealed that eight grain traits accounted for 99.55% of the variance. Furthermore, cluster analysis grouped the genotypes into two main categories: one consisting of Indica hybrids and the other comprising Japonica and Indica-Japonica varieties.

