

Introduction
Rice belongs to the genus Oryza (Family: Poaceae) and is a semiaquatic annual grass. It has 22 species and originated about 130 million years ago in the supercontinent Gondwanaland. In 2000, the shotgun sequencing method was used to sequence the whole genome of rice. This method concluded that rice has 12 chromosomes (2n = 24) and about 40,000 genes [1, 2]. About 40,000 rice varieties have been reported and are being cultivated in more than a hundred countries, covering approximately 158 million hectares with a production of 503.17 million metric tons in 2021 [3]. According to USDA reports, an increase of 6.77 million tons, or 1.36%, in rice production around the globe was reported in 2021. About 90% of the global production of rice is harvested in Asia [4, 5]. In Pakistan, rice is the 2nd cereal crop after wheat. Due to good gain quality attributes like aroma and cooking quality, the Super Basmati rice variety is famous among consumers, farmers, traders, and exporters [6]. Under changing climate conditions, there is a high chance of an attack from different diseases on rice, which can affect its global production by approximately 10-29% [7, 8]. Among biotic stresses, bacterial blight (BB) is the major disease in rice caused by a bacterium named Xanthomonas oryzae pv. oryzae, a vascular pathogen [9], which results in yield loss that may vary from 20-80% depending upon the severity of conditions, and this loss is more visible in hybrid rice [10]. The symptoms of BB (leaf blight, or “Kresek”, or the acute wilting of young plants) can occur at different growth stages. Zoysia japonica, Panicum maximum, Cynodon dactylon, Leersia oryzoides, Cyperus difformis, and Cyperus rotundus, etc., act as hosts of Xoo other than Oryza [11]. Xanthomonas releases a type-III secretion system (T3SS) directly into plant nuclei and binds a particular DNA sequence called transcription activator-like effectors (TALEs) on either strand of host target genes [12].
To control this disease, the development of BB-resistant varieties is the most cost-effective strategy. To develop resilient rice varieties, the exploration of novel resistant germplasm and the use of excellent gene resources are critically important [13]. Currently, 45 resistance Xa genes that possess resistance to BB have been identified and are in use in the screening of diverse rice [14]. The earlier workers reported that the cloning and pyramiding of 11 R genes exhibited multiple mechanisms of resistance against Xoo isolates. Since the 1980s, a few R genes, such as Xa3, Xa4, Xa7, and Xa21, have been used widely in rice breeding programs [15]. However, the resistance provided by these genes has decreased under variable climate conditions, and it’s no longer tolerant of strong or evolved pathogenic variation [16]. The Avr genes induced resistance to Xoo and may be affected by the genetic makeup of rice or the insufficient dominance of R genes [17, 18]. However, the resistance gene Xa23, which is a new executor and derived from wild rice, exhibited wide dominance and broad-spectrum resistance against BB of rice at all stages of growth [19].
In Pakistan, all the cultivated varieties are susceptible to BLB disease, and farmers use different cultural practices to save the rice crop [20]. Besides management practices, the only sustainable solution is the development of resistant cultivars. Under the current scenario of climate change, the use of integrated tools like omics tools, breeding, and bioinformatics approaches may play an important role in the development of rice cultivars exhibiting resistance to the most virulent pathogens of BLB disease (Xoo) [21].
In recent years, different NILs and pyramids were released by the IRRI [22]. The Xa genes encode particular proteins and have diverse domains in their sequences that are useful for bacterial resistance. Because of both sequence and functional similarities, the majority of the gene’s regions are identical and possess the same types of domains. Researchers used various ways to explain Xa genes, but the full characterization of numerous genes is still incomplete. Earlier workers used wet lab techniques; now, there is a demand for dry lab, i.e., in-silico analysis, to fully explain the Xa genes using various computational tools to escalate the resistance ability of these genes up to 100% [23].
The objective of the study is the sequence and structural analysis of BLB resistance Xa genes to understand and increase its effect on rice plants and make useful information that will be supportive of future research. It includes motifs and domain analysis of conserved regions, secondary structure analysis, phylogenetic analysis, homology modeling, Ramachandran plot analysis, comparative analysis, and chromosome localization using different window-based and web-based tools. The project study will strengthen the knowledge and skills of researchers by having new resistant Xa genes. Incorporating new genes into the rice breeding program may be used to screen early generations against BLB disease.
Materials and Methods
Sequence Retrieval and Purification
The amino acid sequences of the rice resistance Xa gene were derived from the UniProtKB database (www.uniprot.org/help/uniprotkb/). The Rice Genome Annotation Project Database and Resource (http://rice. plantbiology.msu.edu) was used to browse sequences of Xa genes for conformation, genomic linkages, and annotation with other Xa genes. The BLAST Aligning Tool for Multiple Protein Sequences was used (https:// blast.ncbi.nlm.nih.gov/Blast.cgi?PAGE=Proteins) to remove redundant sequences based on their similarity to other amino acid sequences. The EMBOSS Transeq tool (https://www.ebi.ac.uk/Tools/st/emboss_transeq/) was used to translate nucleotide sequences to amino acid sequences.
Sequence Analysis
Motif and Domain Identification
Multiple Sequence Alignment (MSA) of Xa amino acid sequences was accomplished by CLUSTAL-X, which works by applying a progressive alignment method with a heuristic approach [24]. The MEME suite tool (http://memesuite.org/tools/meme) was utilized to find the corresponding motifs, which led to their location identification and graphical representation by the sequence logo [25]. The Hidden Markov Models for protein domain identification (SMART) were used to generate detailed results for the domains (http://smart. embl-heidelberg.de), and CDD was used for domain identification (https://www.ncbi.nlm.nih.gov/Structure/ cdd/wrpsb.cgi) and to purify protein sequences [26]. The Pfam database (https://pfam.xfam.org) was used to confirm the presence of the resultant domains in the sequences. InterProScan was applied to classify protein families based on (https://www.ebi.ac.uk/interpro/ search/sequence) motifs, conservancy, and domain presence in the sequences.
Phylogenetic Analysis
The MEGA-X (https://www.megasoftware.net/) was used to achieve the MSA of Xa gene amino acids. A phylogenetic tree was generated with the FastTree program using (http://www.microbesonline.org/ fasttree/#:~:text=FastTree%20infers%20approximate ly%2Dmaximum%2Dlikelihood, PhyML%203.0%20 or%20RAxML%207). Finally, the ITol (https://itol.embl. de/) was used for phylogenetic tree annotation, editing of tree data such as cluster names, text font, tree style, bootstrap value, evolutionary distance, merging clusters into clades, and relevant manipulations.
Primary Structure Analysis
The ProtParam tool https://web.expassy.org/ protparam was used to compute the physical and chemical parameters beneficial for the structural analysis of Xa proteins. The computed parameters comprise the number of amino acids, molecular weight formula, theoretical pI, number of negatively charged residues, number of positively charged residues, total number of atoms, extinction coefficient, aliphatic index, GRAVY, and instability index. Trans-membrane helices in Xa amino acid sequences were calculated by applying the TMHMM tool (http://www.cbs.dtu.dk/ services/TMHMM), which provides an approach to the hidden Markov model using membrane protein topology identification.
Secondary Structure Analysis
The SOPMA tool was used (https://npsa-prabi.ibcp. fr/cgi-bin/npsa-automate.pl?page=/NPSA/npsa_sopma. html) to predict secondary structures in the Xa proteins. The alpha helix, beta-turn, and random coil are among the key components of projected secondary structures. The discovery of signal peptides with locations of their cleavage sites in Xa amino acid sequences was determined using the SignalP tool that is based on (http://www.cbs.dtu.dk/services/SignalP) recurrent and concurrent architectures and convolutional neural networks with a random option of condition.
Comparative Modeling
Template Searching and Modeling
The residues of the Xa23, Xa23-Ni, Xa10, and Xa10-Ni proteins were searched in BLASTP against the protein database (http://www.rcsb.pdb.org) to determine suitable templates for homology modeling. These templates are designed to predict the 3D structures and functions of these Xa proteins. For the homology modeling of Xa proteins, suitable templates are searched in the I-TASSER (http://zhanglab.ccmb.med.umich. edu/I-TASSER) tool. The templates of Xa proteins were selected based on various parameters of BLASTP, such as the highest alignment score and percentage identity, maximum query coverage, and lowest E-value. All of the above steps predicted that 4he8.1.C, a hetero oligomer (monomer) whose C chain is a well-suited template for Xa23 and Xa23-Ni, for Xa10 and 7npu.1.E, a hetero-6-6-12-mer whose E chain is suitable for Xa10-Ni proteins. Comparative modeling is a technique where the sequence alignment of a target is done using a template whose structure existed in the PDB database, as reported earlier [27]. Models were constructed using the Swiss model (https://swissmodel.expasy.org/). The UCSF Chimera 1.14 was used to visualize these Xa models more extensively.
Model Quality Assessment
Different software, such as GNUPLOT Ramachandran plot analysis, was implemented for quality evaluation, solidity, and internal consistency of the XaXa23, Xa23-Ni, Xa10, and Xa10-Ni protein models. The phi and psi angles of proteins were used to check the stereochemical quality of the model, and the Swiss model tool was applied to determine the number of residues in favorable and unfavorable regions of the Ramachandran plot [28]. Overall quality-factor determination of Xa proteins was done using the ERRAT (https://servicesn.mbi.ucla.edu/ERRAT) tool. Statistics of unbounded interactions in the various kinds of atoms were calculated by ERRAT. The SAVES tool (http://nihserver.mbi.ucla.edu/SAVES) was applied to figure out the standard bond angles and bond lengths of Xa models. The MolProbity web server (http:// molprobity.biochem.duke.edu) was used to determine the quality validation of predicted 3D models. Templates from the I-TASSER tool were used to compute the root mean square deviation (RMSD) among the atoms of the predicted models. The Ramachandran plot was made to diagnose the updated dihedral angle. For the last validation and purification of the computed 3D structures of Xa models, the ProSA tool (https://prosa. services.came.sbg.ac.at/prosa.php) was used to find out the native protein folding energy of the computed. Besides, the comparison of native protein folding energy with the known structural models’ energy field was made.
Results
Motif and Domain Prediction Using Sequential Analysis
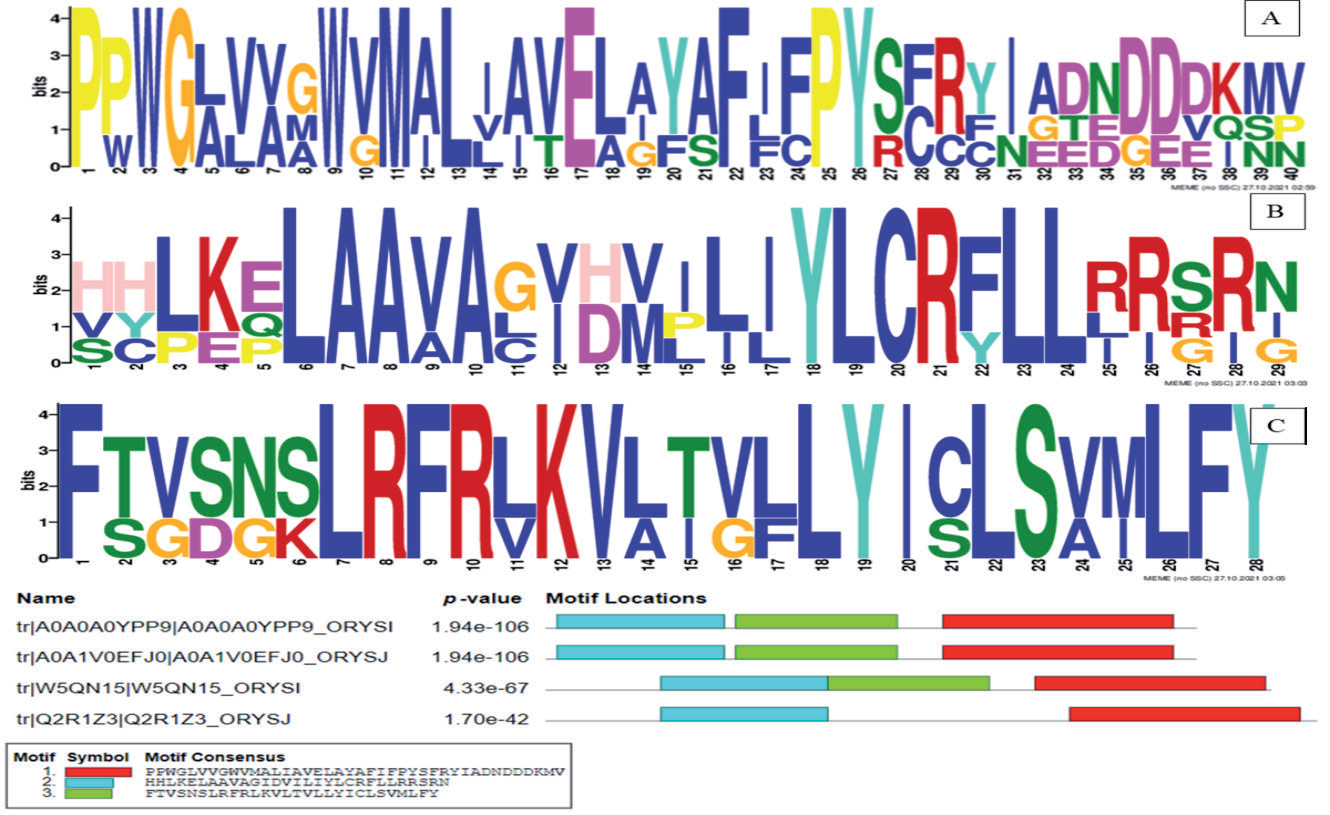
The previously published amino acid sequences of Xa23 (113aa), Xa23-Ni (113aa), Xa10 (126aa), and Xa10-Ni (134aa) proteins from Oryza sativa and Oryza indica, responsible for resistance against BLB disease in rice, were downloaded from the UniProt database (https://www.uniprot.org). The domain search using the SMART tool revealed that all four Xa proteins possess trans-membrane helices and low-complexity regions. Three unique motifs are computed from these Xa protein sequences through a tool called MEME suite. A 0-order model of the sequence is used as a background model to construct the motifs. Sequence logos are used to represent the conserved regions (PWGWMLEFPY) in Xa23 and Xa23-Ni, as shown in Fig. 1a). The conserved region LAAAYLCRLL was found in Xa10, as shown in Fig. 1b), whereas the conserved region FLRFRKVLYLSLFY was found in Xa10Ni Fig. 1c).
Primary Structure Analysis
The ProtParam tool was applied to calculate the primary structural parameters of Xa proteins, like molecular weight, which is 13081.97 for Xa23, 13081.97 for Xa23-Ni, 13870.88 for Xa10, and 14751.91 for XaXa10-Ni protein, respectively. The isoelectric point (pI) refers to the pH at which the net charge on a protein is zero and the surface of the protein is covered with charge. At pI, proteins behave as compact and stable [29]. The protein Xa23 and Xa23Ni have a pI of 9.34, whereas Xa10 Ni has a pI of 8.37, indicating its basic nature (pI>7.0), and Xa10 has a pI of 6.11, indicating its slightly acidic nature (pI ~ 7.0). The amount of space taken up by aliphatic side chains like alanine, valine, isoleucine, and leucine in a protein is known as the aliphatic index (AI) [30]. The aliphatic index of rice XaXa23 is 141.42, Xa23Ni is 141.42, Xa10 protein is 133.17, and Xa10-Ni is 136.94. The instability index provides an approximation of the stability of the protein in an in-vitro environment. It was calculated that the instability index of these proteins is about 45.89, 45.89, 35.59, and 42.09, respectively. The GRAVY index of Xa23 is 1.011; for Xa23-Ni, it is 1.011; for Xa10, it is 1.157; and for Xa10 -Ni, it is 1.128.
Secondary Structure
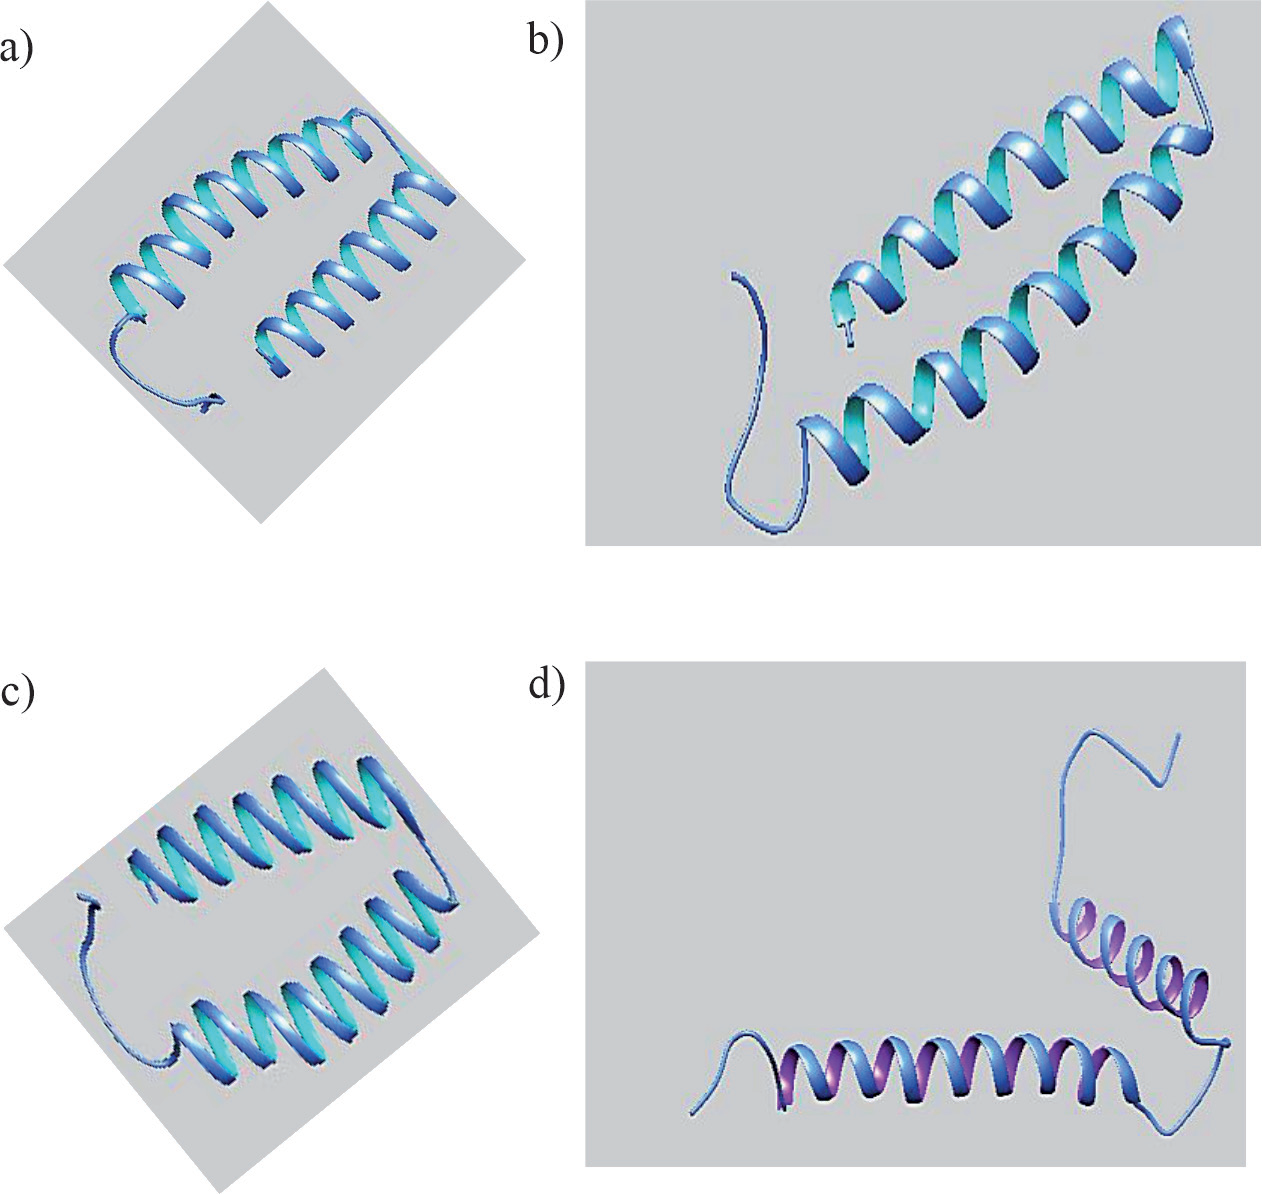
In order to find the structural features of Xa proteins, their secondary structures were predicted using the SOPMA tool. A high proportion of random coils and alpha helices were found in the protein structures. The α-helices are a core component of formed transmembrane bundles and represent 30% of the structure of the average globular protein [31]. The TMHMM tool predicted the presence of four trans-membrane helices of 63.67 amino acids in Xa23, three trans-membrane helices of 63.67 amino acids in Xa23-Ni, four transmembrane helices of 79.60 amino acids in Xa10, and four trans-membrane helices of 85.60 amino acids in Xa10-Ni.
Comparative Analysis of Xa Genes
The phylogenies revealed the relationship between Xa proteins. The results showed that Xa23, Xa23-Ni, Xa10, and Xa10-Ni fall in the same clade because they are more closely related to each other as they have sequence similarity.
Comparative Modeling
Comparative modeling, also known as homology modeling, is considered the most precise and accurate technique for predicting the 3-D structure of a protein sequence. The main purpose of comparative modeling is to build 3-D models for proteins whose structures are not known. It predicts models on the basis of sequence similarity to proteins of known structure. The model prediction process consists of fold assignment, target-template alignment, model building, and model evaluation [32].
It gives us the idea that if there is sequence similarity between two sequences, they also possess structural similarity. The parameter for selecting the best template for a model that has maximum query coverage is defined. 4he8.1.C, 6i0d.2.L, 6ziy.1.K, 7npu.1.E, and 7np7.1D were predicted as the top templates of the Swiss model. 4he8.1.C has the highest similarity with Xa23, aXa23-Ni, Xa10, and 7npu.1E, with Xa10-Ni as shown in (Fig. 2) [33]. The well-suited templates for Xa protein were 4he8.1.C. Pairwise sequence alignment of these templates was done with these Xa proteins through Mega X, and for visualization, the Sea-viewer tool (http://doua.prabi.fr/software/seaview) was utilized. On the basis of the alignment of the template and target, the Swiss model created 10 rough models of query protein sequences using 4he8.1.C (for Xa23, Xa23Ni, and Xa10) and 7npu.1.E for Xa10-Ni as templates (Table 1). Out of these 10 models, the visualization of secondary structures of selected templates and predicted models was done using Chimera software, and a comparison of these results showed that there were some conserved regions between templates and predicted models (Fig. 3) (Table 2).
Model Assessment and Validation
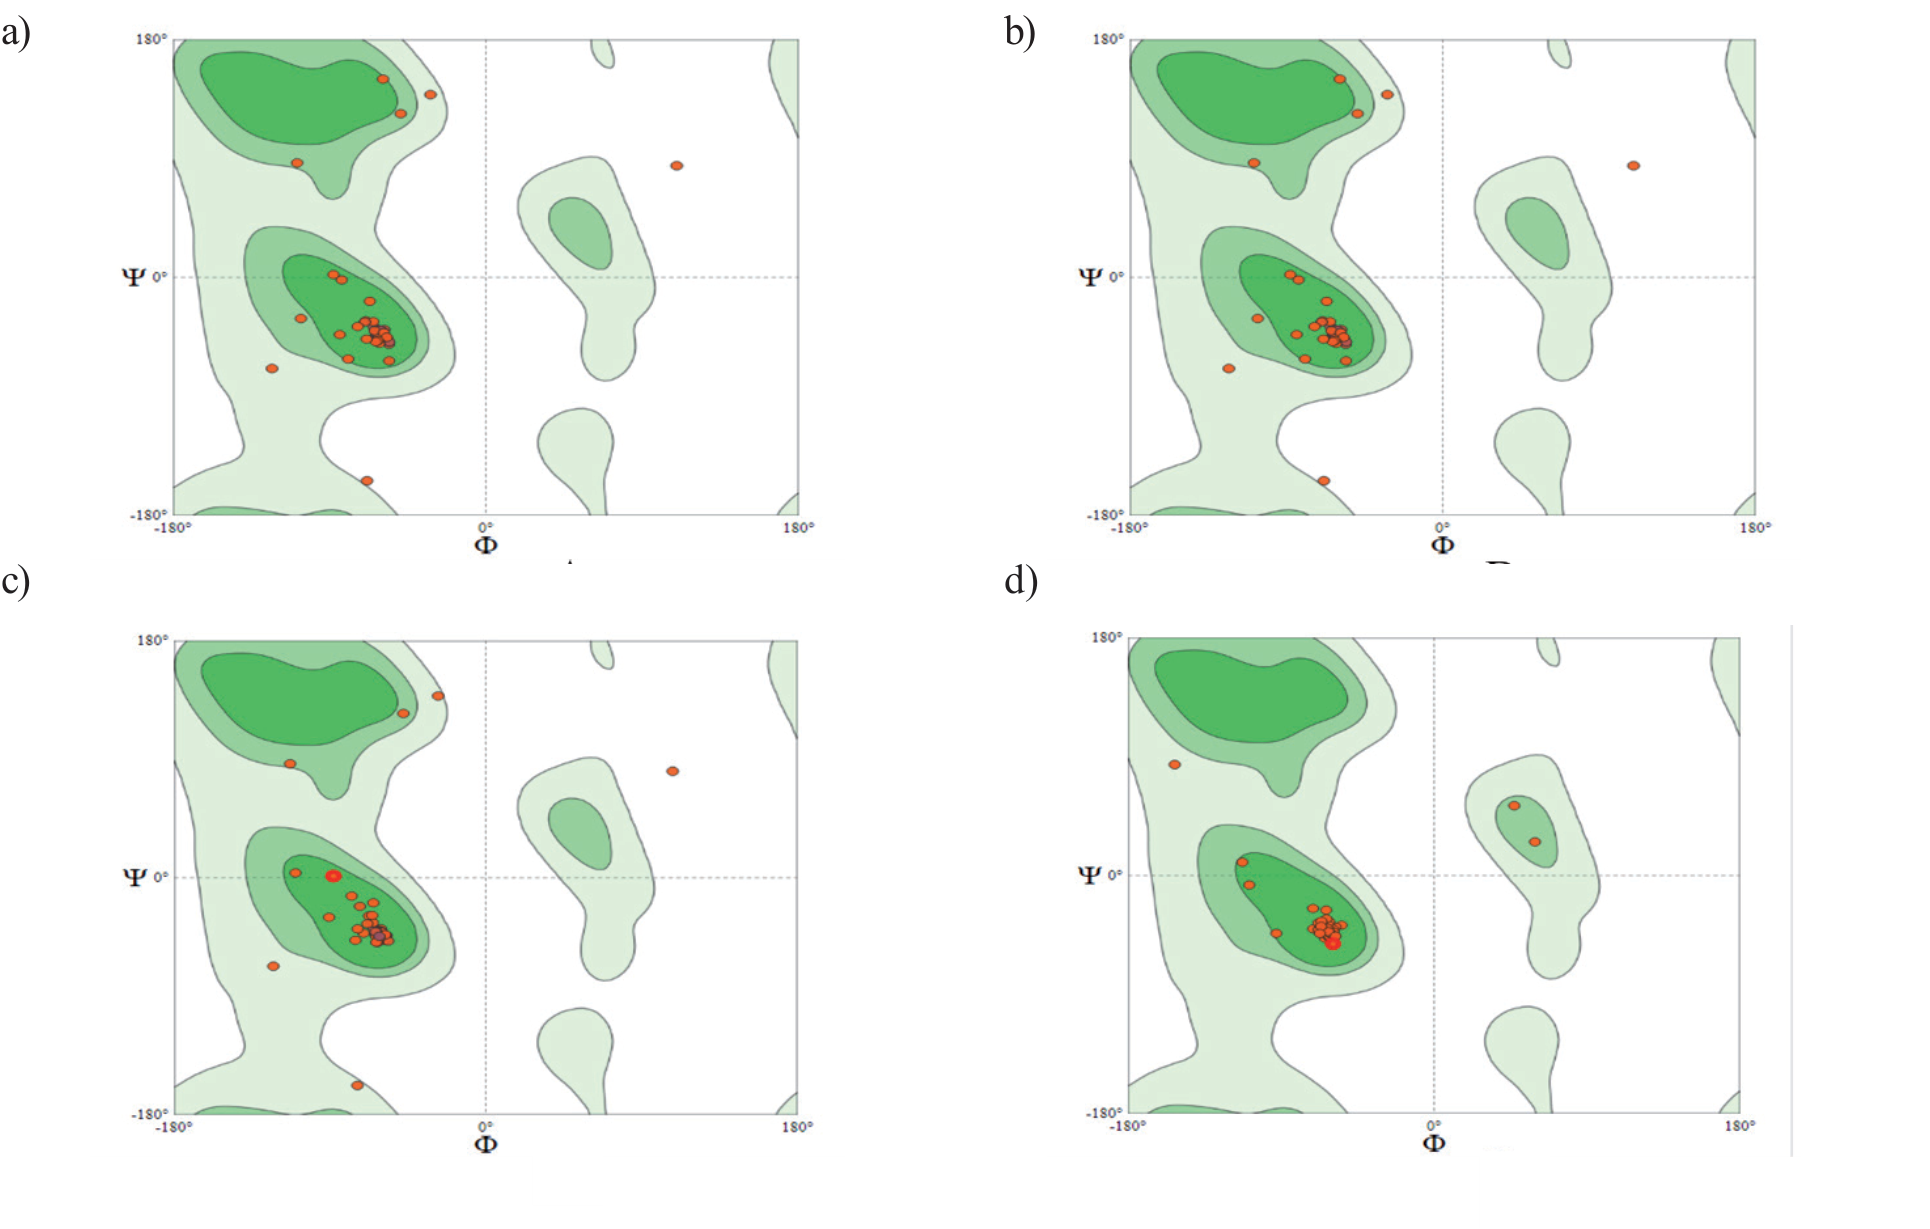
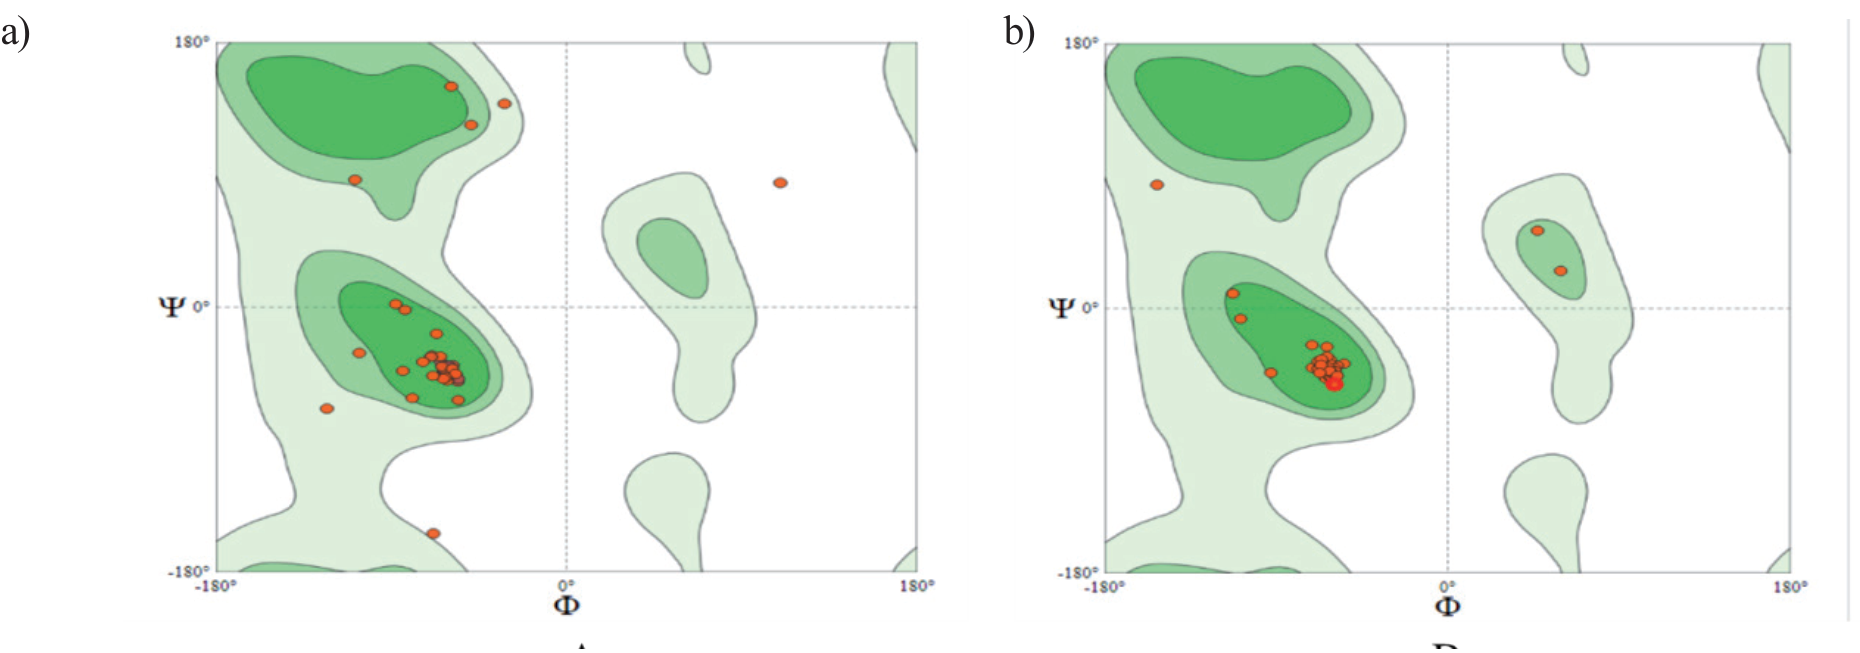
GNU plot is used for graphical visualization of the alignment of the target and template to study the conservancy of the secondary structure of protein calculated by the Swiss model tool. The ExPasy online server (https://swissmodel.expasy.org/interactive) is utilized to visualize amino acids that fall in the available region using the Ramachandran plot. The Ramachandran plot gives us the reliable value of the amino acid in the model, having Psi clashes and rotatable angles, or dihedral angles. According to Ramachandran plot analysis of the models, it revealed that 88.52% of residues of XA23, 88.52% of residues of Xa23Ni, 91.94% of residues of Xa10, and 98.00% of residues of Xa10 Ni fall in the favored regions, while 6.56% of residues of Xa23, 6.56% of residues of Xa23Ni, and 4.84% of residues of Xa10 fall in Ramachandran outliers (Fig. 4 and Fig. 5). The VERIFY-3D (https://servicesn. mbi.ucla.edu/Verify3D) tool was used to check the model compatibility with its own amino acid according to the sequence, and the score value of over 80% residue indicates the model is reliable [34].
Chromosomal Localization
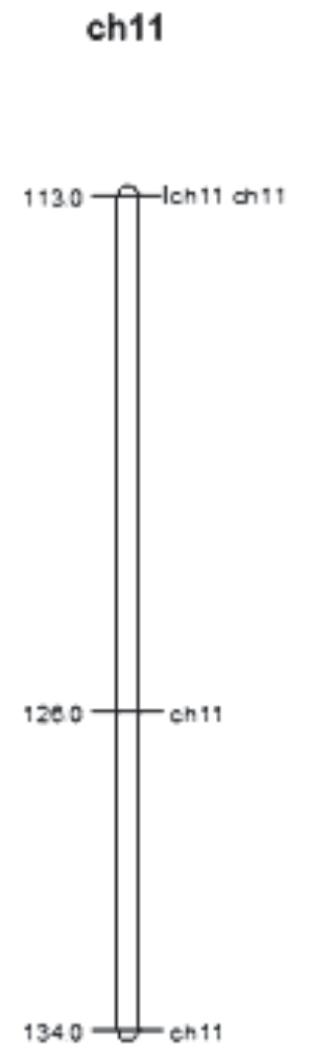
The rice genome consists of 12 chromosomes [35]. Chromosomal mapping of these proteins was constructed using the MapChart tool (https://www.wur.nl/en/show/ mapchart.htm). Fifteen genes, including Xa3/26, Xa4, Xa10, Xa21, Xa22, Xa23, Xa26, Xa30, Xa32, Xa35, Xa36, Xa39, Xa40, Xa43, and Xa44, have been reported to be located on chromosome 11. Results revealed that all four genes were located on chromosome 11, shown in Fig. 6. The length of the Japonica cultivar of rice is estimated to be 118.6 cm. The long arm of rice chromosome 11 (11L) comprises almost twice (132 genes) the number of R-like genes compared to the short arm (68 genes) [36]. It also possesses 17 downstream defense response genes, including glucanases, chitinases, and thaumatin-like proteins. The amino acid-conserved regions of Xa23 contribute 50% of the identity to the known executor R protein of Xa10. In addition, trans-membrane helices of Xa23 were also present in Xa10. However, the activation of transcription in Xa23 observed by AvrXa23 was distinct from Xa10 [37].
Fig. 3.
3D view of secondary structures of the proteins selected as templates for comparison-based homology modeling: a) Image of 4he8.1 (Chain-C), and b) Image of 7npu.1 (Chain-E).
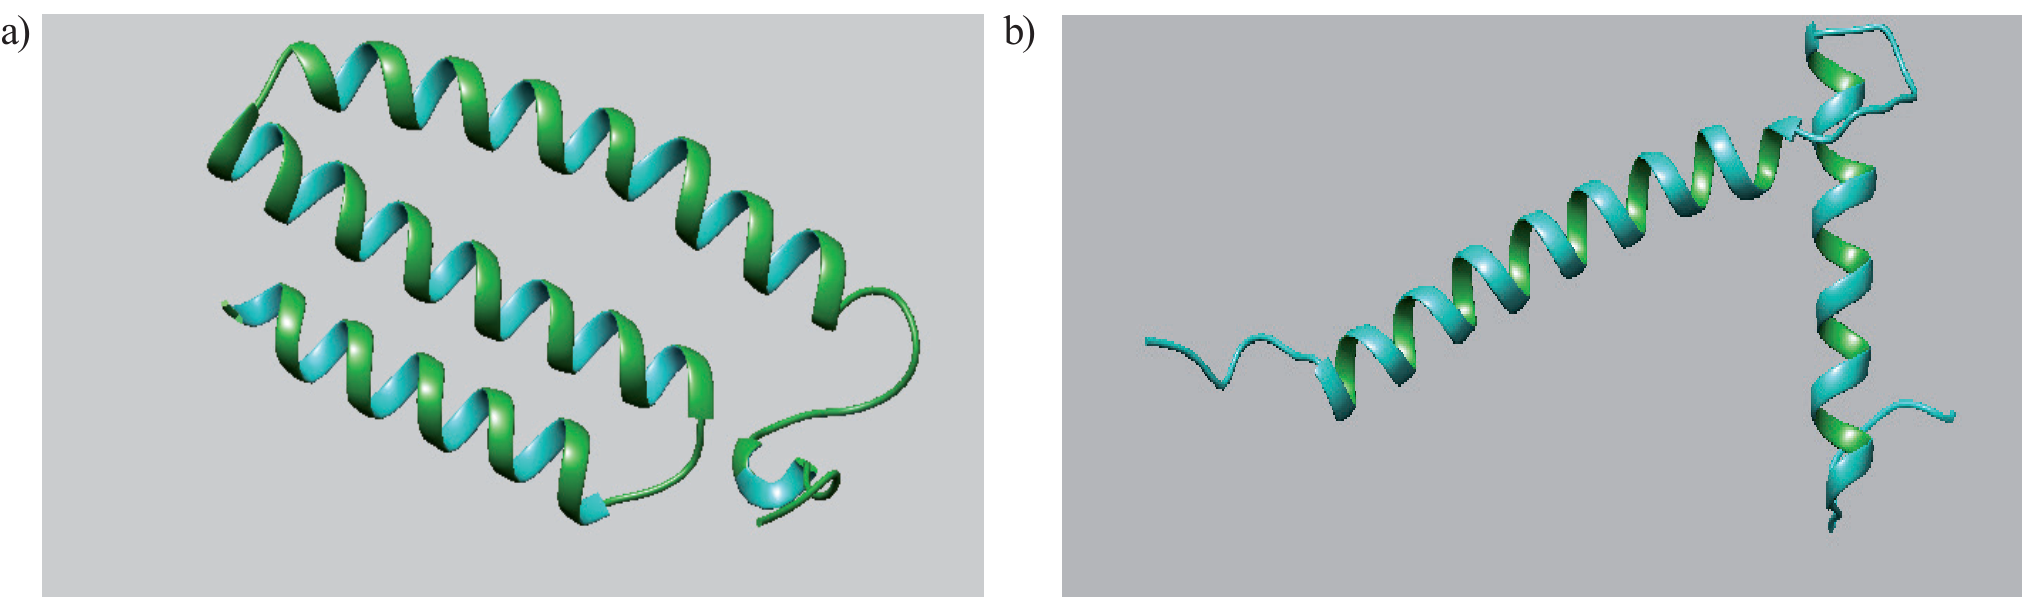
Table 2.
Selected template for modeling from Swiss model against PDB database.
Discussion
The cause of bacterial leaf blight (BLB), Xanthomonas oryzae pv. oryzae (Xoo), is rapidly spreading throughout the world and causing significant losses in paddy crops. Furthermore, in this region, due to the monsoon climate, chemical control of this disease is unsuccessful. Since BLB reduces rice quality, it has been suggested that the best way to prevent it is to cultivate resistant rice types. The most efficient and economical way to control the disease is to produce and breed resistant types that possess the resistance gene. The genomic sequence that is contained within this QTL was systematically analyzed in this work. The genes were identified and categorized into resistance and defense-related genes. These genes were then utilized to forecast how these genes will interact and contribute to rice resistance to BLB. The discovery of important genes may be used to improve rice through transformation and marker creation. The rice genome database and every accessible online bioinformatic tool will be used for all the aforementioned analyses. Our research team will use the information from this study and numerous other comparable QTL analyses to create an integrated map that scientists and breeders may use.
Fig. 4.
The Ramachandran plot of predicted 3D structures of proteins: In (A) the Ramachandran plot of Xa23 protein; (B) the Ramachandran plot of Xa23Ni; (C) the Ramachandran plot of Xa10; (D) the Ramachandran plot of Xa10 Ni.
During motifs and domain prediction, Xa23 (113aa), Xa23-Ni (113aa), Xa10 (126aa), and Xa10-Ni (134aa) proteins possessed trans-membrane helices that performed a diversity of roles such as enzyme catalysis, transport across membranes, transducing signals as receptors of hormones and growth factors, and transfer of energy in ATP synthesis [38]. Particular sequence motifs generally facilitate a common function, like protein binding or targeting a specific subcellular position, in a diversity of proteins [39]. The conservancy of residues showed that Xa23, Xa23-Ni, Xa10, and Xa10-Ni have a resemblance to each other and phylogenetically make their own separate cluster. R-genes are a crucial part of a plant’s defense mechanism against pathogen invasion. Resistance genes have been categorized into eight types based on the presence of domains, including the well-known NBS-LRR, protein kinase, and other domain configurations that are present in these R genes.
During primary structure analysis, the amount of space taken up by aliphatic side chains is considered a positive factor for the increase in thermal stability of globular proteins. The aliphatic index indicated that these proteins may be stable for a wide range of temperatures [40]. A protein possessing an instability index smaller than 40 is considered stable, while a value greater than 40 is considered potentially unstable [41]. These were on the positive side and showed their slightly hydrophobic nature (GRAVY>0), indicating their low affinity for water. The results of predicted secondary structures showed the proportion of extended strands (β folds), α helices, β turns, and random coils accounted for Xa23; 23.01, 56.64, 1.77, and 18.58%, for Xa23-Ni; 23.01, 56.64, 1.77, and 18.58%, for Xa10; 18.25, 54.76, 3.96, and 23.02%, for Xa10-Ni; 18.66, 48.51, 2.99, and 29.85% of the secondary structure, respectively. The comparative analysis showed that these Xa genes are executor genes and work as promoter traps. They have a very close relationship with Xa27 [29]. Forty antimicrobial genes have been found, the majority of which have been cloned and thoroughly mapped. Yasmin et al. (2017) report that a Teqing x Lemont hybrid produced a QTL, qBBR11-1, that showed resistance to BLB illness caused by three different forms of Xoo: C2, C4, and C510 for two years in a row.
During comparative modeling, it was noted that the models having maximum query coverage and the highest percent identity were considered thermodynamically stable and selected for the next validation. The information provided by Ramachandran is that the model has the same percentage of allowed and disallowed amino acids as the template, so it was concluded that the model and template were mostly conserved, and similarly, VERIFY-3D indicated that the model is reliable. In chromosomal localization, the fast-evolving disease resistance and defense response genes found on rice chromosome 11 were created by tandem duplication, followed by divergence under the selection pressure of rice pathogens.
Conclusions
These genes belong to the Xa family of rice and act as a code for executor proteins that have a strong hypersensitive response and possess complete resistance against pathogens, especially Xoo. Analysis showed that these genes hold similarities and have low-complexity regions and trans-membrane helices. Because the resistance and defense response genes, enriched on 11 chromosomes relative to the whole genome, also occur in clusters, they offer a favored target for the isolation of their allelic variations and the development of long-lasting disease resistance in rice. On chromosome 11, there were 4,286 identified genes, 3,148 of which may be classified as non-transposable elements. A similar percentage of genes on the chromosome could be assigned a putative function or annotated as encoding an expressed protein, leaving a similar percentage annotated as encoding a hypothetical protein. Based on their encoded protein products, disease resistance genes (R-like genes) that confer resistance to viral, bacterial, fungal, and nematode pathogens have been divided into five groups. For instance, a genome-wide study identified typical protein domains like LRR, CC, NBS, etc., in the R-like genes of Arabidopsis. A previous report on the analysis of R-like genes in the entire rice genome revealed that most of the R-like genes (24.98%) are present on chromosome 11. The domains’ identification and characterization will lead us to a specific domain that involves resistance biologically. The Xoo races are changing continuously, and we can use these identified specific regions to predict new genes and pairing arrangements of genes for the upcoming races.
Authors’ Contributions
Conceptualization, M.S.; R.I.; methodology, R.I.; M.Z.M.; software, K.A.; K.I.; formal analysis, R.A.; investigation, M.S.; resources, M.S., and R.I.; data curation, R.I.; writing – original draft preparation, M.Z.M., S.A., K.A.A., Y.M.H., I.K., U.T., and A-R.Z.G.; writing – review and editing, M.S., Q.Z., K.A., M.H.S., and M.S.H.; supervision, M.S.; project administration, S.A., K.A.A., Y.M.H., and M.S.; funding acquisition, M.H.S., A-R.Z.G., and M.S.H. All authors read and approved the final manuscript.

