

Introduction
Across centuries, logistics activities have played a pivotal role in fostering human prosperity and driving economic development worldwide. Serving as a cornerstone of economic progress, logistics has emerged as a key catalyst propelling rapid growth [1]. Moreover, investments in the logistics sector have been instrumental in enhancing economic efficiency, resource utilization, and overall productivity [2]. Notably, economic factors exert the most significant influence on carbon emissions within the logistics industry [3]. While heightened logistics activities stimulate economic growth, they can also exert adverse effects on environmental and social dimensions [4]. In essence, the development of regional logistics represents a double-edged sword: while it fosters regional advancement and coordinated development, it also poses challenges to sustainable development.
The ecological impact of transportation and production systems holds comparable significance to the attainment of economic objectives [5]. Notably, logistics stands out as a primary contributor to environmental pollution. Consequently, the concept and adoption of green logistics have garnered increasing attention, particularly amid the transition to a circular economy in the current economic landscape. China, in particular, has actively engaged in various initiatives to combat global climate change and has committed to reducing carbon emissions. Aligned with the imperatives of the low-carbon economy era, green logistics serves as a crucial tool for addressing significant societal challenges such as energy consumption and global warming, thereby advancing sustainable development [6]. Thus, regional green logistics endeavors to simultaneously pursue both economic and environmental objectives, thereby playing a pivotal role in fostering regional high-quality and sustainable development.
The discourse surrounding low-carbon, sustainable logistics, green supply chains, and related concepts has emerged as a focal point in regional studies. At the governance level, the State Council has issued several directives, including the “Medium and Long-term Plan for the Development of the Logistics Industry (2015–2020)” and instructions on actively promoting the “Internet+” action. These initiatives underscore the imperative of vigorously developing green logistics in China, aimed at reducing energy consumption and emissions and alleviating traffic congestion while delineating the overarching developmental trajectory of the logistics industry [7]. From a societal standpoint, Mesjasz-Lech [5] emphasizes that green logistics encompasses activities directly or indirectly linked to environmental preservation. Direct activities encompass initiatives such as promoting renewable energy, pollution reduction, and noise prevention, while indirect efforts involve tackling congestion and modernizing urban infrastructure. Analyzing the growth and environmental implications of green logistics, Li et al. [2] shed light on its multifaceted impacts on carbon emissions across different regions, considering factors such as economic growth and environmental quality. Additionally, Chen et al. [8] underscore the pivotal role of green logistics transformation in achieving high-quality development within the logistics industry, alongside industrial transformation and upgrading endeavors.
While numerous studies have explored various aspects of green logistics, including its impacts on energy, the environment, and the economy [9-11], a notable research gap exists in the investigation of path analysis promoting regional green logistics. This specific area has received scant attention in existing literature, highlighting the need for further exploration. Therefore, the primary objective of this study is to address this gap by examining the potential influences affecting the development of regional green logistics. Additionally, we aim to elucidate the relationship between factors established by the Technology-Organization-Environment (TOE) framework and the developmental level of regional green logistics. Ultimately, our study seeks to delineate the pathways toward achieving a high developmental level of regional green logistics.
Hence, there is a pressing need for more systematic research to analyze and address the notable research gap that currently persists. While traditional regression analysis methods are adept at identifying the roles played by various factors in the relationship between regional logistics and the economy, they often treat each factor in isolation, potentially overlooking the interplay among key variables. Within the realm of green logistics research, Li et al. [2] elucidate the impacts of regional green logistics performance on carbon emissions across different areas. Furthermore, regional development contexts vary widely [1]. Therefore, to further explore the relationship between potential conditions and the developmental level of regional green logistics, this study employs the Fuzzy-Set Qualitative Comparative Analysis (fsQCA) configuration method. Unlike conventional research approaches, this study adopts a configurational analysis perspective to elucidate the myriad factors and their combinations that influence regional green logistics. Unlike traditional regression analysis techniques, configuration methods can classify and assess configurations based on the simultaneous consideration of multiple interdependent factors [1]. In essence, configuration methods have the capability to examine multiple potential factors contributing to substantial disparities in their collective impact on the outcome. These factors may either complement or substitute for one another, resulting in significant variations in their combined influence on regional green logistics.
In this study, we construct a systematic analytical framework to comprehensively evaluate the impacts of green logistics development, considering multiple factors based on the TOE framework, including Innovation Progress (IP), Information Advancement (IA), Government Support (GS), Economic Environment (EE1), Social Environment (SE), and Ecological Environment (EE2). Furthermore, the fsQCA method is employed, which integrates quantitative and qualitative approaches to elucidate the necessity and sufficiency of causal relationships among various variables. To this end, we select 30 Chinese provinces and cities (excluding Xi Zang, Hong Kong, Macao, and Taiwan) as research samples and utilize the fsQCA method to investigate the influencing mechanisms of joint effects on the development of regional green logistics. The objective is to discern pathways for enhancing the developmental level of green logistics within diverse areas. This framework will facilitate the assessment of the potential for regional green logistics development across different regions, employing both quantitative and qualitative methodologies.
According to the above analysis, the proposed study tries to answer the following research questions:
RQ1. Which factors contribute to the developmental level of regional green logistics?
RQ2. How can those conditions promote the regional green logistics progress?
RQ3. Are there any differences or disparities between each region? What are the reasons for them?
Our study contributes to enhancing the existing literature by introducing a systematic and comprehensive theoretical framework grounded in the TOE framework. This framework enables the integrated exploration of the relationship between multiple factors and regional logistics sustainability from various perspectives. Furthermore, we employ the fsQCA method, characterized by configuration thinking as opposed to traditional empirical methods, to analyze the synergistic effects in regional green logistics. This method facilitates a shift from uni-dimensional to holistic perspectives in related research, allowing for the identification of multiple solutions to adequately explain the same outcome and the analysis of configurations of various condition variables leading to specific results. Ultimately, our paper aims to provide scientifically informed recommendations based on the analysis results to advance China’s transition to a high level of regional green logistics. Additionally, we seek to delve deeper into the mechanisms underlying the high developmental level of regional green logistics, offering valuable insights for regions with underdeveloped green logistics and for developing countries aiming for low-carbon and high-quality development.
The paper is structured as follows: After the introduction, Section 2 delves into a comprehensive literature review of regional green logistics, establishing the research framework based on previous studies and related theories. In Section 3, we provide essential details encompassing variables, data collection, and methodology. The empirical findings and their discussion are presented in Section 4. Finally, Section 5 encapsulates the study’s conclusions and provides policy implications.
Literature Review and Research Framework
Regional Green Logistics
The notion of green logistics was initially introduced by Western scholars towards the end of the last century. However, academia has yet to establish a definitive definition for this concept. Wu and Dunn [12] characterized green logistics as a bi-directional logistics system encompassing both forward and reverse flows. They emphasized its distinction from traditional logistics systems, which primarily focus on cost minimization and profit maximization without considering environmental responsibility. Ping [13] expanded on the concept of green logistics, incorporating various green principles such as green production, green consumption, and green marketing. They argued that these principles collectively contribute to environmental sustainability and stimulate economic development through modern logistics practices. Additionally, Zaman and Shamsuddin [9] proposed that green logistics constitutes a critical sub-component of green supply chain management. This prominence has surged over the past decade, driven by factors such as globalization, market competition, evolving consumer preferences, and the exploration of new markets.
Irrespective of the varied interpretations, the overarching goal of green logistics remains consistent: to foster sustainability by mitigating external impacts and achieving a more balanced alignment of environmental, economic, and social objectives [14]. In essence, green logistics is rooted in the fundamental principles of sustainability [4]. Thus, it can be inferred that green logistics serves as a catalyst for achieving all facets of sustainable development. Specifically, its objective is to holistically manage all logistics and transportation activities with the primary aim of striking an optimal balance between minimizing adverse economic and environmental impacts, thereby mitigating conflicts between cost and social objectives.
In recent years, there has been a surge in research attention towards green logistics, with a predominant focus on the micro level. Specifically, studies have delved into various aspects such as governmental policies, corporate social responsibility initiatives, and public ecological awareness [4-6, 14, 15]. Driven by external pressures and the desire to enhance their market positioning, an increasing number of organizations are transitioning from conventional logistics practices to sustainable ones. Roy and Mohanty [4] contend that the adoption of green logistics not only facilitates the attainment of sustainable objectives and minimizes the adverse impacts of waste and hazardous materials but also serves to uphold corporate reputations, ethical standards, and competitiveness. By voluntarily integrating sustainable practices into their logistics operations, organizations demonstrate their commitment to stakeholders and collaborate with suppliers and customers.
Moreover, Shoaib et al. [15] identified 21 key enablers for sustainable green logistics and prioritized critical factors for implementing sustainable practices based on the triple bottom line (i.e., social, environmental, and economic aspects). Their findings revealed that customer demands, external management support, top management backing within organizations, government regulations, and public and consumer pressure were among the most influential enablers of sustainable green logistics. Additionally, Tsai and Wang [6] developed a human resources performance evaluation system for low-carbon logistics enterprises to assess the low-carbon competencies, job performance, and work attitudes of their staff members.
In addition, certain studies have taken a macroscopic approach to green logistics. For instance, Zaman and Shamsuddin [9] investigated the impact of green logistics performance indices and their dynamic relationships on a national scale, encompassing factors such as energy, environment, and economic health across 27 European countries from 2007 to 2014. Their findings underscored the significant correlation between logistics indices and national economic indicators, advocating for the adoption of green supply chain management practices at the regional level. Similarly, Li et al. [2] conducted an analysis of the growth and environmental effects of green logistics performance in countries participating in the One Belt and Road Initiative (OBRI) from 2007 to 2019. Their study revealed that enhanced green logistics performance contributed to economic growth across various countries while also improving environmental quality in specific regions. Furthermore, Chen et al. [8] examined green logistics from both macro and micro perspectives. Their findings elucidated the challenges and opportunities present in different regions of China, shedding light on the complexities inherent in regional green logistics development.
These studies provide valuable insights into regional green logistics through diverse strategies and measures; they examine further the development of regional green logistics. However, those current works seldom explore how to promote the development of green logistics in diverse regions and to achieve the specific path to attain a high development level of green logistics in different regions. The TOE theoretical framework is to be included in the present work, and all potential paths have been employed to investigate the developmental level of regional green logistics.
Construction of the Framework
The TOE theoretical framework, initially proposed by Tornatzky et al. [16], delineates the factors influencing the adoption of technological innovations by enterprises or organizations across three dimensions: technology, organization, and environment. Over recent years, this framework has found applicability beyond the realm of business and corporate contexts, extending into various fields [17-19]. For instance, Chembessi et al. [17] utilized the TOE framework to scrutinize the shifts in circular economy implementation and the factors driving these changes in Quebec, Canada. Similarly, Meng et al. [18] explored the role of industrial parks in fostering industrial and technological agglomeration, employing the TOE framework as a foundational basis for their investigation. Additionally, Chen and Hu [19] leveraged Fuzzy-Set Qualitative Comparative Analysis to examine data sourced from 25 provincial governments, focusing on government data openness through the lens of the TOE theory.
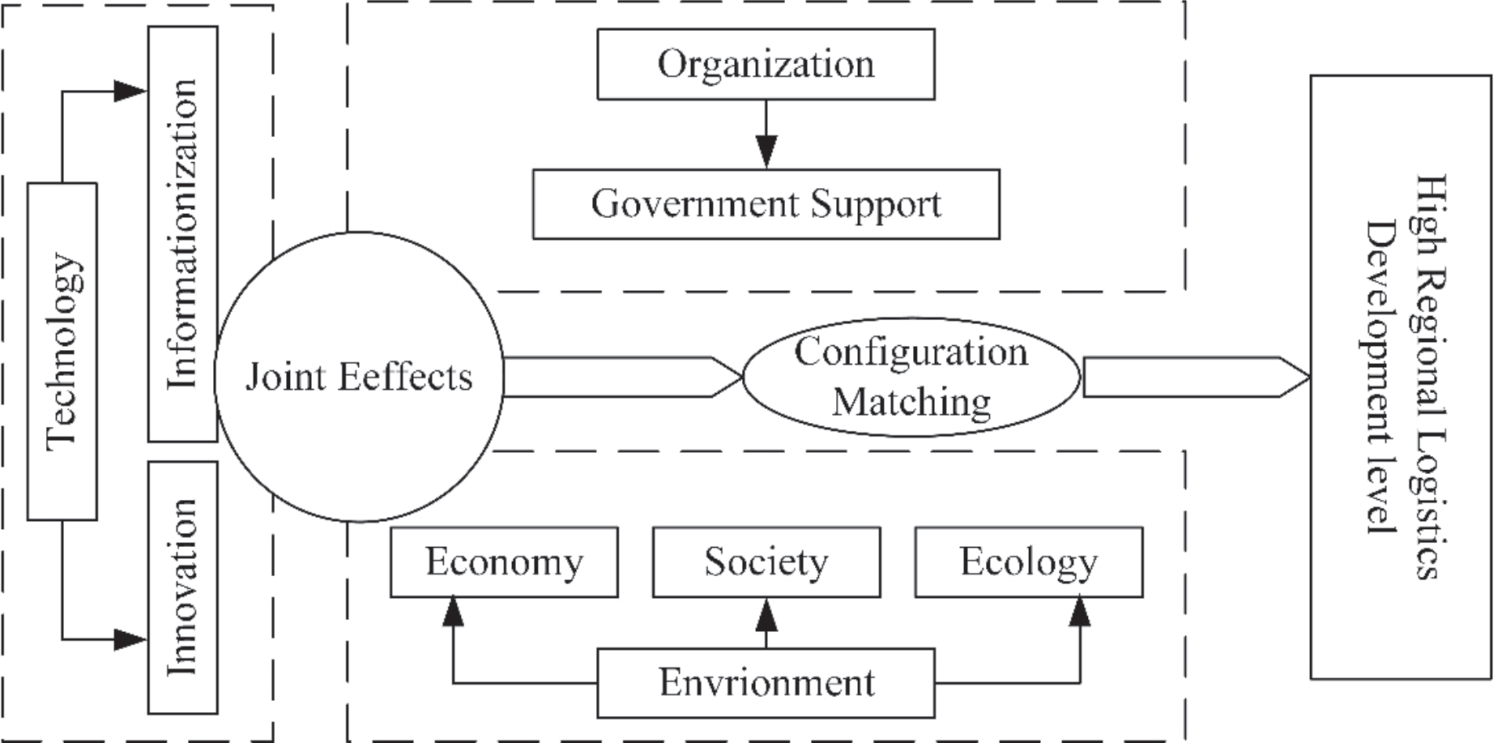
In the realm of regional studies and the development of green logistics, the TOE model offers a holistic research perspective. This study integrates the TOE theoretical framework with extant academic research and the practical landscape of regional green logistics in China, discerning the condition variables stemming from technological, organizational, and environmental dimensions. The specific details are outlined in Table 1.
Technology Context
The relationship between green logistics and technological innovation is profoundly significant, constituting a symbiotic nexus essential for progress [20]. According to Chen et al. [8], the efficacy of green logistics in China is intricately tied to the level of technological integration, with advancements therein pivotal for efficiency augmentation. This underscores how scientific and technological breakthroughs directly address challenges within the logistics sector, fostering green initiatives and bolstering operational efficiency. It’s evident that the practical implementation of cutting-edge technology stands as a linchpin in achieving green logistics objectives; lacking access to such advancements poses considerable hurdles in goal realization. Consequently, the continuous development and innovation of technologies, whether through the introduction of novel solutions or the enhancement of existing ones, emerge as indispensable drivers for fostering regional sustainability and propelling the evolution of green logistics.
This paper separates technology into types of innovation progress (IP) and information advancement (IA), respectively.
Innovation progress not only drives industrial productivity but also wields influence over carbon emissions within the logistics sector. As highlighted by Chen et al. [8], the progression of technology stands as a linchpin in fostering the efficiency of green logistics, thus underscoring its pivotal role in shaping the trajectory of environmental impact within supply chain operations. The findings not only validate the significance of technical progress in enhancing green logistics efficiency but also hint at the broader implications for mitigating environmental footprints across the entire logistics spectrum.
Table 1.
Variables and indicators.
Moreover, the intricate interplay between innovation progress and industrial practices underscores the potential for transformative change in logistics carbon emissions. As technological advancements continue to permeate various facets of the supply chain, from transportation modes to warehouse operations, the opportunity for emission reduction and efficiency gains becomes increasingly pronounced. This convergence of innovation and sustainability imperatives not only propels the evolution of regional green logistics but also underscores its pivotal role in shaping a more environmentally responsible future for the industry. In this paper, we use the ratio of Research and Development (R&D) expenditure to the Gross Domestic Product (GDP) of each region to represent innovation and development.
Proposition 1. Innovation progress significantly contributes to the advancement of green logistics across various domains.
Information advancement stands as a pivotal implementation factor in green logistics, primarily due to its proximity to the flow of goods, thereby facilitating cost savings throughout logistics activities [15]. This assertion has garnered widespread support. For instance, Kumar [14] highlights the role of information and communications technology (ICT) practices in specific logistics activities, underscoring their contribution to sustainable development. Similarly, Geiger [21] emphasizes the significance of communication technologies in fostering environmentally sustainable transportation of goods, leading to reduced consumption in freight logistics activities and facilitating the high-quality development of regional logistics. From a governance standpoint, Du and Li [20] argue that governments across different regions drive green logistics development through strategic leadership. Hence, information advancement holds the potential to curtail resource consumption and costs, thereby enhancing regional logistics services and fostering the high-quality development of regional green logistics.
In this paper, we utilize the revenue from information technology services and total telecommunications business volume as key indicators in this part.
Proposition 2. The level of information advancement acts as a catalyst for regional green logistics initiatives.
Organization Context.
Government support plays a pivotal role in fostering regional green logistics development by serving as a catalyst for implementing policies and initiatives aimed at promoting sustainability within the logistics sector. This support encompasses various aspects, including investments in infrastructure and environmental initiatives, regulatory frameworks, incentives, and partnerships. Among these, the ratio of fiscal expenditure on transport to regional GDP stands out as a crucial metric for assessing the level of government commitment to advancing green logistics agendas. This indicator not only reflects the financial resources allocated towards transportation infrastructure but also signifies the priority given to environmental sustainability within the broader economic strategy.
In this context, the ratio of fiscal expenditure on transport to regional GDP represents the government’s crucial support for the development of logistics infrastructure, which forms the backbone of regional green logistics initiatives. By allocating resources to transportation projects and environmental programs, governments actively contribute to shaping the trajectory of sustainable logistics practices within a region. This tangible representation of government support underscores its multifaceted role in catalyzing and sustaining the momentum toward greener and more sustainable logistics operations.
Proposition 3. Government support is indispensable for advancing green logistics initiatives.
Environment Context
In the realm of green logistics, the predominant focus of research tends to be on environmental concerns, with relatively fewer studies delving into other dimensions. As noted by Lehtonen [22], while there has been a surge in research attention towards the environmental dimension, the social dimension has often been overshadowed, with minimal exploration into the interconnections between these dimensions. Kara et al. [23] argue fostering regional development and competitiveness hinges on two key categories: economic and social investments. Economic investments typically encompass infrastructure development, while social investments extend to areas such as education and healthcare. Thus, within the context of regional green logistics, the crux of the challenge lies in understanding the synergies and trade-offs inherent in sustainability pursuits. In this paper, we aim to address this gap by examining the relationship between regional green logistics and three pivotal factors within the environmental aspect: environmental, social, and economic considerations. Through this analysis, we seek to elucidate the intricate dynamics at play and offer insights into how these factors interact to shape the landscape of sustainable logistics practices.
When the economic environment undergoes enhancements, it paves the way for increased investments in environmental protection and governance, thereby fostering the development of green logistics. Regional economic development not only provides the financial resources necessary for social advancements but also facilitates the enhancement of public transportation infrastructure and support facilities, as noted by [24]. These improvements directly and indirectly contribute to the advancement of regional logistics capabilities. Moreover, the degree of openness in the regional economy also plays a pivotal role in both economic development and environmental improvement. Import trade, in particular, facilitates the absorption of foreign advanced technology and management practices, thus contributing to the transition towards greener logistics operations [25]. Therefore, the interplay between regional economic development and environmental sustainability underscores the critical role of economic factors in driving the evolution of green logistics within a region.
In this study, we utilize indicators such as GDP per capita, the proportion of the added value of the tertiary industry to GDP, and proportion of total import and export volume to regional GDP to gauge regional economic development, financial backing, and openness level [26].
Proposition 4. Economic development plays a crucial role in fostering regional green logistics.
The social environment encompasses various aspects of regional livelihood, including cultural and educational opportunities, healthcare facilities, quality of public transportation, and living conditions. Unfortunately, it often receives less attention in studies concerning regional logistics development.
Kara et al. [23] demonstrate the significant impact of social infrastructure investments and education expenditures on regional income and advancement, as evidenced by empirical analysis conducted in Turkey. Social investments encompass government allocations in education, healthcare, the arts, and other related domains. Logistics operations globally contribute to air and water pollution, with more pronounced effects observed in developing nations. Adoption of green practices presents a viable solution to mitigate several environmental and social challenges. Moreover, the implementation of green practices enables governments to exercise better control over prevalent health issues [27]. Consequently, favorable social conditions within regions can foster the development of green logistics initiatives. Consequently, we employ the ratio of expenditure on education, healthcare, arts, and sports to GDP and the illiteracy rate as metrics to gauge the correlation between the social environment and the developmental level of regional green logistics.
Otherwise, the impact of population dynamics on green logistics is widely acknowledged. Particularly, rural-to-urban migration can reshape the demographic landscape of a region, leading to increased energy consumption and transportation usage [28]. Therefore, it is imperative to consider social development when examining its correlation with regional green logistics.
Proposition 5. Social development is essential for the advancement of regional green logistics.
The ecological environment plays a pivotal role in regional sustainable development. Firstly, a healthy ecological environment ensures the availability of natural resources that can be sustainably utilized in the construction of logistics infrastructure, facilitating environmentally friendly logistics activities. Conversely, a degraded ecological environment, characterized by issues such as air pollution and excessive carbon emissions, directly impacts human health and quality of life. This, in turn, escalates the demand for medical and social services, ultimately hindering the attainment of high levels of green logistics development across different regions and exacerbating ecological degradation in specific areas [24].
In summary, the state of the ecological environment directly influences the level of development in green logistics within regions. The advancement of sustainable practices and the preservation of ecological balance are fundamental pillars for fostering low-carbon and high-quality regional logistics. To assess the ecological environment, this study utilizes two key metrics: Park green area per capita and Waste harmless treatment rate. Specifically, Park green areas per capita serve as a measure of residential green space and ecological conservation status, while the Waste harmless treatment rate reflects the efficacy of environmental governance [24].
Fig. 1.
Research Framework: Configurational Effects on Regional Logistics Development using the TOE Framework.
Proposition 6. The ecological environment serves as a prerequisite for achieving a high level of green logistics development.
Following the previous conversation, the research framework for this study has been set up and is clearly depicted in Fig. 1.
Research Methodology and Data Collection
Entropy Weight Method
Shannon first introduced entropy to information theory, Shannon [29], a concept that has found widespread application across various fields, including engineering and socioeconomics. The essence of the entropy weighting method (EWM) lies in determining objective weights based on indicator variability. In essence, when the entropy Ei of an indicator is smaller, it signifies greater variability in the indicator value and hence provides more informative content. Consequently, such indicators exert a greater influence on comprehensive evaluations, leading to larger assigned weights. Conversely, if the entropy Ei of an indicator is larger, it suggests less variability in the indicator value and therefore provides relatively less information. Consequently, these indicators play a smaller role in comprehensive evaluations, resulting in smaller assigned weights. The detailed process is shown below.
1. Standardized processing of original data (Min-Max Normalization).
Given the original data for the i-th indicator as xi, and its corresponding standardized data as x'i, positive indicators are treated using Formula 1, while negative indicators are handled with Formula 2. The commonly employed min-max normalization formula is represented as follows:
2. Calculate the entropy of each indicator.
For the i-th indicator, the entropy Ei is calculated using the following formula:
Here, pij represents the standardized value of indicator i for the j-th evaluation object, and n represents the number of evaluation objects.
3. Determine the weightings of each indicator.
For the i-th indicator, the weighted entropy Wi is calculated using the following formula:
Here, m represents the total number of indicators.
4. Calculation of comprehensive evaluation indicators.
The formula for calculating the comprehensive evaluation indicator is as follows:
Here, Vj represents the comprehensive evaluation indicator value for the j-th evaluation object, Wi represents the weighted entropy for the i-th indicator, and x'i represents the standardized value for the i-th indicator.
FsQCA
Fuzzy Set Qualitative Comparative Analysis (fsQCA), developed by sociologist Charles Ragin, is a method of set-theoretic causal analysis that offers a means to explore causal relationships between conditions and outcomes [30]. Unlike conventional correlation-based quantitative methods like traditional regression analysis, fsQCA aims to establish logical connections between causal conditions and outcome combinations. This approach allows for the examination of intricate, interactive relationships among multiple variables in diverse contexts, where different combinations of causative factors can lead to the same anticipated outcome. By employing fsQCA, researchers can delve deeper into the phenomena under investigation, unraveling the complex interplay among various influencing factors [19]. Additionally, fsQCA is adept at analyzing small-n data [31], a capability that facilitated the examination of a sample comprising 30 provinces and cities in this study. The analysis was conducted using fsQCA4.0 software.
Data Collection, Measurement, and Calibration
Previous research indicates that a multitude of factors play a role in shaping the trajectory of regional green logistics development. In this section, we identify these factors within the organizational, technological, and environmental dimensions, drawing upon the TOE framework and existing literature. Subsequently, we construct the framework for fsQCA analysis, comprising one outcome variable and six condition variables. The specifics of these variables are delineated in Table 1.
Data Collection and Preprocessing
The data for both the outcome and conditional variables were selected in the year 2021 and sourced from governmental reports and statistical yearbooks accessible via the National Bureau of Statistics of China website (http://www.stats.gov.cn/), as well as from local statistical yearbooks of 30 provinces and cities (excluding Xizang, Hong Kong, Macao, and Taiwan). Furthermore, the data on carbon emissions is selected from the CEADs (https://www.ceads.net/), a professional research team. All the data we collected are normalized using the min-max method during the preprocessing stage.
Outcome Variables
Various academic perspectives exist regarding the measurement of regional green logistics. Many scholars, both domestic and foreign, predominantly assess regional logistics from a single standpoint: the environment [8, 32]. However, there are limited studies that examine it from diverse angles. From the perspective of the supply chain, Kumar [14] deconstructs the concept of green logistics into five distinct practices, including green transport, green warehousing, green packaging, green procurement, and waste management. This study evaluates regional green logistics performance using specific indices for each province in China. To probe into the driving forces behind regional green logistics development, we examine several factors. Firstly, we delve into energy consumption intensity within the local logistics sector, as it gauges a region’s energy efficiency, serving as a significant indicator of logistics development within regions [33]. Moreover, energy consumption per unit in logistics explores the correlation between energy consumption intensity and carbon emissions in the logistics domain [34]. Secondly, we employ Freight turnover to assess logistics industry performance, reflecting the industry’s vitality [8]. As freight turnover generates carbon emissions during transportation and distribution processes, increased Freight mileage leads to higher energy consumption in logistics, consequently augmenting its carbon footprint. These metrics collectively provide a comprehensive overview of the development level and capability of green logistics within each region [8].
Regarding the calculation of energy consumption intensity in regional logistics, numerous methods are available. Such as the emission coefficient method based on direct energy consumption, the indirect input-output method, the life cycle method, and others [3]. This study employs the widely used and acknowledged IPCC emission coefficient method. Carbon emission calculations primarily rely on energy consumption data obtained from statistical sources, utilizing standard coal coefficients and carbon conversion coefficients for various energy sources [34]. The calculation formula is as follows:
In the context of our analysis, C represents the estimated carbon emissions (unit: ten thousand tons); i denotes the energy source category (e.g., coal, coke, crude oil, gasoline, kerosene, diesel oil, fuel oil, natural gas); Ei signifies the consumption of energy source i (unit: ten thousand tons of standard coal); Xi represents the CO2 emissions from energy source i (unit: ten thousand tons); Hi denotes the average low calorific value of energy source i (unit: kJ/kg); Fi indicates the carbon content per unit calorific value of energy source i (unit: tons of carbon/kJ); Oi is the carbon oxidation rate of energy source i. Taking into account the energy consumption structure of the logistics industry, we consider eight distinct energy types (refer to Table 2) to estimate carbon emissions in the logistics sector. Additionally, all CO2 emission factors for various energy types are detailed in the table.
Table 2.
The carbon emission of 30 provinces and cities in China’s logistics industry in 2021 (Unit: ten thousand tons).
Based on Formula 6 and statistical data, the carbon emissions resulting from various energy sources in China’s logistics industry, along with the total carbon emissions in each region, are calculated as presented in Table 3.
Conditional Variables
In this section, we identify potential factors and categorize them into organizational, technological, and environmental dimensions, drawing upon the TOE framework and existing research. Subsequently, we construct the analysis framework, comprising an outcome variable and condition variables. While the specific measurements selected are detailed in Table 1, they have been referenced in the preceding section and are not reiterated here.
Variable Calibration
The initial step in fsQCA analysis involves data calibration, a fundamental procedure akin to calibrating measuring instruments in natural sciences like chemistry, astronomy, and physics to recognized standards [35]. Two primary methods are employed for data calibration in QCA: direct and indirect calibration. The direct method utilizes three directly determined anchor points, while the indirect method bases calibration on sample distribution and theoretical knowledge. In the absence of external standards or substantive research, calibration can rely on sample percentiles [36]. Regardless of the method, calibrated values typically range between 0.0 and 1.0. In line with Ragin’s guidance [35], this study adopts the direct calibration method, setting three anchor points to structure a fuzzy set: full membership (95%), full non-membership (5%), and non-membership (50%). Original data was transformed into membership using the calibrate (x, n1, n2, n3) function in fsQCA 4.0 software. Calibration results for each variable and their descriptive statistics are presented in Table 4.
Empirical Analysis and Results Discussion
In this study, we utilized both fsQCA4.0 and SPSS software to analyze our data. After calibrating the models, we examined the necessity conditions related to four condition variables: Innovation Progress (IP), Information Advancement (IA), Government Support (GS), Economic Environment (EE1), Social Environment (SE), and Ecological Environment (EE2). Subsequently, we conducted a comprehensive sufficiency analysis focusing on different configurations, followed by a rigorous assessment of the robustness of our findings.
Necessary Condition Analysis
Following the calibration of fuzzy set variables, it is essential to conduct necessary condition tests for each variable, as emphasized by prior research [37]. Additionally, importing sample data fuzzy membership scores into the fsQCA 4.0 software is a critical step in the analysis process. In this study, we identified necessary conditions for the outcome variable by considering antecedent conditions with a consistency level greater than 0.9 and a coverage level exceeding 0.5, consistent with established criteria [38]. Conversely, antecedent conditions with lower consistency levels are deemed insufficient to constitute necessary conditions. As shown in Table 5, the necessary conditions are not found.
Constructing the Truth Table
Following the necessity testing, it is imperative to establish thresholds for sufficient conditions. Sufficient conditions indicate that specific causal factors, either individually or in combination, have the ability to effectively lead to the desired outcome. Upon completing the calibration process using the fsQCA4.0 software, a truth table is generated, serving as a crucial tool for reflecting the intricate causal relationships within the system [35]. The frequency threshold is set at 1.5% of the sample size, while the original consistency threshold is set to 0.8. Logical condition combinations with a sample size greater than or equal to 1 and an original consistency greater than 0.8 are retained. Additionally, PRI consistency scores are re-encoded based on observed breaks in the distribution of consistency scores [39]. When the PRI consistency is greater than or equal to 0.7, the result variable 1 is retained; otherwise, it is manually changed to 0 for the corresponding combination [7]. Finally, complex, parsimonious, and intermediate solutions are obtained, and the intermediate solution is nested within the parsimonious solution for comparison. The resulting configuration outcomes are summarized in Table 6.
Table 3.
Total carbon emission of each Chinese region’s logistics industry in 2021 (Unit: Million tons).
Table 4.
Variable calibration results and descriptive statistical analysis.
Table 5.
Analysis of necessary conditions.
Results
To determine the core conditions of each solution, we examine the nesting relationship between the intermediate and parsimonious solutions. Conditions present in both the intermediate and parsimonious solutions are identified as core conditions, while those exclusively found in the intermediate solution are considered marginal conditions. The experimental findings reveal three main paths: path 1, path 2, and path 3. Path 2 represents the high development path of regional green logistics and comprises two subtypes: path 2a and path 2b. Path 3 represents the non-high development path and includes two subtypes: path 3a and path 3b. In the high development path, the overall consistency reaches 0.940, indicating that approximately 94.0% of regions exhibit high-level development of green logistics among cases meeting these two high configurations. The overall coverage rate is 0.599, suggesting that the configuration analysis results encompass 59.9% of actual cases. Conversely, in the non-high development path, the overall consistency reaches 0.887, signifying that about 88.7% of regions display non-high-level development of green logistics among cases meeting the configuration. The overall coverage rate is 0.664, indicating that the configuration analysis results cover 66.4% of cases.
We categorize the configurations representing high (Type I and Type II) and non-high (Type III) development levels into three distinct types, as outlined below:
Type I: driven by technology-environment. This configuration demonstrates a remarkably high level of consistency, reaching 0.950, and encompasses 44.5% of the membership in the outcome. Identified by path1, this type combines the core presence of Information Advancement (IA), Economic Environment (EE1), and Ecological Environment (EE2), while Government Support (GS) and Social Environment (SE) are deemed core absence conditions. This suggests that in regions where other variable conditions exist, a high level of regional green logistics can be achieved irrespective of investments in infrastructure construction and social development. The rationale behind this phenomenon lies in the geographical location of these regions in the eastern coastal areas, where infrastructure and societal development have already reached significant levels. Consequently, these regions prioritize investments in information technologies, economic well-being, and ecological preservation. Thus, the integration of economic, ecological, and informationization factors promotes a high level of green logistics. Representative cases of this type include Guangdong, Jiangsu, Fujian, Shandong, Zhejiang, and Anhui.
Table 6.
Configuration combinations for the development path of regional green logistics.
The geographic context of these regions, primarily along the eastern coast, sheds light on why this pattern occurs. Benefiting from well-established infrastructure and societal structures, these areas prioritize investments in information technologies, economic growth, and environmental conservation. This strategic alignment of economic, ecological, and technological factors not only maintains their developmental momentum but also drives them toward greater efficiency in green logistics. Guangdong, as a prime example, encapsulates this synergy among technology, economy, and environment, fostering green logistics. Its coastal location has facilitated robust infrastructure development and societal progress, forming a strong base for innovative initiatives. By emphasizing information technologies, Guangdong has streamlined logistics processes, improving efficiency and lessening environmental impact. Type II: driven by technology. This type comprises two configurations with slight variations, namely path2a and path2b. Path2a constitutes the majority of cases (39.3%) and demonstrates a relatively high consistency level of 0.963. Meanwhile, path2b exhibits the highest consistency level of 1.000 and covers 23.9% of the membership in the outcome. In Type II, characterized by the core presence of the innovation process (IP) and the absence of the Economic Environment (EE1), regional green logistics can achieve a high level of development. This finding suggests that even in regions where economic development is lacking, advancements in technology, particularly the innovation process (IP), can significantly enhance the level of green logistics. Hence, this configuration underscores the critical importance of regional technological advancement for green logistics. Representative cases in this path include Shaanxi, Henan, and Hebei.
As far as Shaanxi is concerned, the strategic embrace of innovative processes emerges as a decisive driver. Despite prevailing economic challenges, Shaanxi’s directed emphasis on technological advancements, particularly within the realm of innovation processes (IP), has catalyzed the transition towards sustainable logistics practices. This exemplifies the catalytic potential of technology in mitigating economic impediments while fostering environmental sustainability. Specifically, Shaanxi has implemented targeted measures to bolster its green logistics infrastructure. These include the adoption of eco-friendly transportation systems, notably electric vehicles, alongside initiatives promoting the integration of renewable energy sources within logistics operations. Moreover, Shaanxi has directed substantial investments towards infrastructure development, exemplified by the construction of green warehouses outfitted with energy-efficient technologies and the strategic establishment of logistics hubs aimed at curbing carbon emissions.
Table 7.
The analysis result of the robustness test.
Furthermore, collaborative endeavors involving governmental entities, industry stakeholders, and academic institutions have played a pivotal role in fostering the adoption of sustainable logistics practices. Such collaborations manifest through policy frameworks that incentivize technological innovation, alongside knowledge dissemination initiatives aimed at disseminating best practices throughout the logistics ecosystem.
Type III: hindered by organization-environment. This type of configuration encompasses both path3a and path3b, with slight variations between the two. Notably, path3a demonstrates a relatively high level of consistency at 0.880, covering 41.4% of the membership, while path3b exhibits a consistency level of 0.832, covering 48.7% of the membership. In this configuration, Government Support (GS) and Social Environment (SE) are identified as core absence conditions, while Innovation Progress (IP) emerges as the core presence condition. This indicates that the absence of technological progress, inadequate investment in logistics infrastructure, and limited social development pose challenges to promoting the development of regional green logistics. Representative cases in this category include Qinghai, Gansu, Jilin, Hainan, Ningxia, Inner Mongolia, Xinjiang, Shanxi, Yunnan, Guizhou, and Heilongjiang, which are primarily situated in remote areas of China.
In remote areas of China, the lack of Government Support (GS) and a limited Social Environment (SE) act as significant obstacles to green logistics advancement. The absence of tailored governmental initiatives hampers progress, while the region’s limited social development may impede the adoption of sustainable practices due to a lack of human capital and societal awareness. However, Innovation Progress (IP) presents a vital opportunity for overcoming these challenges. By leveraging technological advancements, these regions could potentially mitigate the impact of absent government support and limited social development. Yet, without concerted efforts to address these absent conditions, regions under this type, alongside other regions in the hindered organization-environment configuration, may struggle to enhance their regional green logistics capabilities.
Robustness Test
To ensure the reliability of our research findings, we will conduct a robustness analysis. Schneider and Wagemann [40] proposed three operations for conducting such an analysis: calibrating changes, modifying the consistency threshold, and adding or deleting cases. In this study, we utilized the fsQCA 4.0 software to adjust the alternative calibration values to 0.75, 0.5, and 0.25. The results revealed the same three configurations in the high development path, albeit with slight alterations in consistency (0.908) and coverage (0.851). Similarly, two configurations in the non-high development path exhibited minor changes, with an increase in consistency (0.940) and coverage (0.561). The outcomes, detailed in Table 7, closely align with those presented in Table 6. These findings affirm the consistency between the conditional and original configuration outcomes, with no significant deviations in consistency and coverage. Therefore, the conditional configurations outlined above can be considered reliable, underscoring the robustness of the study’s conclusions.
Conclusions
This paper proposes a framework for analyzing regional green logistics based on the TOE theory. The framework considers multiple factors related to technology, organization, and environment, including Innovation Progress, Information Advancement, Government Support, Economic Environment, Social Environment, and Ecological Environment. Utilizing the fsQCA method, the study analyzes the influencing factors and configurations associated with different levels of development in regional green logistics in China. The analysis uncovers the complex impact mechanisms of various conditions on the high-level and non-high-level development of regional logistics. Two paths representing highly developmental levels and one path representing non-highly developmental levels in regional green logistics are identified. The findings support the six research propositions of the study. Based on the experimental results and analysis, the following conclusions are drawn:
1. Achieving high-level and non-high-level sustainable development in regional logistics requires the convergence of multiple factors; no single factor alone can elevate the level of development. Put differently, the advancement of regional green logistics is the culmination of synergistic interactions among various factors.
2. When considering the combination of influencing factors, the attainment of a high-level developmental status in regional green logistics reveals multiple equivalent configuration paths, each comprising distinct factors. Specifically, there exist two avenues to achieve high-level green logistics development: one emphasizing technology and the environment, and another focusing solely on technology. Conversely, a hindrance to high-level development stems from an emphasis on organization and the environment. These influencing mechanisms emerge from the interplay among technology, organization, and environment. Robustness tests validate the effectiveness of all configurations.
3. Technology is the key to promoting high-level development because it appears in all high-development paths, which is in line with the previous studies [20, 33, 41]. For the eastern coastal provinces, technology development (information advancement) is the main contributor to the high level with the combination of environment (economic and ecological). For the inland high-level areas, technology (innovation progress) can enable the high development of green logistics. Thus, technology plays a great role in the development of green logistics.
4. Government support may not be necessary for green development in regional logistics. This result is consistent with previous analysis [4]. Chen et al. [8] investigate the factors influencing green logistics through empirical analysis. They find that the unbalanced and polarized phenomenon in the regional green logistics within the different areas of China depends on the bottleneck of the overall development caused by the technological process. Compared with coastal regions in China, investment in logistics is more important for the inner areas of China because the benefit of the expanded investment is much greater in relatively poor-developed regions [11]. Thus, more investment in infrastructure may contribute to more environmental pollution in developing and related poor regions to some extent, which hinders the promotion of higher levels of green logistics in regions.
Policy Recommendations
Based on the above analysis, this paper puts forward the following policy recommendations for provinces and cities to improve the developmental level of regional green logistics.
1. Encourage the promotion of green logistics technology.
Encouraging the promotion of green logistics technology is crucial in addressing the current challenges faced by China’s logistics sector. Presently, the technical capabilities of logistics enterprises in China remain relatively low, characterized by outdated and inefficient modes of operation that fail to meet the increasing demand for high-quality logistics services. To address this, substantial investments in logistics and technical technologies are necessary at both the enterprise and regional developmental levels. By embracing technological innovation, logistics efficiency can be significantly enhanced, meeting the evolving demands for high-quality logistics services and promoting sustainable development on a regional scale.
Logistics-related technological innovation should be prioritized across various aspects, including equipment manufacturing, planning, and management. This entails leveraging advancements in technology to streamline operations, reduce costs, optimize vehicle utilization, and decarbonize warehousing operations [33]. Moreover, strengthening the promotion of green logistics practices is essential in light of China’s vigorous efforts to promote energy conservation and emission reduction [8]. Logistics enterprises must heighten their awareness of environmental protection and take proactive measures such as promoting packaging recycling, optimizing transport routes, and transitioning to environmentally friendly new energy vehicles.
From a corporate perspective, advancing green logistics requires a multifaceted approach that combines behavioral changes within logistics enterprises with the adoption of innovative technologies. This involves instilling a culture of environmental responsibility among employees and stakeholders, as well as investing in cutting-edge technologies to enhance operational efficiency and reduce environmental impact.
On a macro level, technological progress is instrumental in driving the transition towards greener logistics systems. Collaboration between governments, industry associations, and international organizations is essential to foster innovation and research in sustainable transportation technologies. This includes developing advanced vehicle propulsion systems like electric and hydrogen fuel cell technologies, as well as implementing smart logistics solutions to optimize supply chain efficiency while minimizing environmental footprint. Policymakers should also incentivize the adoption of these technologies through regulatory frameworks, subsidies, and investment incentives to accelerate the transition towards a more sustainable transportation ecosystem.
2. Promote the coordinated development between sustainable development and logistics.
It is imperative to address existing disparities in logistics development across regions [34]. These variations, are attributed to to differences in resource endowments, economic infrastructure, and technological foundations among different regions. For example, regions with abundant natural resources may have an advantage in certain aspects of logistics, while those with well-developed economic infrastructure may excel in others. In addition, variations in technological capabilities further contribute to these disparities, impacting the efficiency and effectiveness of logistics operations.
To effectively address these differences, regions must undertake a comprehensive assessment of their unique advantages and strengths. This process involves not only identifying areas where they excel but also understanding how these strengths can be leveraged to promote sustainable logistics practices. For example, regions with advanced technological progress may focus on implementing cutting-edge logistics technologies to minimize environmental impact, while those with strong economic development may invest in infrastructure upgrades to enhance logistical efficiency.
Furthermore, fostering further coordinated development is essential for overcoming individual challenges and advancing green logistics initiatives [1]. Collaboration among regions allows for the sharing of resources, expertise, and best practices, facilitating the implementation of sustainable logistics solutions on a larger scale. From a supply chain perspective, effective collaboration requires joint decision-making on key aspects such as green product design, cost-sharing for implementing environmentally friendly practices and establishing long-term commitments with suppliers to ensure continuity and reliability [5].
In essence, the synergy between sustainable development and logistics relies on recognizing and addressing regional disparities while capitalizing on unique strengths. Through coordinated efforts, regions can drive progress towards more environmentally friendly and efficient logistics systems, thereby contributing to overall sustainable development goals and fostering a more resilient and equitable global economy.
3. Develop policies and regulations on green logistics.
More attention should be focused on low-carbon development in logistics by implementing relevant regulations, for example, by incorporating green logistics in government plans [33]. Governments can incentivize and enforce environmental standards for logistics operations, encouraging companies to adopt sustainable practices. This may include offering subsidies or tax breaks for the purchase and use of environmentally friendly vehicles, providing grants for implementing recycling programs and imposing penalties for non-compliance with environmental regulations [6].
Moreover, government-led initiatives can promote research and development in green logistics technologies, fostering innovation and driving the adoption of more efficient and eco-friendly solutions. By investing in infrastructure improvements, such as expanding public charging stations for electric vehicles and developing smart transportation systems, governments can create an enabling environment for the widespread adoption of green logistics practices.
Collaboration between the public and private sectors is also essential for advancing green logistics agendas. Public-private partnerships can facilitate knowledge sharing, resource pooling, and joint investment in sustainable infrastructure projects. By working together, governments and logistics enterprises can overcome barriers to green logistics implementation and accelerate progress towards a more environmentally sustainable transportation system.
Limitations and Future Research
This study delves into path analysis to assess the influence on regional green logistics across various provinces and areas in China. While it offers valuable insights, it is not without limitations. The analysis is based on data from the most recent year, providing results from a static perspective. To address this limitation, future research could adopt a multi-year, long-term approach. By doing so, it can not only identify the specific pathways of development for each region but also track and analyze changes over time. This longitudinal approach would enable a deeper investigation into the dynamics of regional development in green logistics, thereby making a more significant contribution to the overarching goal of regional high-quality development.

