


Introduction
Textile plant wastewater often contains residual azo dyes that are challenging to eliminate. These synthetic azo dyes have intricate aromatic molecular structures [1]. Apart from physical and biological techniques, chemical methods are frequently employed for wastewater treatment in these factories, resulting in the generation of additional chemical pollutants [2, 3]. The absence of effective remediation technologies in industrial plants results in the release of dye wastewaters into the environment, leading to detrimental impacts on the health of plants, animals, and humans [4-7].
The textile industry is among the largest in Egypt and many developing countries. Most textile industrial plants are located in agricultural areas of the Nile Valley and its Delta, where they dispose of their untreated, dye-containing wastewaters into the environment [1, 8]. Approximately 12-15% of these dyes are discharged into manufacturing processes’ effluents [9]. However, this problem is further compounded by the overuse of dye utilization, particularly in old factories, which leaves approximately 50% of the dyes in a free state, ultimately discharged from factory effluent into nearby irrigation water bodies. Many reports have indicated that dye pollution poses a serious risk to human health, and numerous dyes have been found to have elevated potential for carcinogenicity. Therefore, tools are needed to treat dye residues quickly and inexpensively before they reach the environment.
Currently, most countries require industrial waste treatment to abide by environmental laws [10]. The need for new bioremediation technologies for textile dye waste is crucial to enable this national industry to thrive in the present and grow in the future. The lack of suitable technologies for the remediation of textile dyes will negatively impact the growth of this vital industry. Therefore, developing the bioremediation technology for textile dye waste is imperative and of national interest. Several recent research articles were conducted on alternative uses of emerging technology, bioremediation, and industrial wastewater recycling [11-14]. Many enzymes contribute to the degradation of azo dyes. Some of these enzymes are: Azoreductases: (E.C. 1.5.1.30), (E.C. 1.6.5.2) and (E.C. 1.7.1.6) 2), lignin peroxidase: (E.C. 1.11.1.14), laccases: (E.C. 1.10.3.2) and dioxygenases: (several types such as: 1,2 catechol dioxygenase E.C. 1.13.11.1 and 3,4 catechol dioxygenase E.C. 1.13.11.3) [12].
The originality of this study lies in its integrative and multifactorial optimization of azo dye biodegradation using indigenous bacterial isolates, a feature that has been scarcely addressed in prior research. Additionally, glucose levels, nitrogen source types, and trace element supplementation provide a dynamic model of dye biotransformation. Recent works by Raza et al. [13] and Tanaya et al. [14] highlighted the eco-friendly potential of microbial consortia in textile wastewater remediation. However, it lacked a systematic enzymatic and nutritional optimization framework. Furthermore, the inclusion of newly identified enzymes under variable substrate conditions provides novel insights into the field of enzyme-mediated dye biodegradation, underscoring the unique value of this research to environmental microbiology and industrial waste management.
In addition, a clear scientific gap in understanding how specific environmental and nutritional factors modulate the enzymatic machinery involved in azo dye degradation could clarify the complex interrelation between growth conditions and the induction of key enzymes, such as azoreductases, laccases, and lignin peroxidases. That could systematically elucidate and reveal bacteria-specific and dye-specific enzymatic profiles. Such comprehensive profiling enables more targeted and efficient bioremediation strategies, which are increasingly demanded by evolving environmental legislation and sustainable development goals. For instance, Li et al. [15] recently engineered an azoreductase from Roseibium sp. for alkaline dye degradation, yet did not investigate enzyme expression modulation under real-world wastewater conditions. Similarly, Ruan et al. [16] emphasized the future of microbiome modeling for bioremediation but lacked empirical validation across industrially relevant pollutants.
Therefore, the present study aims to isolate and identify bacteria that degrade multi-azo dyes and optimize the conditions for decolorization efficiency and enzyme production. By bridging the chemical and enzymatic optimization with practical applicability, it provides a scalable and eco-viable solution for textile effluent treatment, enhancing both the scientific understanding and field-level feasibility of microbial dye remediation. Unlike earlier studies that typically focus on single-strain analysis or limited dye categories, the study of bacterial strains across twenty chemically diverse azo dyes, identifying their functionalities, like Bacillus coagulans and Lysinibacillus macrolides, delves into the interplay between microbial enzymatic responses and variable nutritional and micronutrient conditions.
Materials and Methods
Azo dyes: This study utilized twenty different azo dyes, including Direct blue 71, Reactive blue 4, Reactive orange, Fast green, TMR, Crystal violet, Alura red AC, Tartrazine, Naphthol blue black, Trypane blue, Janus green B, Alizarin yellow R, Evans blue, Brilliant green, Safranin, Pararosaniline, and Ponceau S which were sourced from Sigma. Direct red 80, Cibacron Brilliant Red 3B-A, and Textile direct violet 51 were obtained from Santa Cruz Biotechnology, USA.
Sample Collection
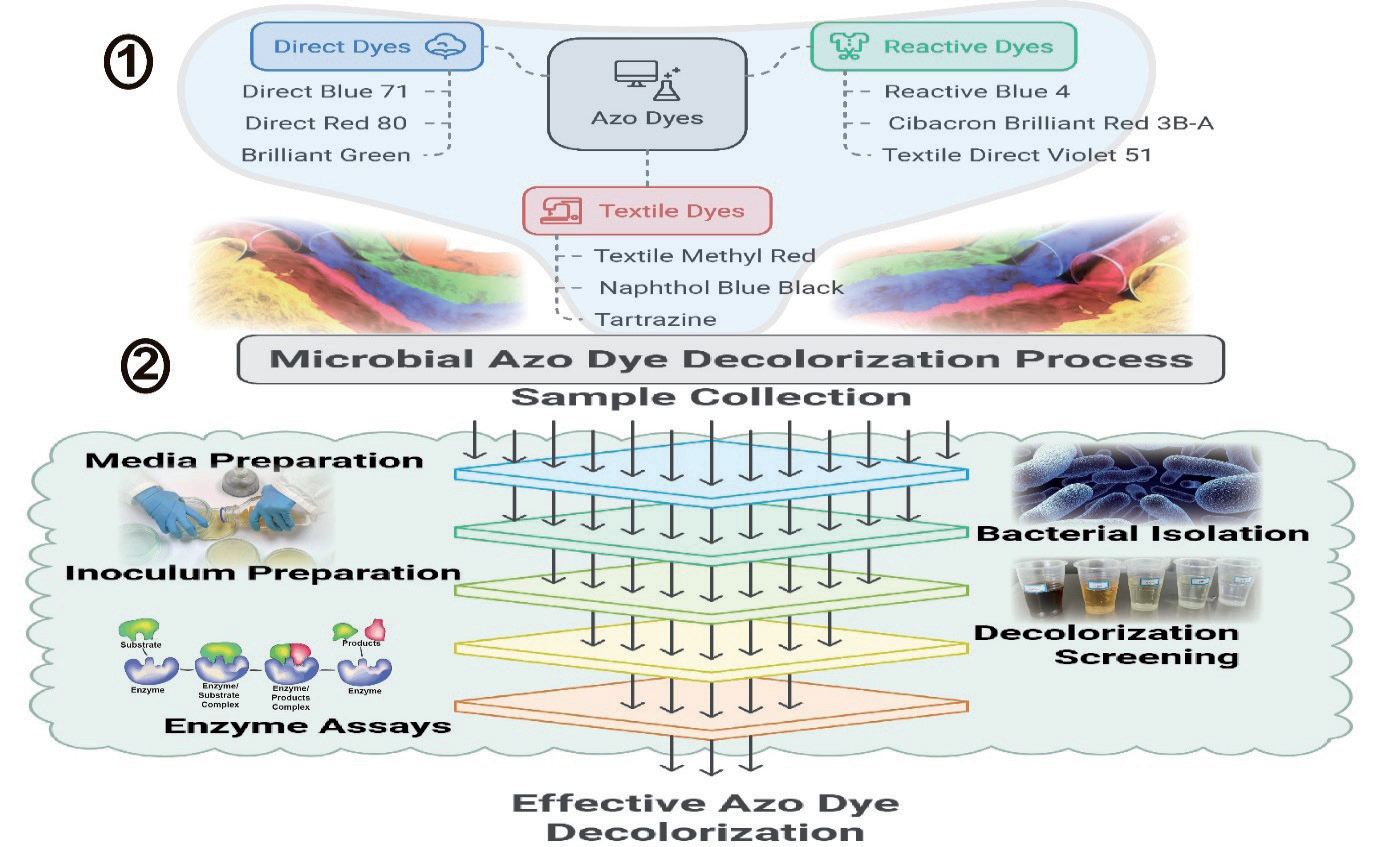
The textile industrial water effluent was collected from the Mrdini factory, 10th Ramadan, Egypt. Soil and water samples were collected from the Suez Canal and Kafr El Sheikh, Egypt. Soil samples were collected from Golden Park, SF, California, USA. The study’s overall design is presented in Fig. 1.
Microbial Media
The mineral salt medium (MSM) formulation detailed by Mares et al. [17], consisted of the following components per liter: NH4NO3, 0.5 g; K2HPO4, 1.5 g; KH2PO4, 0.5 g; MgSO4.7H2O, 0.2 g; FeSO4, 0.02 g; CaCl2, 0.05 g; CuSO4, 0.02 g. 0.5 g/L of yeast extract was added to the medium, and an azo-dye (100 ppm) for dye removal experiments to promote growth factors. The medium was adjusted to pH 5 for fungi and pH 7 for bacteria isolation. Agar at a concentration of 1.7% was included in the medium for solid growth, and the decolorization activity was evaluated using the liquid medium.
Isolation of Azo Dye-Degrading Bacteria
Ten grams of the soil sample was suspended in 100 ml of sterilized saline solution (0.85%) and shaken for 1 h. One ml of either soil suspension or water samples was separately transferred into a Petri dish, and molten MSM (containing 100 ppm of either commercial direct blue, direct green azo-dyes, or the industrial wastewater as a sole source of carbon) was poured and mixed well. The dishes were incubated at 28ºC for five days. The grown colonies were picked up, purified, and maintained on the same solid medium.
Identification of the Bacterial Isolates
All of the bacterial isolates were identified by the 16s-rRNA gene sequencing technique using the following primers: B27F: 5’- AGA GTT TGA TCM TGG CTC AG -3’ and U1492R: 5’-GGT TAC CTT GTT ACG ACT T -3’. The PCR conditions for 16s-rRNA gene amplification were as follows: 95ºC, 10 min; 30× (95ºC, 30 sec; 57ºC, 45 sec; 72ºC, 1 min 30 sec); 72ºC, 10 min; 4ºC forever. The PCR product was separated by 1% agarose gel containing 5 µl 10 mg/ml EtBr and 10µl of Track-it 100bp DNA ladder. The PCR product was purified as follows: Five µl of the PCR product was mixed with 2 µl ExoSAP-It reagent (ExoSAP-IT® PCR Product Cleanup, Affymetrix_ USB) in a clean PCR tube, followed by incubation for 15 min at 37ºC, followed by 15 min at 80ºC, then cooled down to 4ºC in a PCR machine as instructed by the product manufacturer.
Preparation of the purified product for sequencing was performed by mixing 1 µl of the purified PCR product with 2 µl of 3.2 µM B27F primer for individual tube sequencing submission and 9 µl of DNase-free water in a 500 µl clean tube. Into another PCR tube, 1 µl of the purified PCR product was mixed with 2 µl of 3.2 µM U1492R primer for individual tube format submission and 9 µl DNase-free water in a 500 µl clean tube. The samples were sequenced in the University of Minnesota Genomic Center (UMGC). The obtained sequences were trimmed, followed by BLAST analysis online using the NCBI-BLAST web tool: h t t p : / / b l a s t . n c b i . n l m . n i h . g o v / B l a s t . cgi?CMD=Web&PAGE_TYPE=BlastHome
Inoculum Preparation
Each bacterial isolate was cultured separately by transferring a loopful of cells into 10 mL of nutrient broth in 50 mL culture tubes. The tubes were then incubated at 28ºC and shaken at 150 rpm for 24 hours. After incubation, the biomass was separated by centrifugation at 5000×g for 10 min, followed by resuspension in sterilized saline solution (0.85% NaCl). The optical density (OD) was measured at 600 nm and adjusted to 1.0.
Screening for Azo Dye Decolorization Activity
In a 50 ml culture tube, 5 ml of MSM supplemented with 100 ppm of the specified azo dye was separately inoculated with 100 µl (OD = 1) of each bacterial suspension. The tubes were placed in an incubator at 28ºC and agitated at 150 rpm for 5 days to allow growth to occur. Each test was performed in triplicate. Following the incubation period, the biomass was harvested by centrifugation at 5000×g for 5 min, and the absorbance of the supernatant was measured at the maximum absorption wavelength (λ-max) of each tested azo dye. The name of dyes and its λ-max were as following: Reactive red (520), Direct blue (584), Direct red (546), Reactive orange (512), Fast green (418), TMR (480), Crystal violet (600), Alura red (491), Tartrazin (460), Textile direct violet, Naphthol blue black, Reactive blue, Trypan blue, Janus green (λ-max: 626 nm), Alirazin yellow (410), Evans blue (660), Brilliant green (627), Safranin (500), Pararosaniline (550), and Poneau S (567). The λ-max values of the azo dyes were determined using an Agilent G1120A spectrophotometer. The initial OD (control) was measured for the MSM not inoculated with the azo dye, and the relative decolorization percentage was calculated using the formula: Relative decolorization % = 100 - (Sample OD × 100) / Initial OD.
Enzyme Assays
Manganese peroxidases were determined from the purpurgallin formed rate at 420 nm from the reaction between pyrogallol and hydrogen peroxide catalyzed by peroxidase and using the molar extinction coefficient ε 420 = 2640 M-1 cm-1. An enzyme unit was defined as the quantity capable of generating one milligram of purpurogallin in 20 sec at pH 6.0 and a temperature of 20ºC.
Laccase activity was evaluated using 2,6-dimethoxyphenol (DMP, Sigma, St. Louis, MO, USA) following the method described by Abd El-Rahim et al. [18] at 477 nm, where dopachrome formation was monitored using a molar extinction coefficient ε 477 = 18400 M-1 cm-1. The enzyme activities were quantified in µM per minute. One unit of laccase activity was indicated as the enzyme necessary to oxidize 1 µM of DMP per minute at 25ºC. Azoreductase activity was determined following the procedure outlined by Li [15]. The reaction mixture consisted of 400 µl of 50 mM sodium acetate buffer (pH 5), 200 µl of the culture supernatant (enzyme source), and 200 µl of 10 ppm TMR azo dye serving as the azoreductase enzyme substrate. The reaction was initiated by adding 200 µl of 2 mM NADH or NADPH. Enzyme activity was assessed by monitoring the reduction in color intensity per minute at 520 nm at room temperature.
Nutritional Factors Impact
The impact of nutritional factors on decolorization activity was examined by evaluating the effects of varying glucose concentrations, types of nitrogen sources, and microelements on decolorization efficiency, biomass accumulation, and enzyme production. The study on glucose concentration involved enriching MSM with either 10 ppm TMR or 100 ppm of Textile direct violet with different glucose levels (0.25%, 0.5%, and 1%). The influence of organic nitrogen sources was explored through two approaches: a) Substituting ammonium sulfate in the MSM with either casamino acids or yeast extract (0.5 g/L), and b) Enriching the MSM with 0.5 g/L of either casamino acids or yeast extract to observe their impact on decolorization and enzyme production.
To investigate the impact of microelement concentration, a microelement solution was prepared as follows: In each liter, the solution contained 0.3 g of H3BO3, 0.2 g of CoCl2·6H2O, 0.1 g of ZnSO4 7H2O, 30 mg of MnCl2·4H2O, 30 mg of NaMoO4 2H2O, and 20 mg of NiCl2 6H2O. This microelement solution underwent sterilization via membrane filtration (0.2µm) to prevent oxidation of elements at high temperatures. The MSM was then supplemented with various concentrations of the microelement solution: 0 ml/L, 1 ml/L, 2 ml/L, and 3 ml/L. In 50 mL culture tubes, five ml of each medium were individually inoculated with 0.5 ml of bacterial suspension (O.D. = 1) in sterilized saline solution. The tubes were placed on a rotary shaker at 28ºC for 2 days. Biomass quantification was performed by measuring the culture’s optical density (O.D.) at 600 nm. The decolorization percentage of Textile direct violet and TMR dyes was assessed as described previously. The laccases, lignin peroxidases, and azoreductases enzymes were determined in the supernatant after 2 days of incubation. Three replicates were made from each treatment.
Statistical Analysis
One-way analysis of variance (ANOVA) was performed for mean±SD using SPSS Statistics R24.0 (IBM, Chicago, USA) to analyze the significance level of each experiment, whereas α = 0.05 was considered significant and α = 0.01 was considered highly significant. In addition, Duncan analyzed the results to show the differences among the variances.
Results and Discussion
Bacteria Isolation and Identification
Twelve bacterial isolates were obtained from MSM supplemented with either direct green azo dye or textile industrial wastewater as the sole source of carbon. The isolates showed decolorization capacity of dyes on the solid isolation medium. The 16Sr-RNA gene sequencing (Fig. 2) identified these isolates as: Lysinibacillus fusiformis, Lysinibacillus xylanilyticus, Bacillus cereus, Lysinibacillus macrolides, with identification quality 100% and Staphylococcus epidermidis, Staphylococcus aureus, Bacillus coagulans, Bacillus subtilis, Brevibacillus brevis, Brevibacillus parabrevis, Klebsiella pneumoniae, and Brucella melitensis with identification quality 99%. The characteristic 16s-rRNA bands have of about 1500 bp.
Screening for Azo Dye Decolorization Activity
The identified bacterial strains were evaluated for their ability to decolorize twenty different azo dyes (Table 1). Among the dyes tested, Textile direct violet was found to be the most easily decolorized by the bacteria, with decolorization percentages varying between 38.5% and 82.6% across different bacterial strains (K. pneumoniae, L. macrolides, and B. subtilis). Conversely, azo dyes such as Alirazin yellow, Alura red, Evans blue, and Janus green exhibited higher resistance to decolorization, with the maximum decolorization percentages not exceeding 7.7% (equivalent to 7.7 mg/L after a 5-day incubation period).
Recent reports confirm that diverse bacteria can achieve high azo‐dye decolorization efficiencies, often rivaling those seen with the current study’s Bacillus isolates. For example, Streptomyces albidoflavus 3MGH decolorized Reactive Orange 122, Direct Blue 15, and Direct Black 38 by ∼60.7%, 61.4%, and 53.4%, respectively, in 5 days (0.3 g/L dye) under optimal conditions (35 ºC, pH 6, with sucrose as C-source and beef extract as N-source) [19]. In comparison, Khan et al. [20] isolated Sphingomonas, Pseudomonas, and Shewanella strains that achieved 60-92% removal of methyl red, direct yellow 12, and acid black 210 (50 mg/L dyes) within 24-48 h.
The presence of a phenolic hydroxyl group in the structure of these dyes (except Janus green) makes these dyes suitable substrates for lignin peroxidase and laccases, in addition to the diazo bond, which is the site of azoreductase attack. The pathogenic bacteria (S. aureus and S. epidermis, K. pneumoniae, and B. melitensis) were excluded from forthcoming studies. The most effective dye-removing bacteria, namely B. brevis, B. coagulans, L. macrolides, L. fusiformis, and B. subtilis, were studied to enhance their dye-removing capacity through supplementing the growth media with some nutritional factors, including glucose, organic nitrogen, and microelements. Additionally, the growth rate, biomass accumulation, manganese peroxidase, laccases, and azoreductases production were also studied in MSM supplemented with either Textile direct violet or TMR azo dyes as sole carbon sources (Table 2).
Impact of Varying Glucose Concentrations on Decolorization Efficiency, Biomass Accumulation, and Enzyme Production
Effect of Glucose Concentration on the Decolorization Activity
The bacterium L. macrolides showed the highest decolorization percentage of Textile direct violet (50.3%) in medium amended with 0.25% glucose after only two days of incubation. This was followed by B. coagulans (29.2%) at a glucose concentration of 0.5%. The glucose addition inhibited the decolorization of three other bacteria (B. brevis, L. fusiformis, and B. subtilis). In the TMR supplemented MSM, B. coagulans and L. macrolides also showed the highest decolorization percentages, where the maximum decolorization percentage (70.9%) was found at a glucose concentration of 0.5%, obtained by L. macrolides, followed by 63.5% by B. coagulans at a glucose concentration of 0.25% (Table 3) [21].
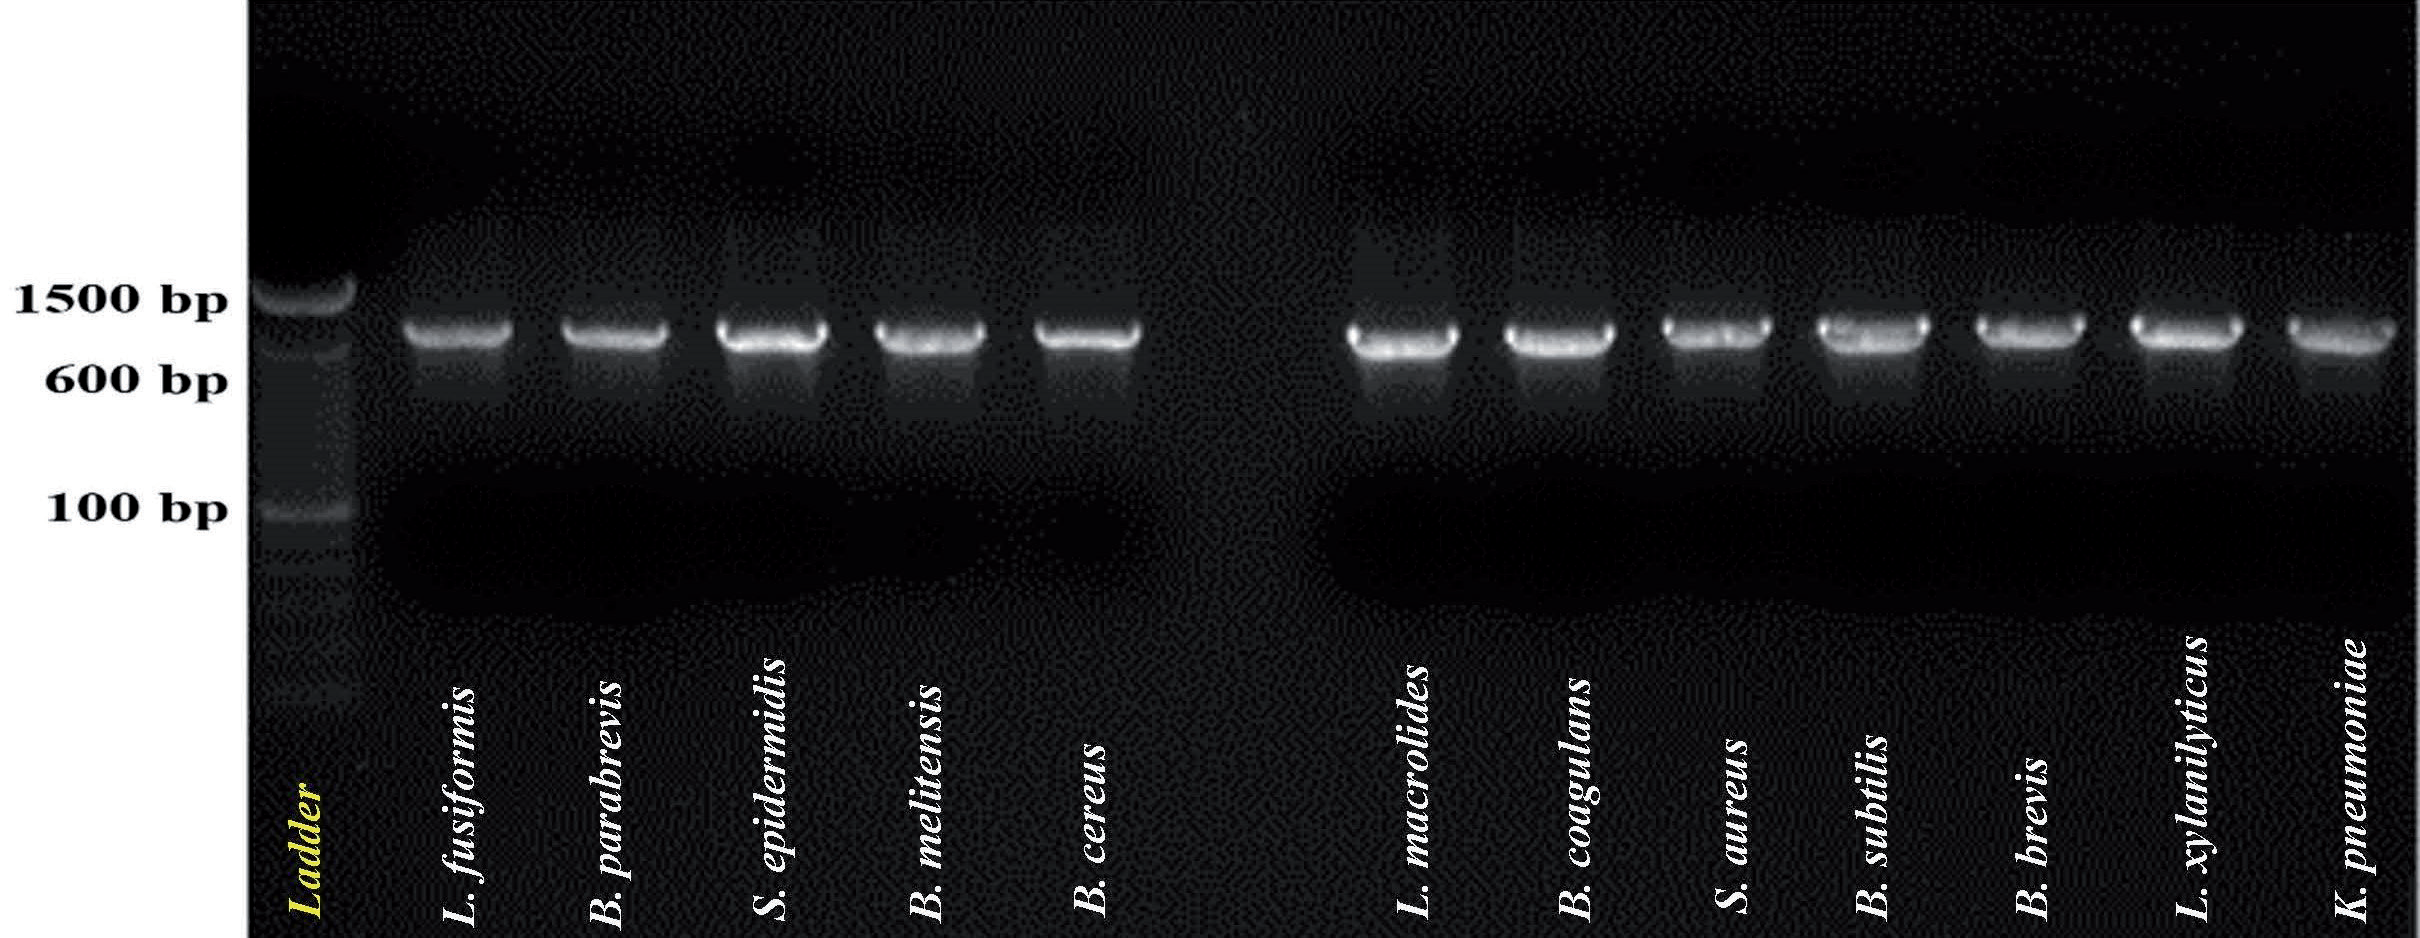
Table 1.
The relative decolorization percentage of 20 azo-dyes by testing 12 bacterial isolates.
[i] Note: A.Y.: Alirazin yellow; A.R.: Alura red; B.G.: Brilliant green; C.V.: Crystal violet; D.B.: Direct blue; D.R.: Direct red; T.D.V.: Textile direct violet; E.B.: Evans blue; F.G.: Fast green; J.G.: Janus green; T.M.: Textile methyl red; N.B.: Naphthol blue; P.R.: Para-rosani-line; P.: Ponceau; R.B.: Reactive blue; R.O.: Reactive orange; R.R.: Reactive red; Sa.: Safranin; Ta.: Tartrazin; T.B.: Trypan blue.
Table 2.
Impact of varying glucose concentrations on bacterial biomass and decolorization rates of textile methyl red and textile direct violet azo dyes.
In this study, supplementation of MSM with organic carbon and nitrogen sources, such as glucose and yeast extract, has enhanced bacterial growth, which is reflected in the biodegradation efficiency accordingly. Besides, yeast extract is commonly used in similar investigations as a source of growth factors, where MSM is a poor medium. Therefore, the biodegradation of azo-dyes can be enhanced through the co-metabolism [16, 22, 23]. However, glucose supplementation in MSM during the biodegradation of organic pollutants may inhibit microbial biodegradation activity, as glucose is utilized as a carbon source by bacteria instead of the organic pollutants. For this reason, the decolorization of Textile direct violet was inhibited in MSM supplemented with glucose. On the other hand, the increase in decolorization by L. macrolides and B. coagulans as a result of glucose addition may be due to the co-metabolism effect or the increase in biomass production, which is significantly enhanced in the presence of 0.25% glucose [24-26].
Effect of Glucose Concentration on the Biomass Production
The biomass of both B. coagulans and L. macrolides was significantly enhanced (2.5-3 folds in media amended with 0.5% glucose in the presence of TMR). The same trend was also obtained in the MSM medium amended with Textile direct violet in the presence of 0.25% glucose. The biomass enhancement was reflected on the increase in azo dyes decolorization percentages by both bacteria at the same glucose concentrations (Table 2).
Effect of Glucose Concentration on the Enzymes Production
In the TMR containing MSM amended with 0.5 % glucose, the highest lignin peroxidase (LIP) activity (1.85 U/mL) was obtained by L. macrolides. This was followed by B. coagulans (1.32 U/mL) at the same glucose concentration. The same trend was also obtained from the same two bacteria in the MSM supplemented with Textile direct violet azo dye. However, the lignin peroxidase activity increased to 1.46 U/mL at glucose concentration of 1% by L. macrolides. These results confirm the higher decolorization activity of the azo dyes by these two bacteria with glucose supplementation (Table 3).
Enzyme assays in these studies implicate flavin‐ dependent azoreductases and oxidative enzymes (laccases, peroxidases) as key catalysts. For instance, the Priestia flexa strain produced significant extracellular azoreductase, lignin peroxidase (LiP), manganese peroxidase (MnP), and laccase activities, with azoreductase and laccase each increasing by ~1.5-2.3- fold during decolorization [20]. More broadly, bacterial azo degradation is thought to proceed via initial reductive cleavage of the –N=N– bond (by azoreductase) followed by oxidative breakdown of aromatic amines (by laccase or LiP) [27-29]. In the Streptomyces study, the specific laccase activity reached 5.96 U/mg after treatment, underscoring laccase’s role in the oxidative steps [19]. In contrast, LiP and MnP often change little during aerobic dye removal, as seen in Priestia, where these peroxidases remained nearly constant [30].
Table 3.
Influence of glucose concentration on the production of lignin peroxidase (LAP), laccase (LAC), and Azoreductase (AR) enzymes (U/ml) by bacteria cultivated in MSM with supplementation of either textile methyl red or Textile direct violet azo dyes.
In the MSM supplemented with Textile direct violet, B. coagulans showed the highest laccase activity (0.5 U/mL) at 0.25% glucose concentration, followed by L. macrolides (0.43 U/mL) at 1% glucose concentration. In the TMR-supplemented MSM, glucose addition inhibited the laccase production by B. coagulans, L. fusiformis, and B. subtilis (Table 4). This may be due to the fact that the TMR itself is not a suitable substrate for laccases, while the Textile direct violet dye is suitable for laccase attack. However, some enzymes, such as dioxygenase, can convert the TMR into a suitable substrate for laccase reaction by adding hydroxyl groups on the phenyl ring. In the absence of these enzymes, the laccases will not be produced by the studied bacteria.
The highest azoreductase activity was obtained by B. subtilis grown on MSM with Textile direct violet and TMR (1.0 and 0.68 U/mL, respectively) without glucose. This was followed by L. macrolides (0.66 U/ml in Textile direct violet, 0.25% glucose and 0.85 U/ml in TMR, 0.5% glucose) (Table 3).
Effect of Nitrogen Source on Bacterial Dye Decolorization Activity, Biomass Accumulation, and Enzyme Production
In this part, the inorganic nitrogen source of the MSM (ammonium sulfate) was replaced by either yeast extract or casamino acids. The decolorization, biomass accumulation, and enzyme production in the presence of Textile direct violet or TMR were determined.
Effect of Nitrogen Source on Dye Decolorization
The TMR was not decolorized by any of the tested bacteria in the absence of ammonium sulfate as a nitrogen source and in the presence of either casamino acids or yeast extract as sole organic nitrogen sources (Table 4). The highest decolorization percentage of TMR (14.9%) was significantly higher in B. coagulans in MSM amended with NH4OH. The MSM amended with Textile direct violet showed variable results, where the highest decolorization percentage (53.5%) was obtained by L. macrolides in the presence of ammonium sulfate, followed by (51.7%) in B. brevis treatment in the presence of yeast extract as a sole source of nitrogen. Next to it was L. fusiformis (37%), which was grown in ammonium sulfate. When the ammonium sulfate was replaced by organic nitrogen source (casamino acids or yeast extract), the bacteria grew utilizing the amino acids and yeast extract as both carbon and nitrogen sources in the Textile direct violet supplemented MSM; therefore, there was no production of laccase, lignin peroxidase, or azoreductases were detected in this medium. On the other hand, in the TMR containing MSM, the azoreductase production was significantly enhanced in this medium by all tested bacteria in the presence of ammonium sulfate as a sole nitrogen source. This result is in agreement with that obtained from the biomass determination, where the biomass was significantly higher in the TMR containing MSM in the presence of ammonium sulfate as a sole nitrogen source. In the absence of lignin peroxidase and laccases, the decolorization can be attributed to the biomass adsorption for both Textile direct violet and TMR azo dyes, azoreductase activity, or other enzymes. This result also reflects the importance of ammonium sulfate compared with organic nitrogen sources for azoreductase production in the MSM supplemented with an azo-dye.
Table 4.
Impact of nitrogen source on bacterial biomass and decolorization of azo dyes in MSM supplemented with either TMR or direct violet azo dyes.
Effect of Nitrogen Source on the Biomass Production
The highest bacterial biomass was obtained in the TMR containing medium in the absence of any organic nitrogen source (utilizing the ammonium sulfate only as a nitrogen source). In contrast, in the Textile direct violet containing medium, all of the tested bacteria preferred to utilize the organic nitrogen source; therefore, the growth was significantly increased in the presence of the yeast extract and casamino acids as sole nitrogen sources (Table 4). In that context, it is well-known that azo dyes lack utilizable carbon, so adding sugars and organic N is often required for efficient degradation [31]. For example, supplying fructose raised methyl orange removal to ~90% by enhancing bacterial laccase output [32], and adding beef extract or NH₄NO₃ stimulated cell growth and enzyme synthesis to further improve degradation [33]. Likewise, our isolates achieved maximal decolorization only when glucose (as a C-source) and a trace‐element mix were present. These trends mirror the Streptomyces case, where sucrose and beef extract were needed for best decolorization, and agree with the general observation that extra C/N can supply reducing power (NADH) and cofactors needed for enzyme action [19].
Influence of Different Nitrogen Sources on the Functionality of the Enzyme
These results stress the importance of ammonium sulfate in the MSM for enzyme production and azo dye decolorization, especially when organic nitrogen sources replaced it; the decolorization, as well as the enzyme production, were dramatically decreased (Table 5). For this reason, the supplementation of MSM with an organic nitrogen source (in addition to ammonium sulfate) was investigated. There was no lignin peroxidase and laccase activity detected by the five tested bacteria grown in any of the three tested media with different nitrogen sources. The azoreductase was actively expressed by four bacteria grown in MSM supplemented with TMR, with the highest expression in B. brevis and B. subtilis in the presence of ammonium sulfate. The other organic nitrogen sources were significantly lower in azoreductase production. The Textile direct violet supplementation dramatically reduced the enzyme production. As Azoreductases are major enzymes that have been investigated for azo-dye decolorization [34]; thus, in the present study, B. subtilis and L. macrolides showed high azoreductase and decolorization activities. Among the investigated bacteria, B. subtilis is the only bacterium described as possessing azoreductase and laccases, according to the BRENDA enzyme database. However, few research articles are available for the azoreductase of Lysinibacillus sp. [35].
Table 5.
Impact of nitrogen source on the production of lignin peroxidase (Lip), laccase (Lac), and Azoreductase (AR) enzymes (U/ml) by bacteria cultivated in MSM supplemented with either TMR or Textile direct violet azo dyes.
Effect of Nitrogen Source Supplementation on Azo-Dye Decolorization, Biomass Accumulation, and Enzyme Production
In this experiment, the MSM was supplemented with either yeast extract or casamino acids in the presence of ammonium sulfate (the standard nitrogen source in this medium), as NH4OH is crucial for growth, biomass accumulation, and the expression of certain enzymes. The biomass, decolorization activity, and enzyme production were determined in these confined organic and inorganic nitrogen sources.
Effect of Nitrogen Source Supplementation on Decolorization Activity
In the Textile direct violet supplemented MSM, the highest decolorization percentage (74.6%) was obtained by B. subtilis, followed by (64.7%) by B. brevis in the presence of yeast extract (Table 6). L. macrolides showed its highest decolorization percentage (53.49%) in the absence of an organic nitrogen source. In comparison, this percentage was significantly decreased to 23.2% and 0.0%, respectively, with supplementation using either yeast extract or casamino acids. The TMR decolorization by B. coagulans was significantly increased from 14% in the presence of ammonium sulfate as a sole nitrogen source to 81.4% and 88.7% in the presence of either yeast extract or casamino acids supplementation, respectively. Additionally, L. macrolides and L. fusiformis species yielded similar results, with decolorization enhanced by yeast extract supplementation (Table 6). Where yeast extract supplementation significantly enhanced the TMR decolorization and B. coagulans biomass production, the decolorization activity of TMR by L. macrolides and L. fusiformis as well as the biomass production of all bacteria in the Textile direct violet containing MSM due to presence of the growth factors that can work as coenzymes or enhance the enzymes production [20, 36]. The variable effect of organic nitrogen source on the enzyme production among the tested bacteria can be attributed to the requirement of the tested bacteria for a specific growth factor (such as a vitamin or essential amino acid) to produce the enzyme or to grow faster, which will affect the decolorization process by either enzymatic decolorization, biomass adsorption or both. Therefore, some bacteria produce a specific enzyme in the presence of yeast extract supplementation, while others produce the same enzyme in the presence of casamino acid supplementation [26].
Effect of Nitrogen Source Supplementation on Biomass Production
In MSM containing Textile direct violet, the biomass production increased with supplementation with an organic nitrogen source with all tested bacteria, as compared with ammonium sulfate only. In the TMR supplemented medium, the casamino acids supplementation significantly enhanced the growth of B. brevis, B. coagulans, and L. fusiformis (Table 6).
Effect of Confined Nitrogen Source Supplementation on the Enzyme Production
In MSM supplemented with the Textile direct violet, the lignin peroxidase was absent in the presence of ammonium sulfate as a sole source of nitrogen. In contrast, when the medium was supplemented with casamino acids, it was produced by all of the tested bacteria. Supplementation of MSM with yeast extract significantly enhanced lignin peroxidase production compared to the casamino acids in most bacteria, except for L. fusiformis, which showed approximately similar production (23.4 and 26.8 U/mL, respectively) (Table 7). The presence of an organic nitrogen source can affect the decolorization activity of certain bacteria, which tend to utilize this organic compound as a carbon source rather than the azo dye [37]. Besides, the effect of microelement supplementation on decolorization, biomass, and bacterial enzyme production is dye and bacterial species-dependent. The regulatory effect of microelements on the enzyme function, as well as the azo-dye type, may require further investigations.
Table 6.
Impact of supplementation with organic nitrogen sources on biomass production and decolorization of azo dyes by bacteria cultivated in MSM supplemented with either TMR or textile direct violet azo dyes.
The laccase production by all tested bacteria was significantly enhanced in yeast extract and Textile Direct Violet-supplemented MSM compared with casamino acids. The L. fusiformis did not produce laccases in MSM supplemented with either ammonium sulfate or casamino acids as sole carbon sources (Table 7). This could be why the tested bacteria decolorized the Textile direct violet, although the lignin peroxidase was absent. The same trends were also noticed in the TMR supplemented medium, where the laccase was produced by three bacteria (B. coagulans, L. fusiformis, and B. subtilis) only in the yeast extract supplemented medium (Table 8). Growth factors (vitamins) in the yeast extract may be a significant enhancer for laccase production by all tested bacteria.
The highest azoreductase production (100.5 U/ml and 47.9 U/ml) was produced in the Textile direct violet supplemented medium inoculated with B. coagulans and B. brevis, respectively, in the presence of yeast extract. However, the addition of yeast extract to the MSM inhibited the production of azoreductase by B. subtilis. In the TMR-supplemented medium, B. coagulans also had the highest azoreductase-producing bacterium (169 U/ml) in the yeast extract-supplemented medium. Furthermore, the azoreductase of L. macrolides was produced only when the MSM was supplemented with either yeast extract or casamino acids (Table 7).
Impact of Varying Microelement Concentrations on Bacterial Decolorization of Azo Dyes, Biomass Accumulation, and Production of Enzymes
Influence of Microelements Levels on the Bacterial Azo Dye Removal
There was a significant difference in decolorization of both Textile direct violet and TMR azo dyes by the tested bacteria as affected by the microelements amendment in MSM; the only exception was the decolorization by L. fusiformis, which was significantly enhanced by the microelements solution concentration increase (Table 8).
Effect of Microelements Concentration on Biomass Production
In the MSM supplemented with TMR, L. fusiformis, B. subtilis, and B. brevis growth was not significantly affected by increasing microelements concentration. B. coagulans was the most affected bacterium, where the growth was significantly inhibited by the addition of 1 and 2 ml/L of the microelements solution. In the Textile direct violet supplemented MSM, L. fusiformis, showed a linear and significant increase in the biomass production with the increase in the microelements concentration. L. macrolides and B. coagulans were not affected by the increase in microelement concentrations (Table 8).
Table 7.
Impact of adding organic nitrogen sources on the production of lignin peroxidase (LIP), laccase (LAC), and Azoreductase (AR) enzymes (U/ml) by bacteria cultivated in MSM with supplementation of either TMR or textile direct violet azo dyes.
Effect of Microelement Concentrations on Enzyme Production
In the MSM supplemented by TMR, the lignin peroxidase production was significantly enhanced at 1 ml/L of microelements concentration by two bacteria (B. brevis and L. macrolides). The other bacteria were either not affected (B. subtilis) or inhibited (L. fusiformis and B. coagulans). In the Textile direct violet treatment, the lignin peroxidase production was significantly enhanced at 2 mL of microelements solution concentration by B. brevis and L macrolides, similar to the enhancement in TMR supplemented MSM (Table 9). This result reflects the enhancement effect of microelements on lignin peroxidase production by both B. brevis and L. macrolides. However, the optimum microelements concentration varies with the type of azo-dyes, where it was 1 ml/L in the TMR and 2 ml/L in the Textile direct violet supplemented MSM.
The laccase production in MSM supplemented with TMR by B. brevis and B. subtilis was significantly enhanced from 0 U/ml to 0.11 and 0.19 U/ml, respectively, at a microelements solution concentration of 2 ml/L. On the other hand, the laccase production by L. macrolides was significantly inhibited with an increase in the microelement concentration (3 ml/L) (Table 9). The other bacteria were not affected. In the Textile direct violet-supplemented MSM, the laccase production by two bacteria (B. coagulans and B. brevis) was significantly enhanced at 1ml/L of microelements concentration. On the other hand, the laccase production by B. subtilis was significantly enhanced by a 3 ml/L microelement concentration. In contrast, the laccase of L. fusiformis was significantly inhibited with an increase in microelement concentration (Table 9). The effect of microelement concentration on laccases production is affected by the azo dye type and the bacterial species.
In the MSM supplemented with TMR, the azoreductase production was enhanced by two bacteria (B. subtilis and L. fusiformis) at microelement concentration 1 ml/L, while it was enhanced at 2 ml/L by B. coagulans. On the other hand, the azoreductase production was inhibited by both L. macrolides and B. brevis with the increase in the microelements solution concentration. In the Textile direct violet supplemented MSM, the azoreductase was significantly enhanced in both B. subtilis and B. coagulans at microelements solution concentration 1 ml/L, while it was enhanced in L. macrolides and B. brevis at microelements concentration 2 ml/L, and in L. fusiformis at 3 ml/L (Table 9).
Table 8.
Impact of the concentration of microelement solution on bacterial biomass and decolorization of azo dyes by bacteria cultivated in MSM with supplementation of either textile methyl red or textile direct violet azo dyes.
Future Research Directions
Looking ahead, future research could explore advanced strain design utilizing CRISPR technology to enhance the expression of key genes, such as azoreductase, laccase, and peroxidase. In addition, engineered multi-species consortia and immobilized biofilms are anticipated to synergistically degrade complex dyes with improved stability. Simultaneously, photocatalysis research has been making significant strides by exploring visible-light TiO₂ and hybrid semiconductors, effectively harnessing solar energy. Moreover, bioelectrochemical systems, like microbial fuel cells, have achieved nearly 90% decolorization of dyes while simultaneously generating electricity. Importantly, socioeconomic drivers have highlighted the need to utilize low-cost, environmentally friendly materials to improve effluent quality. Collectively, these innovations aim to seamlessly integrate engineered microbes with advanced technologies, thereby paving the way for efficient azo-dye treatment that complies with regulations.
Conclusions
Azo dyes are considered harmful substances to the ecological environment and human health. As related regulations become more stringent, more effective treatment techniques are urgently needed. Therefore, the current study has investigated the application of different ecological bacterial isolates for their physicochemical implications on the biodegradation ability of azo dyes. Such microbial strains have shown diverse implications for various factors of Azo dyes, including their decolorizing ability following the addition of supplementary nitrogen and carbon sources. Furthermore, different microorganisms decolorized via different enzyme abilities. While novel biological strategies are currently being improved to eliminate azo dyes, more efficient protocols, such as using them in constructing membrane bioreactors and other bioreactors, could lead to more significant observations. Although the current identified isolates could be applied in the field due to their high bioremediation potential against pollutants like azo dyes, they may have a bright future in the ecological field.
Table 9.
Impact of the concentration of microelements solution on the production of lignin peroxidase (LIP), laccase (LAC), and Azoreductase (AR) enzymes (U/ml) by bacteria cultivated in MSM with supplementation of either textile methyl red or textile direct violet azo dyes.

