

Introduction
Agronomic characteristics such as plant height, biomass as a whole, yield index, number of productive tillers, spike length, number of grains per spike, weight of grains per spike, and 1000-grain weight are the main factors that influence wheat production [1]. Increased wheat production has been attributed to physiological features such as water-soluble polysaccharides, photosynthetic rate, canopy temperature, and chlorophyll content [2-5]. Moreover, it was also proposed that a genetic increase in crop output may be easily attained if many traits indicating improved physiological and agronomic performance and stress tolerance were combined into a single variety [6].
It is considered that salinity is the main factor contributing to soil degradation. Around twenty percent of cultivable land has been moved to salinity-affected areas thus far, making up nearly 6.5 percent of the world's total land area [7]. Furthermore, soil is deemed saline if its electric conductivity is 4D s m-1 and its osmotic pressure is 0.2 MPa, which causes plants to succumb to chlorosis and necrosis [8]. Plant roots are the first organs to sense salinity stress, which inhibits plant growth in the short and long term. A reduced water supply has an immediate impact on plants, causing osmotic stress. However, long-term consequences lead to a surplus of plant stress, which causes an ionic imbalance [9]. Reactive oxygen species (ROS) are also produced due to these ions' disruption of the energy flow in photosynthetic systems [10]. Malondialdehyde (MDA) is created when ROS interacts with membrane lipids, which disrupts the cell membrane [11]. Plants employ various strategies to mitigate the effects of salinity stress, the most significant of which is the build-up of toxic ions, such as Na+, in shoots through various mechanisms. These mechanisms include blocking ion uptake and transport to shoots through the production of osmolytes, such as proline or trehalose, depending on whether or not enzyme antioxidants are involved. Antioxidant enzymes found in plants, such as catalase (CAT) and superoxide dismutase (SOD), have unique defense mechanisms against reactive oxygen species. These antioxidant enzymes guard against O2- and H2O2 damage [12]. It is now known that abiotic pressure causes a range of morphological, physio-biochemical, and molecular changes in plants during their growth and production [13]. These changes impact seedling metabolism, germination event dispersion, reduced growth of seedlings, and delayed germination [14]. Trehalose serves as an osmoprotectant. This non-reducing disaccharide enhances salt stress tolerance by preserving osmotic balance and metabolic homeostasis [15]. Because of its non-reducing characteristics and chemically unreactive solubility, it is regarded as a beneficial solute or osmoprotectant even at high concentrations [16]. This chemical can scavenge reactive oxygen species (ROS) that impair regular metabolic processes during growth and development, protecting the machinery involved in plant protein synthesis [17]. Additionally, controls the expression of genes and signaling pathways linked to detoxification and the stress response [18, 19]. Under stressful situations, it takes the shape of an amorphous glass structure and shields plants from abiotic stresses, such as dehydration, and helps them regain their ability to perform their intended tasks once normal, non-stressful environmental conditions are restored [20].
Trehalose has the extra benefit of being an antioxidant and signaling chemical. It also functions as a stress-responsive gene element during detoxification [21]. Nevertheless, most plants do not produce enough Tre to counteract the harmful effects of abiotic stress. On the other hand, by raising the internal concentration of these osmolytes, external Tre administration has been suggested as a possible means of generating stress tolerance [22]. Tre was applied exogenously to mitigate a variety of abiotic stimuli, such as heat, water shortage, salinity, and drought in maize and wheat [23]. Increasing osmoprotectant molecules, including glucose, trehalose, proline, and free amino acids, is an osmoprotectant that can assist wheat plants in tolerating salinity stress[24]. The findings are expected to provide valuable insights for developing wheat varieties that can thrive in saline environments, thereby contributing to sustainable agriculture in regions affected by soil salinity.
Material and Methods
Plant Material and Experimental Design
The current research utilized ten wheat genotypes, namely: (1) NIA Amber-10, (2) Bhatoor, (3) Bhittai, (4) Borloug-16, (5) DN-11, (6) DN-84, (7) Punjab-11, (8) TJ- 83, (9) Zamindar-04, and (10) Zincol-16. In the quest to understand the resilience and adaptability of wheat under various stress conditions, a comprehensive experiment was initiated in the departmental screen house during the 2019-2020 period. This study, set against a clay loam soil backdrop, employed a meticulous split-plot design with three replications to investigate the effects of different treatments on wheat planted on the 20th of November 2019. A total of 180 pots were used in the experiment, each measuring approximately 15 cm in width and 20 cm in length, with 12-15 plants per pot. The treatments, pivotal to the research, were administered on the 45th and 60th day post-sowing, delineating into a control group that received normal watering, a salinity group subjected to 150 mM NaCl, and trehalose treatments at concentrations of 10- and 50-mM. These interventions aimed to elucidate their impact on various agronomic attributes of wheat, which were meticulously recorded following leaf collection on the 75th day after sowing.
Plant Traits and Statistical Results
Plant height was measured using a ruler across ten randomly selected plants. The length of the spike and the number of spikelets were determined from ten randomly chosen spikes per replication. The grain number is counted from five selected spikes. The weight of 1000 grains was calculated from five randomly selected spikes. Duncan's Multiple Range Test (DMRT), facilitated by the statistical software SPSS version 16, further explored these differences among means. The total protein content was then estimated using a BSA standard curve. Peroxidase activity was assessed with slight modifications to the [25] method, involving phosphate buffer preparation, guaiacol, and hydrogen peroxide solutions. The reaction mixture's absorbance was recorded at 470 nm, providing insights into peroxidase levels within the wheat leaves. Catalase estimation followed [26] methodology, focusing on the reaction between plant sample extracts and hydrogen peroxide in a potassium phosphate buffer. The reduction in optical density was monitored at 240 nm, offering a glimpse into catalase activity under different treatment conditions. Proline content was determined following [27] involving sulfosalicylic acid for sample preparation and a subsequent reaction with acetic acid and ninhydrin solution. The absorbance measured at 520 nm against a proline standard curve elucidated proline levels within the samples. Trehalose quantification was adeptly performed with minor modifications to [28] involving ethanol extraction, hydrolysis steps, and anthrone solution for color development. Absorbance readings at 630 nm facilitated the calculation of trehalose concentration. Lastly, lipid peroxidation was estimated by measuring malondialdehyde (MDA) content using the [29] method. This involved trichloroacetic acid (TCA) and thiobarbituric acid (TBA) in TCA for sample processing, with absorbance measurements at 600 nm and 532 nm revealing insights into lipid peroxidation levels.
Extraction of Genomic DNA
Seeds were sown in Petri plates, and the first leaf was harvested for DNA extraction on the seventh day. Genomic DNA was extracted from wheat leaves using the Thermo Scientific GeneJET DNA purification kit. A 0.1 g leaf sample was homogenized in liquid nitrogen, mixed with 350 µL of Lysis Buffer A, and vortexed. After adding 20 µL of RNase A and 50 µL of Lysis Buffer B, the mixture was vortexed and incubated at 65°C for 10 minutes. 130 µL of Precipitation Solution was added, followed by ice incubation and centrifugation. The supernatant was transferred to a new tube, mixed with DNA binding solution and ethanol, and placed in a spin column. The column was washed twice, and DNA was eluted with Elution Buffer. The extracted DNA was stored at -20°C.
Results and Discussion
Agronomic Traits
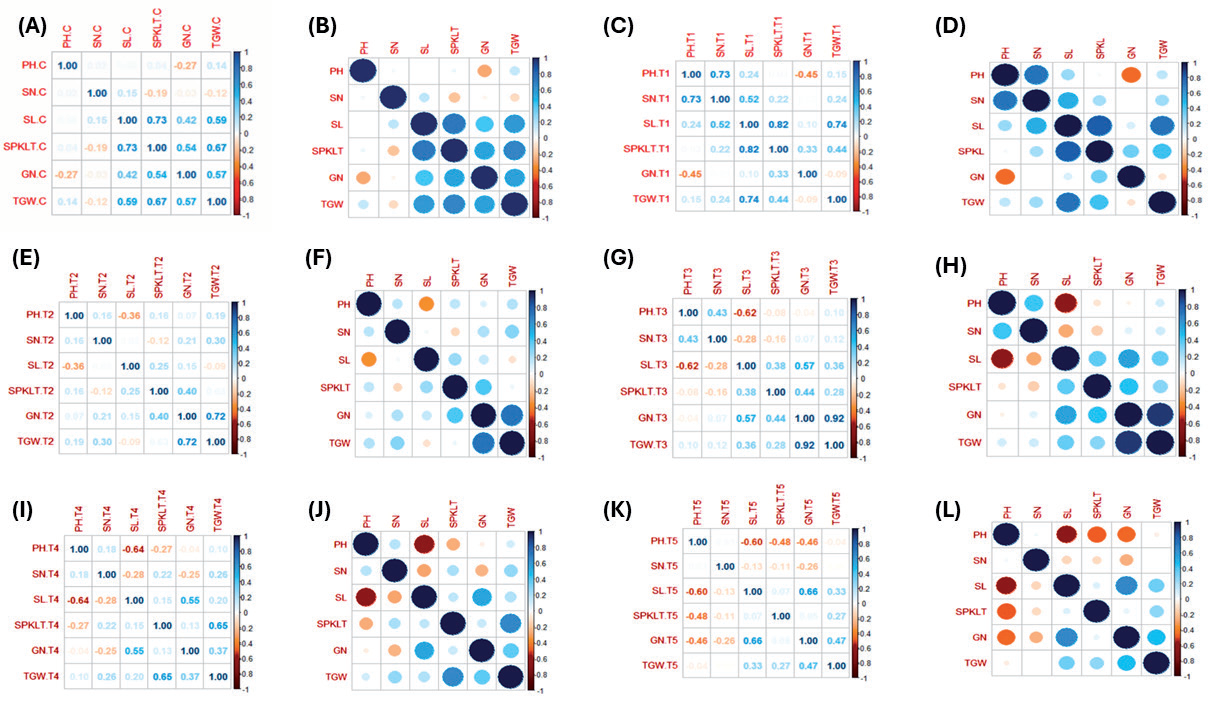
Data on PH, SN, SL, SPKLT, GN, and TGW were collected for Trehalose treatment groups (10 and 50 mM) and control conditions (150 mM NaCl). The analysis of variance (ANOVA) was carried out with SPSS software (Table 1). The data were presented to show potential variations between groups, and the means were compared using Duncan's Multiple Range Test (DMRT). Table S1 highlights significant variations in plant height, spike number, spike length, spikelet number, grain number, and thousand-grain weight among different wheat treatments. Control group plants averaged 57 cm in height, with Punjab-11 being the tallest (62 cm) and TJ-83 the shortest (53 cm). Under salt stress, plant height decreased by 23% on average. Foliar spraying with trehalose increased plant height, with the highest improvement at 50 mM trehalose (Fig. 1). Spike numbers varied, with a control average of 12, and decreased by 23% under 150 mM NaCl. Trehalose treatments increased spike counts, with the highest increase at 50 mM. Spike length was reduced by salinity but improved with trehalose, reaching a maximum of 14.5 cm in TJ- 83 under 50 mM trehalose. Spikelet numbers dropped by 23% under salt stress but increased with trehalose treatments, achieving the highest number in Bhatoor (Supplementary Table S1). Grain numbers, crucial for yield, decreased by 34% under salt stress but increased with trehalose. Bhittai had the highest grain count at 50 mM trehalose. Thousand-grain weight decreased by 28% under salt stress but increased significantly with trehalose treatments, reaching 45g in Bhittai at 50 mM trehalose. Trehalose mitigated the negative effects of NaCl across all measured parameters. The salinity stress reduced wheat spike numbers by an average of 23%, with the most significant decrease observed in the Bhatoor variety. This reduction is attributed to salinity's disruption of plant biochemical processes. [30] supports these findings, indicating salinity's detrimental effects on wheat and barley yield parameters. However, applying Trehalose mitigated salinity's negative effects, increasing spike numbers by 10% and 23% with 10 mM and 50 mM treatments, respectively. This positive response to Trehalose aligns with its observed benefits in maize under salt stress [31]. Despite a 5% reduction in spikes with 10 mM Trehalose under salinity, a 50 mM dose led to a 2% increase, echoing [32] on Trehalose's effectiveness in improving wheat resilience to abiotic stress. Salinity stress significantly reduced spike length in wheat by 20%, impacting productivity due to shorter spikes and fewer grains. However, Trehalose treatment improved spike length, with a 17% increase observed at 50 mM concentration. This improvement is attributed to Trehalose's stress-alleviating properties, enhancing plant growth and yield. [33, 34] also highlight salinity's negative effects on growth and Trehalose's role in maintaining cell turgor and protecting plants under stress. Both 10 mM and 50 mM Trehalose treatments effectively countered salinity's impact, with reduced spike length decreases of 11% and 6%, respectively. Trehalose's effectiveness in enhancing growth under stress conditions is further supported by research on Brassica species [35], emphasizing its role in stress mitigation and biomass production. Trehalose treatments showed positive associations between grain number and weight, with Bhittai and DN-84 identified as high-yielding varieties. Genotypes with high mean productivity values were deemed stress-tolerant, in line with prior studies. Trehalose application increased protein content, particularly in Zincol-16, stabilizing enzymes and enhancing stress resilience. The study explored oxidative stress markers, with trehalose effectively mitigating salt-induced enzyme activity.
Fig 1.
(A-B) agronomic traits under control condition, (C-D) agronomic traits under NaCl treatment, (E-F) wheat varieties under 10 mM Trehalose, (G-H) agronomic traits under 50 mM Trehalose, (I-J) agronomic traits under 10 mM Trehalose and 150 mM NaCl, and (K-L) wheat varieties under 50 mM Trehalose and 150 mM NaCl.
Correlation Coefficient
Correlation coefficient analysis revealed significant relationships among various plant traits under different conditions. In normal settings (Fig. 1A-B), spike length correlated positively with spikelet number (0.425**) and 1000-grain weight (0.405*). Under salt stress (Fig. 1C-D), spike length showed strong positive correlations with spikelet number (0.688***) and 1000-grain weight (0.689***), while plant height was negatively correlated with grain number (-0.411**). In the presence of 10 mM trehalose (Fig. 1E-F), plant height negatively correlated with spike number (-0.554**), and under 50 mM trehalose (Fig. 1G-H), grain number exhibited positive correlations with spike length (0.459**) and 1000-grain weight (0.880***). Combined stress conditions (Fig. 1I-J) showed positive correlations between grain number and spike length (0.403*), and strong correlations of 1000-grain weight with spikelet number (0.568***), while spike length was negatively correlated with plant height (-0.461**). In NaCl with 50 mM trehalose (Fig. 1K-L), spike length and 1000-grain weight were positively correlated with grain number (0.418**, 0.442**), whereas plant height showed a negative correlation with spikelet number (-0.420**). These findings highlight the intricate interplay of traits under stress and the potential role of trehalose in modulating these relationships for enhanced crop productivity.
Tolerance Indices
In the study, Mean Productivity (MP) (Table S1) varied significantly across treatments: under saline stress, DN-84 and Bhittai exhibited the highest values of 48, followed closely by Punjab-11 and Zincol-16 with 45. With 10 mM Trehalose, Bhittai showed the highest MP of 57, while under 50 mM Trehalose, Bhittai again excelled with a maximum of 67, followed by DN-84 (61) and Zamindar-04 (64). The combined effect showed Bhittai reaching an MP of 50. Under 50 mM Trehalose with 150 mM NaCl, Bhittai led with an MP of 52, followed closely by Zincol-16 and DN-84 with 50 (Fig. 2A). Regarding Yield Stability Index (YSI), DN-11 and Borloug-16 demonstrated the highest (Table S1) values under 10 mM Trehalose (1.15 and 1.14, respectively), while DN-11 and Zamindar-04 achieved the peak YSI of 1.29 with 50 mM Trehalose. DN-11 also exhibited a YSI of 1.00 under 50 mM Trehalose with 150 mM NaCl (Fig. 2B). Stress Susceptible Index (SSI) values indicated that TJ-83 and Zincol-16 were more susceptible (SSI values of 1.59 and 1.57, respectively), whereas DN-84 and DN- 11 showed the highest tolerance (SSI values of 0.56 and 0.66, respectively) under saline stress. After treatment with 50 mM Trehalose, Zamindar-04 led with an SSI of 1.30, followed by DN-11, Borloug-16, and Bhittai (all at 1.24) (Fig. 2C). Yield Index (YI) highlighted (Table S1) DN-84 as the top performer (YI of 1.26), with Bhittai leading under 50 mM Trehalose (YI of 1.18). These indices collectively underscore Bhittai and DN-84 as robust performers in terms of stress tolerance and yield stability across various stress and treatment conditions in wheat cultivation (Fig. 2D).
Mean Productivity (MP) under various conditions: control, 10 mM Trehalose, 50 mM Trehalose, and 50 mM Trehalose with 150 mM NaCl (2a). Yield Stability Index (YSI) under control, 10 mM Trehalose, 50 mM Trehalose, and 50 mM Trehalose with 150 mM NaCl (2b). Stress Susceptibility Index (SSI) under saline stress, 10 mM Trehalose, and 50 mM Trehalose (2c). Yield Index (YI) under control, 10 mM Trehalose, 50 mM Trehalose, and 50 mM Trehalose with 150 mM NaCl (2d).
Formula:
1. Yield Stability Index (YSI) =
Ys: Yield under stress conditions, Yp: Yield under non-stress conditions
2. Yield Index (YI) =
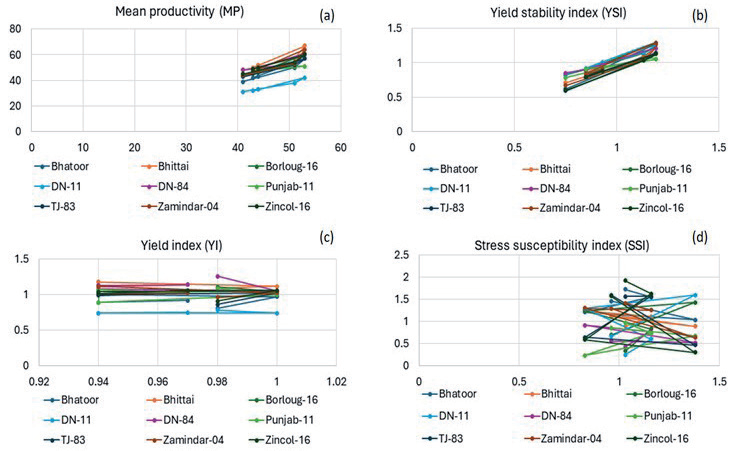
Table 1.
Mean squares for agronomic traits, biochemical traits of tested wheat varieties under irrigated, control and treatment conditions.
Ys: Yield under stress conditions, Ys': Mean yield of all genotypes under stress conditions
3. Mean Productivity (MP) =
Yp: Yield under non-stress conditions Ys: Yield under-stress conditions
4. Stress Susceptibility Index (SSI) =
Ys: Yield under stress conditions, Yp: Yield under non-stress conditions, Ys': Mean yield of all genotypes under stress conditions, Yp': Mean yield of all genotypes under non-stress conditions
Physiological Responses and Antioxidant Enzyme Activities
The mean squares analysis revealed significant main effects and interactions for total protein concentrations across wheat genotypes (Table 1). The average total protein content was 142 µg, with Zincol-16 exhibiting the highest (172 µg) and Zamindar-04 the lowest (119 µg) levels. Salt stress significantly decreased total protein content by 18% on average, with NIA Amber-10 showing the highest (156 µg) and Borloug-16 the lowest (73 µg) concentrations under stress conditions. Trehalose treatments (10 mM and 50 mM) increased the total protein content by 18% and 25%, respectively, with Zincol-16 showing the highest increase (209 µg) under 50 mM trehalose. Antioxidant enzymes such as peroxidase (POX) and catalase (CAT) were also assessed. POX activity was highest in Zincol-16 (0.511 mg protein-1 per 8 minutes) and lowest in Zamindar-04 (0.265 mg protein-1 per 8 minutes), increasing by up to 151% under salt stress. CAT activity averaged 5.02 mg protein-1 per minute, with Zamnidar-04 recording the highest (6.55 mg protein-1 per minute) and Bhatoor the lowest (3.81 mg protein-1 per minute) activity levels. Proline accumulation under stress conditions varied, with significant increases observed, particularly in Zamindar-04 (3.21 µg/mL) under 150 mM NaCl stress. Trehalose treatments reduced proline accumulation, mitigating oxidative damage (Supplementary Table S1). Trehalose levels increased significantly under saline stress, with DN-84 showing the highest (0.822 nmol / gram fresh weight) and Bhittai the lowest (0.537 nmol / gram fresh weight) levels. MDA content, a marker of lipid peroxidation, increased under salt stress but decreased with trehalose treatments, with significant effects observed. Zincol-16 showed the highest MDA increase (2.89 nmol / gram fresh weight) under 50 mM trehalose, while Borloug-16 showed the lowest (0.60 nmol / gram fresh weight).
Conclusion
This study demonstrated that NaCl treatment altered agronomic and biochemical traits in wheat genotypes, with Zamindar-04 excelling in plant height and minimal peroxidase activity, DN-84 showing resilience in spikelet number and TGW with low lipid peroxidation, and Bhittai exhibiting high spikelet number and membrane permeability despite low trehalose sugar levels. Trehalose treatment mitigated salt stress effects by enhancing cell metabolism and preserving membrane integrity, although oxidative damage indicators like MDA and proline increased under stress. Tolerant genotypes like NIA Amber-10, Borloug-16, and DN-84 showed reduced stress markers. Exogenous trehalose was absorbed without disrupting normal plant functions, regulating enzymatic activities effectively. Further research is needed to optimize trehalose's potential in enhancing wheat stress tolerance and crop productivity.

