

Introduction
The global economy depends on the maritime sector, which transports people, goods, and services across international borders. Ports, defined as frontier markets, play a vital role in worldwide development. They are seen as the powerhouse of the economic, social, and environmental development of a given country [1]. They, however, contribute significantly to climate change by producing large carbon emissions. Although ports connect, promote, and support global trade networks and enhance global economic growth, environmental issues, such as the emission of harmful greenhouse gases, mainly carbon dioxide (CO2), challenge port managers in facilitating efficient port services and using their unique position given by nature [2].
In recent years, the “green port concept” has become increasingly important in meeting this challenge. This concept has been developed and operated to enhance environmental sustainability and reduce carbon emissions. Green ports play a critical role in combating climate change. First and foremost, they contribute to mitigating the maritime sector’s total carbon impact. Green ports could drastically lower greenhouse gas emissions from port operations through the implementation of renewable energy sources and cold ironing, the promotion of sustainable methods, and the adoption of energy-efficient equipment. In addition, the maritime sector, in general, could benefit from this concept. Green ports have the potential to inspire maritime investors and other ports to implement comparable strategies by demonstrating the advantages of sustainable methods.
The application of energy-efficient technology is a crucial component of green ports. Investing in energy-efficient equipment, including hybrid systems, electric cars, and LED lights, can minimize carbon emissions and reduce energy consumption at ports. Port innovation contributes to a greener and more sustainable port environment while reducing operating costs. Green ports not only focus on energy efficiency but also on embracing renewable energy sources. Furthermore, renewable energy sources like turbines, solar panels, etc., can provide a clean, sustainable source of energy for ports’ operations. This enables sustainable development of the port and its surroundings while reducing dependence on fossil fuels. Additionally, green ports encourage sustainable strategies throughout the port environment. These strategies include the preservation of biodiversity, efforts to conserve water, and waste management. Many scholars have highlighted several important aspects of these issues in the literature on green ports and carbon reduction. Various strategies, including cold ironing, low-temperature steam, and fuel consumption control, can considerably reduce emissions [3]. [4] states that by creating substitute energy sources for coal, the principal source of CO2 emissions, it is feasible to supply the energy demand of a country while simultaneously reducing CO2 emissions.
The growing frequency of severe weather events, one of the climate change issues, has also pushed port authorities throughout the world to take initiatives such as the 2030 reduction plan adopted by the government of Canada, which focuses on lowering emissions from maritime activities and enhancing port infrastructure resilience. To reduce emissions from each sector, the 2030 plan focuses on an evergreen roadmap reflecting the level of ambition in each sector. Africa’s poor ability to adapt makes it one of the continent’s most vulnerable to the consequences of climate change, even though it contributes 10% of the world’s greenhouse gas emissions.
The green port concept has become essential to implementing the 2030 Emissions Reduction Plan successfully. During the global economic crisis of 2008, the sustainability concept became more pronounced, creating a heavy reliance on oil consumption and leaving a heavy carbon footprint. Therefore, UNCTAD has recognized the urgent need to develop sustainable green ports as an important policy [5]. At all business locations within the port, green growth focuses on innovation to reduce carbon emissions [6]. By embracing the green movement, port authorities can maximize ports’ energy efficiency. In literature, the green concept introduced three aspects of port operation, namely environmental protection, energy conservation, and environmental care [7]. To achieve sustainable growth and development of port systems and port areas, the question may be how to find a difference between environmental impacts and economic interests. The green port development concept includes the integration of environmentally friendly methods of port management, activities, and operations. The different ways to define measures to establish the ecological green port include the reduction of the carbon footprints by implementing policies, fabrication and installation of equipment for sustainable energy generation, recycling and reuse of materials, planning for green growth, and strategic landscape planning to plant trees and greens to absorb the carbon emissions [8]. A lot of popular ports globally are now adopting this concept, including the Port of Rotterdam, the Port of Hamburg, the Port of Los Angeles, the Port of Shanghai, the Port of Shenzhen, etc. These ports demonstrate how the “green port” idea may be efficiently applied in a fast-rising economy, resulting in considerable emissions reductions and establishing a model for other ports across the globe to follow. Their initiatives show that environmental sustainability and economic growth are compatible, in addition to aiding in the worldwide battle against climate change.
Various ports face sustainable challenges, as their environments, capacities, geographical locations, etc., differ, confined to their maritime activities, in-port operations, and in-land transportation. The requirements and implementation of technology for measuring and reducing carbon footprints, as well as the requirements and implementation of projects related to increasing the potential of ports without compromising environmental safety, are also challenges for going green in a port [9]. Important environmental aspects observed in seaports include port development, resource consumption, changes in marine ecosystems, dredging disposal and waste generation, noise, discharges to water, and air emissions [10]. In [11], the author reviewed papers using the AHP Fuzzy method. The method has been used in some Taiwanese ports to help port organizations select priority attributes of the green port operation, i.e., a sustainable port concept that minimizes environmental pollution. As a main measure for implementing the concept of “green port” development, it is crucial to include the concept of “green” growth in the further development of the port systems and to implement environmental planning. Although African ports are still struggling to implement this “going green” strategy, Mombasa Port in Kenya is doing its best to implement it. To transform Mombasa Port into the first “clean fuel” port in Africa, the green port policy (GPP) was launched by the Kenya Ports Authority (KPA) with financial and technical assistance from the TradeMark East Africa (TMEA) organization [12]. The goal of the KPA, through the implementation of the GPP, is to enhance and obtain better performance standards for the benefit of all areas under its control, including the Mombasa Port Community [13]. GPP aims to alleviate environmental degradation through a sustainable approach. This involves the disposal of asbestos roofing and a requirement that all ships calling at the Mombasa Port switch off their engines. According to an article titled “The Green Port Policy at Mombasa Port Protects and Restores Local Ecosystems”, Mombasa Port will no longer accept ships with diesel engines. Instead, all ships entering will have to switch to electric power. This program will serve as a roadmap for further assessments of the port operations’ total environmental impacts and emissions levels, as well as for developing frameworks that adhere to global standards. Due to this development within Mombasa Port, this paper tends to investigate or forecast the impact of the green port strategy using the grey prediction model GM (1, 1) as it will help to emphasize the importance of green ports to other countries.
The GM (1, 1) grey prediction model is used to obtain very powerful predictions. For tiny data volumes, the grey prediction model is a useful technique for resolving the “little data, little information” issue. The grey prediction model has the following qualities: it can accurately anticipate the evolution trend of the data even when the data is unclear; it can adjust as well as make use of a large number of data samples; it has a good short-term prediction effect; and it is easy to use. Grey prediction is therefore frequently employed in many different sectors [14-19]. For instance, Typhoon MORAKOT’s path was forecasted using the GM (1, 1) forecasting approach, as demonstrated by the authors in [20]. In [21], the authors employed the GM (1, 1) model to forecast the primary energy consumption and output as well as the production of electricity, using Heilongjiang province as a case study. To prevent an energy deficit, it was determined that the development of alternative energy sources should begin as soon as feasible. A grey-GM (1, 1) model approach was presented by the authors in [22] to forecast a company’s energy usage. The outcomes demonstrate that the forecasting accuracy of the grey-GM (1, 1) model is higher. Utilizing the GM (1, 1) model, [23] projected China’s natural gas consumption for the next few years, and the results show that natural gas use will keep rising. [24] forecast Nigeria’s natural gas consumption using the Modified Grey Model (MGM). According to the findings, the MGM model provides a prediction interval with the actual value enclosed in parenthesis. Studies have also been carried out by the KPA to modernize the port by developing the infrastructure, renovating the warehouse, and improving the access road, etc., at both the port of Kisumu and the port of Shimoni. The accuracy of the original grey model, and consequently the accuracy of the prediction of energy consumption, is demonstrated by the findings of the Grouped Grey Model (GGM (1, 1)) that the authors proposed in [25] for modeling medium-term forecasting of electricity consumption in Kenya.
This paper’s remaining sections are arranged as follows: in Materials and Methods section, the data source, Mombasa Port, and its implemented GPP strategies are described. The GM (1, 1) grey forecasting model construction is also presented. Data from 2009 to 2022 were split and used to predict Mombasa Port’s CO2 emissions for the next 18 years using Microsoft Excel version 2016 software. This section further displayed the model processing calculation using one sample data (i.e., 2009 to 2015). In the following section the prediction results and discussion are described. In the final section conclusion is presented.
Material and Methods
Data Source
For this study, the China Stock Market & Accounting Research (CSMAR) statistical database, the KPA’s environmental reports and publications, and the port’s official website were used to collect Mombasa Port’s CO2 emissions from 2009 to 2022 (as shown in Table 1). Then, the GM (1, 1) model was used to make accurate and reliable predictions of Mombasa Port’s CO2 emissions between 2023-2040, based on two sets of data: pre-GPP implementation (i.e., before implementation 2009-2015) and post-GPP implementation (i.e., after implementation 2016-2022). This two-step analysis enables a comparative analysis of emissions trends before and after the implementation of green port initiatives by the KPA.
Table 1.
Mombasa Port’s CO2 emissions raw data from 2009 to 2022.
| Years | CO2 emissions (tons) |
|---|---|
| 2009 | 40710.6 |
| 2010 | 34513.24 |
| 2011 | 38987.95 |
| 2012 | 43282.38 |
| 2013 | 44911.98 |
| 2014 | 37034.79 |
| 2015 | 42320.74 |
| 2016 | 43832.34 |
| 2017 | 37768.05 |
| 2018 | 40287.28 |
| 2019 | 35193.7 |
| 2020 | 28606.67 |
| 2021 | 35611.33 |
| 2022 | 36138.58 |
The GM (1, 1) model is used to evaluate CO2 emissions data from the period before the GPP (2009-2015) implementation to forecast future emissions for 2023-2040. In the period before the implementation of the policy, Mombasa Port experienced considerable industrial expansion and increased port activity, which contributed to the increase in CO2 emissions. The first stage provides an initial basis for understanding emissions trends without focused environmental initiatives. The second data set, from 2016 to 2022, covers the period after the KPA approves the green port strategy. This strategy includes a series of actions aimed at lowering the port’s carbon footprint, including using energy-efficient technologies, promoting renewable energy sources, and applying stricter environmental rules. Using the GM (1, 1) model to this data, we can forecast emissions from 2023 to 2040 and assess the efficiency of sustainability initiatives. The primary data sources, the acquisition period, the data formats, and the processing methods applied to guarantee the precision and coherence of the data throughout the study are all displayed in Table 2.
Table 2.
Data Description.
Study Site: a Case of Mombasa Port
In Kenya, there are nine main ports in the nation, and the majority of them are being restored and enlarged to match international standards. These ports include the ports of Mombasa, Reitz, Lamu, Kilifi, Mtwapa, Shimoni, Malindi, Kiunga, and Kisumu. On the other hand, Mombasa is the biggest and busiest port in Kenya and all of East Africa. Additionally, it is the one endorsing green port management practices. The government and the KPA are in charge of running, maintaining, and modernizing the nation’s ports. As early as the 18th century, Mombasa Port is one of Africa’s oldest harbors [26].
Mombasa is a coastal city in southeastern Kenya along the Indian Ocean. The Mombasa Port, located along the Kenyan coastline, serves a large hinterland of 250 million people from Northern Eastern Democratic, South Sudan, Uganda, Tanzania, Rwanda, Somalia, Kenya, Burundi, and the Republic of Congo. It is managed by KPA, a state-owned company that aims to facilitate and improve maritime trade by providing competitive services. The Mombasa container terminal and the Kipevu container terminal represent the port’s two container terminals.
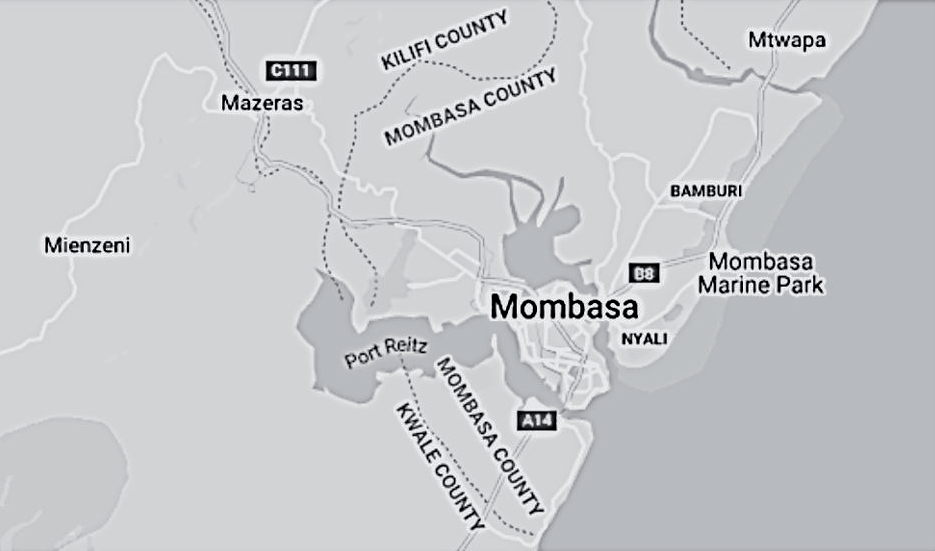
During the last decade, the port registered significant growth in the volumes of transportation, with an increase in container traffic by 9.3% and the annual cargo throughput by 6.9% [27]. The overview of the Mombasa Port is presented in Fig. 1. Mombasa Port introduced a comprehensive GPP project and implementation plan in 2015, intending to reduce negative externalities associated with port operations. The policy recommends, among others, the reduction of air emissions through the adoption of sustainable energy and the provision of shore power to ships calling at the port [28]. With the use of this cutting-edge technology, vessels may now connect to a renewable energy source while they are moored, greatly lowering their need for fossil fuels and the associated harmful emissions. Mombasa Port authorities hope to reduce the port’s carbon footprint and open the door to a more sustainable and greener future by implementing these eco-friendly initiatives.
In 2015, Mombasa Port developed and published its sustainability strategy for implementing the green port concept, linking economic, ecological, and social aspects, thereby reducing carbon footprints and improving social infrastructure. TMEA supported KPA’s efforts to green the Mombasa Port through its Mombasa Port Resilient Infrastructure Programme (MRIP) to improve the port’s environmental and social conditions. Thanks to the multipronged program financed by the UK’s DFID (Department for International Development), the port has been able to mitigate and adapt to the impacts of climate change.
To reduce carbon emissions, the KPA provides ships docking at Mombasa Port with shore power as part of its GPP project [29]. In 2012, a study on the monetary and ecological benefits of using solar energy in Mombasa Port was conducted. It showed possible net gains for the port authority, but the author has not analyzed the financial implications the technology would have on ship owners required to make the necessary modifications to their vessels [30]. With the assistance of TMEA, the project involves supplying electrical power to ships calling at the harbor in operation known as “cold ironing”. KPA, in hosting MTCC-Africa, adopted a green port policy, and Mombasa Port was used for the pilot project of cold ironing of ships berthing in the port to reduce ship emissions [31]. The KPA has installed power substations in the harbor berths. The following are the tactics used by the KPA to establish the green port in the Mombasa Port [32].
Green Port Policy Strategies Adopted at the Mombasa Port
Going green is a trend in seaports all over the world, and environmental management has become critical in port operations. Green port planning requires the acquisition and implementation of improved technology for designing energy-efficient systems (technological innovation, innovations in equipment) to ensure sustainable economic development and environmental protection [8]. The GPP implemented by the KPA has 10 components that aim to improve environmental conservation by improving the quality of water, air, soil, and environmental habitats, protecting people from harmful substances, and reducing carbon emissions [29]. The GPP establishes zones of reduced ship speed, alternative maritime power technology, and emission control areas, particularly reducing exhaust emissions in ports, along with other benefits like fuel consumption [33]. The application of carbon emissions policy into port competition analysis can promote green transportation and sustainable development realization. Improving transportation environments is also of great practical importance [34].
Tools, Technologies, and Measures for a Green port at Mombasa Port
The discussion of defining green ports has evolved from discussing relatively narrow measures like waste management to a broader mainstream measure like management protocols over the years. In recent years, the attention on the debate has considerably shifted from narrow areas such as water quality, noise reduction, or waste management to the area of broader integration tools such as management protocols, etc. A three-category discussion is currently being held, namely: technical infrastructures, pricing and access, and environmental management approach.
Technical Infrastructures
As a first step, several technical infrastructures have been proposed at Mombasa Port [35], to deal with specific issues, such as ship waste, energy efficiency, and air quality. – Cold ironing:
A cold ironing system or onshore power supply uses land and ship technology to provide electricity to ships, using tertiary sources like wind, water, and solar energy. During berthing, it provides ships with electrical power from the shore to meet their hoteling needs, allowing them to turn off their auxiliary engines [36]. The ships turned off their diesel engine power generators after receiving this onshore power supply [37]. This significantly reduces greenhouse gas emissions at ports [38], thus helping to reduce carbon emissions [39]. In 2023, the ABL Group published a study in PV magazine titled “ABL assesses solar-powered cold ironing at Mombasa Port” that looked into the viability of setting up a solar photovoltaic (PV) plant to generate renewable energy for shore power, or “cold ironing”, at Mombasa Port. The study revealed that: “Cold ironing can significantly reduce local heavy fuel oil combustion, leading to improved local air quality”, according to Aimee Besant, Head of Energy Storage at ABL Group, who commented on the findings [40]. It also highlights the potential benefits when combined with energy storage solutions like hydrogen or lithium batteries. – Waste reception infrastructure:
Maritime waste and pollution are crucial environmental problems. Hence, the provision of a port reception facility is identified as a green port measure [41]. The port’s waste reception facility collects oily sludge, waste produced on board, and all other forms of waste from the ship. A project was carried out with financing from TradeMark East Africa as part of the “Mombasa Resilient Infrastructure Programme” to audit port and vessel waste management onboard vessels and during port operations. The port administration has established a waste treatment facility and purchased energy-efficient mobile harbor cranes as part of the same initiative [42]. – Cargo handling and transport:
These measures include replacing or converting transporters, hybrid vehicles, trailers, tractors and forklifts, and cranes that use diesel fuels with vehicles that use biofuels or are powered by electricity generated from sustainable sources. At Mombasa Port, cargo throughput increased to 35.98 metric tons, an impressive 6.2% increase. This boost is a result of a notable increase in containerized freight, which accounted for over half of the cargo handled at the port and showed an impressive leap of 14.8%. According to a report on the Kenyan news website “TUKO.co.ke” in November 2022, 15 electric buses arrived in Mombasa and were cleared by customs at Mombasa Port [43]. This development has contributed to the country’s aim to completely switch to clean energy. – Greenhouse gas emission inventory:
This tool enables a structured inventory of carbon emissions generated by the use of energy and fuels to be drawn up and monitored and identifies areas where reductions can be made, improving green energy consumption and port operations [44]. To mitigate the impact of emissions from port operations, Kenya’s government has encouraged investment in resource-efficient and sustainable green development initiatives that use renewable energy sources and reduce greenhouse gas emissions at Mombasa Port. Kenya is a pioneer in the use of geothermal energy, as seen by projects like the Olkaria Geothermal Development Company project [45], which produces more than 500 MW of clean electricity from geothermal sources [46], and the Lake Turkana Wind Power project, which is a wind farm that produces 310 MW of clean energy [47].
Pricing and Access
Secondly, several pricing and access tools have been proposed, mainly focusing on ship access and shipping companies to port terminals [48], as well as companies operating in the port. – Environmental Shipping Index (ESI):
The ESI is an internet-based tool that offers incentives to ships that emit fewer greenhouse gases, while ship owners are invited to submit their fuel receipts to verify the original fuel use [49]. The evolution of the approach to environmental issues during the years 1996-2022 is presented in the Environmental Report (ESPO 2022), which has been published on the EcoPorts website 3. By increasing the use of sustainable energy sources and implementing digital solutions, the European port sector can continue to lead the way in sustainable practices. According to the EcoPorts survey study, air quality is the top priority [50]. At the same time, noise and energy consumption at ports outweigh other environmental concerns such as port development, climate change, water quality, and community relations. – Concession agreements:
In [51], the authors state that “environmental sustainability is becoming a requirement for granting concessions to companies that want to operate in the port. The concession agreement can be used as a tool to address a range of issues, from waste production and energy consumption to emissions reduction. They, therefore, suggest that where port authorities impose, for example, a cap on CO2 emissions as part of terminal concession agreements, this can encourage terminal operators to embrace innovation and meet the port authority’s environmental objectives. – Port Dues:
This is an approach adopted by the port authorities, which involves the use of penalty pricing as the ‘stick’ or incentives pricing to improve environmental performance and reduce pollution by port developers and users [52]. The port authorities impose surcharges on mooring fees and fines for oil and waste spills. The objective of this tool is, therefore, to facilitate the protection, conservation, and efficient use of resources and promote sustainability by using punitive or incentive measures in the form of port fees or taxes [53].
Environment Management Approach
In addition, several tools can be considered as integrated management approaches. Environmental management systems (EMS) based on internationally recognized environmental management standards have been promoted as priority tools for green ports [54]. Port authorities will be able to prepare a plan that details the legal requirements that regulate their operations, their mitigating programs and initiatives, their environmental policy objectives, and the environmental aspects of their operations [55]. Therefore, to manage their environmental programs for pollution prevention, protection, and control, this tool represents a systematic plan for port authorities. The Eco-Management and Audit Scheme (EMAS), the Ports Environmental Review System (PERS) of ESPOS’s Eco Ports network, and ISO 14001 EMS are used by ports to guide systematic and effective environmental management.
To summarize, the KPA, guided by the GPP and the data collected from the fuel consumption and emission data collection and reporting pilot project, came up with some energy-efficient initiatives to ensure the port operations are effective and sustainable. This includes: – Installation of a solar power plant with a combined
capacity of over 1 Mega Watts supplied to the power
grid; – Retrofitting high-consuming power lights with LED
lamps that produce less carbon; – Installation of efficient air conditioners that use less
energy; – Tad boats that are shore power ready; – Use of rubber-tired gantry cranes that use less diesel
fuel during operation.
The results achieved after the implementation of the GPP program by the KPA include the following: – Development of Resilient Infrastructure at Mombasa
Port – Infrastructure Improvement through the
acquisition of 6 Eco Hoppers and 4 Mobile Harbor
Cranes, – Rehabilitation of the Conveyor System to Reduce
Dust and Cargo Wastage from Soda Ash (Sodium
Bicarbonate) Handling, – Mitigating Business Continuity / Labor Productivity, – Developing a Strategy to Facilitate Green Logistics
and Catalyzing the Modal Shift from Road to Rail
Freight, – Replacement of Asbestos Roofing materials with
Galvanized Roofing sheets in KPA Workshops, – Tree Planting and Forestry, – Feasibility Study on Port and Ship Waste
Management at Mombasa Port, – Bio-Terra Phasing of Hill Sides at Mombasa Port, – Enhancement of the energy performance and
development of sustainable energy power sources at
Mombasa Port.
The GPP initiatives impact the forecasted CO2 emissions by promoting greener logistics practices, reducing fossil fuel dependence, and increasing the efficiency of port operations. Based on these initiatives and the historical data collected, i.e., before and after implementation, the GM (1, 1) grey forecast model is used to predict future CO2 emissions, showing how the port’s CO2 production may alter after the implementation. To anticipate CO2 emissions at Mombasa Port, this paper provides a grey forecasting model. This model is perfect for estimating CO2 emissions at Mombasa Port since it is especially good at predicting trends based on tiny datasets with insufficient data. This study applies the model to a two-time series of emissions data, including 2009-2015 (before the implementation of GPP) and 2016-2022 (after the implementation of GPP). The model forecasts future CO2 emissions trends from 2023 to 2040 using these historical datasets. This model could help port authorities implement effective energy conservation strategies in the port to promote the “green port concept”, guide the development of government policies regarding energy supply and demand, and serve as a reference for future research on renewable energy technologies and alternative energy sources that are necessary to lower CO2 emissions at Mombasa Port. Based on the availability of data and achievements made through the successful implementation of the GPP Program by the KPA within Mombasa Port, this paper aims to forecast Mombasa Port’s CO2 emissions from 2023 to 2040.
Predicting Mombasa Port’s CO2 emissions is crucial, especially as we approach the start of a new decade. In evaluating the GPP’s effectiveness and determining the course of the port’s environmental impact for the ensuing 18 years, this prediction is an essential resource. Future CO2 emissions predictions provide stakeholders with important information about how well-performing the sustainability initiatives in place are doing. Informed decision-making is also made possible by this prediction, which gives port authorities the ability to put specific plans into action that support long-term environmental objectives.
GM (1, 1) Grey Forecast Model
Model Construction
GM (1, 1) is a common model used to forecast tiny data sets. This model uses a system of first-order differential equations to forecast a time series.
Grey forecasting methodology is examined in detail in this section. It is possible to forecast time series using this model. It consists of three fundamental operations: accumulated generation, inverse accumulated generation, and grey modeling. The grey forecasting model uses cumulative generating operations to build differential equations. GM (1, 1) grey prediction is widely used when the data are scarce. The following is the forecasting method based on the GM (1, 1) model:
In the first step, the actual data observation yields the original numerical sequences x(0):
In step two, x(1), the first-order accumulated generating operation is acquired:
Where,
In step three, the GM (1, 1) model is established by obtaining a first-order grey differential Equation:
Where: a and u are the parameters estimated for the forecasting model;
In step four, the least squares approach is used to calculate the parameters a and u:
Where,
The approximation equation is obtained by replacing the difference equation in Equation (4) with Equation (6).
Where, x̂ (1)(k + 1) = x(1)(k + 1) forecast value at t = k+1. x(0)(k+1) ’s restored function is provided by:
(9)
The first-order inverse-accumulated generated operation sequence is obtained when x̂ (1)(1) = x(0)(1). Therefore, the sequence has to be reduced as in Equation (10) to get:
Where, k = 1, 2, ..., n.
The reduction sequence is as follows:
Where, x̂ (0)(n + 1) = the basic grey predictive value of x(n + 1).
Model Accuracy Evaluation
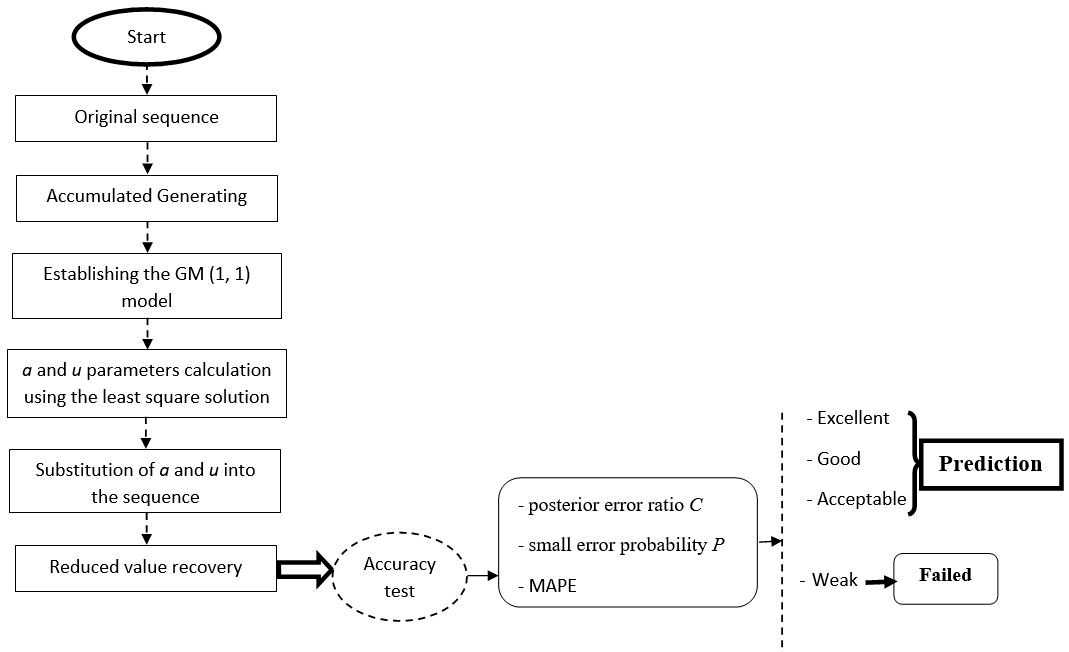
The posterior error analysis is a standard procedure for assessing the grey model. The posterior error ratio C and small error probability P are computed to categorize the accuracy of the GM (1, 1) models through Equation (12) and (13).
S1 = raw data mean square deviation; S2 = predicted data mean square deviation; x̅ = raw data mean value; y̅ = predicted data mean value.
The GM (1, 1) model accuracy is classified as follows: – the accuracy level is good when: C 〈 0.35, and P 〉 0.95; – the accuracy level is qualified when: 0.35 〈 C 〈 0.50, and 0.95 〈 P 〈 0.80; – the accuracy level is poorly qualified when: 0.50 〈 C 〈 0.65, and 0.80 〈 P 〈 0.70; – the accuracy level is not qualified when: C 〉 0.65, and P 〈 0.70.
Furthermore, the model performance is measured using the mean absolute percentage error (MAPE). Its Equations are as follows:
Where: r = raw data; r̂ i = predicted data; n = observation data.
Based on the MAPE value, the accuracy of the GM (1, 1) model is categorized as follows: – the accuracy level is excellent when: MAPE (%)<10; – the accuracy level is good when: 10<MAPE (%)<20; – the accuracy level is acceptable when: 20<MAPE
(%)<50; – the accuracy level is weak when: MAPE (%)>50.
The different steps of this model are presented in Fig. 2.
Mombasa Port CO2 Emission Forecasting Empirical Procedures
This paper used CO2 emissions data from Mombasa Port between 2009 and 2022. The time frame has been split into two datasets so that the emissions trends before and after the GPP initiatives were implemented may be compared.
To assess the effect of GPP initiatives on emissions reduction, the data was further divided into “2009-2015, i.e., before the implementation of the GPP” and “2016-2022, i.e., after the implementation of the GPP”. The specific indicators of the CO2 forecasting model for Mombasa Port are as follows. – The model’s main dependent variable is CO2
emissions (in metric tons). This represents the
overall emissions from Mombasa Port’s operations
and is a key indicator of environmental impact. – Before and after GPP implementation: to evaluate
the effects of GPP initiatives within the port, the
dataset is split into two periods. An essential measure
of the policy’s efficiency in lowering emissions is
the variation in emissions trends between these
two time periods. These indicators are useful for
understanding how green policies have influenced
emission trends and how they are expected to evolve
over the next 18 years.
The model’s parameters: In this study, to achieve reliable predictions using the GM (1, 1) model, its parameters must be carefully adjusted. Firstly, the model is initialized using the first data point in the time series (CO2 emissions in 2009). Then, the model smoothes the data using a cumulative generating operation, converting the original series “x(0)” into a cumulative series to decrease unpredictability and assure reliable predictions. Finally, the grey differential equation is developed to suit the cumulative series. The prediction parameters, “a” (i.e., development coefficient) and “u” (i.e., grey control variable), are computed using the least squares approach. The coefficient “a” represents the change in emissions, whereas coefficient “u” highlights the intrinsic characteristics and consequences of control (for example, the impact of GPP initiatives). These criteria are necessary to provide accurate predictions. The accuracy of the model was categorized by first calculating the posterior error ratio C and the small error probability P. In addition, the accuracy was verified by calculating the MAPE for the period 2009-2022. This guarantees the reliability of the model’s forecasts for the period 2023-2040. The model’s modeling procedure, using one set of sample data, is shown below.
GM (1, 1) Construction Procedure Using the “Before Implementation” Data: 2009 to 2015
A prediction of CO2 emissions between 2023 and 2040 is generated using data on CO2 emissions from 2009 to 2015. The following process was applied to build our GM (1, 1) model.
From Equation (1), input the original numerical sequences x(0):
From Equation (2), the first-order accumulated generating operation x(1) is obtained:
The matrix B and the constant vector Y are given:
The parameters a, and u from Equation (6) are obtained:
From Equation (8), the forecasted model below is obtained:
Mombasa Port’s CO2 emissions between 2009 and 2015 were estimated to be 40710.6, 37831.3818, 38739.7210, 39669.8697, 40622.3514, 41597.7025, and 42596.4719 tons, respectively. By substituting k = 1, …, 7 into equations 10 and 15, these values were found, yielding the following reduction sequence:
As in the previous section, the model construction procedure using “after implementation” (i.e. 2016-2022) data is similar, so it will not be repeated here.
Assumption: Accordingly, the predictive value for 2040 based on the 2009-2015 data should be greater than that based on the 2016-2022 data.
Results and Discussion
Mombasa Port’s CO2 Emissions Data Results Analysis
The original data on Mombasa Port’s CO2 emissions from 2009 to 2022 are shown in Table 1, and Fig. 3 displays the trends of Mombasa Port’s original and predicted CO2 emissions data from 2009 to 2015, while Fig. 4 shows the trends of Mombasa Port’s original and predicted CO2 emissions data from 2016 to 2022.
Analysis of Changes and Trends in CO2 Emissions at Mombasa Port
Fig. 3 shows the annual trends of the original CO2 emissions data for Mombasa Port from 2009 to 2015. The graph shows a fluctuation in emission levels over this period. Between 2009 and 2011, the port’s annual CO2 emissions decreased from 40710.6 to 38987.95 tons. This initial decrease suggests a positive step towards reducing carbon emissions. However, between 2012 and 2013, there was a notable increase, from 43282.38 to 44911.98 tons. This increase indicates that stepping up efforts to control emissions may be necessary. The emission levels further decreased in 2014, reaching 37034.79 tons. This suggests that efforts made in previous years have reduced the port’s environmental impact. However, in 2015, emission levels experienced an increase, reaching 42320.74 tons. The variations show the KPA’s difficulties in efficiently controlling and lowering carbon emissions in the port. The Port Authority (KPA) and environmental organizations have chosen to adopt targeted methods, such as “going green,” to lessen Mombasa Port’s negative environmental effects and secure a sustainable future. This decision was made after observing these patterns over time.
However, Fig. 4 below shows the annual trends in Mombasa Port’s original CO2 emissions data from 2016 to 2022. From 2016 to 2017, the port experienced a decrease in emissions from 43832.34 to 37768.05 tons, followed by a marginal increase to 40287.28 tons in 2018. From 2019 to 2020, the port recorded a decrease from 35193.7 to 28606.67 tons. However, from 2021 to 2022, emissions increased, with a final value of 36138.58 tons. Comparing the average values of the original data, it is noticeable that the average value, 40251.67 tons, for CO2 emissions from 2009 to 2015 is higher than the average value, 36776.85 tons, for CO2 emissions from 2016 to 2022. This highlights the significant difference in the value of CO2 emissions between “before implementation” and “after implementation”. This will motivate other ports in Africa to embrace the green idea.
Forecast Results of CO2 Emissions Using the GM (1, 1) Grey Forecast Model
Based on the GM (1, 1) grey forecasting model, CO2 emissions data for the Mombasa Port from 2009 to 2015 and 2016 to 2022 were used separately to forecast the port’s CO2 emissions for the next 18 years. The findings are displayed in Table 3, which illustrates Mombasa Port’s CO2 emissions (tons) along with the original, predicted, and relative error values. Table 4 shows the results of CO2 emission forecasts for Mombasa Port from 2023 to 2040, based on data from 2009 to 2015 and 2016 to 2022, using the GM grey prediction model (1, 1).
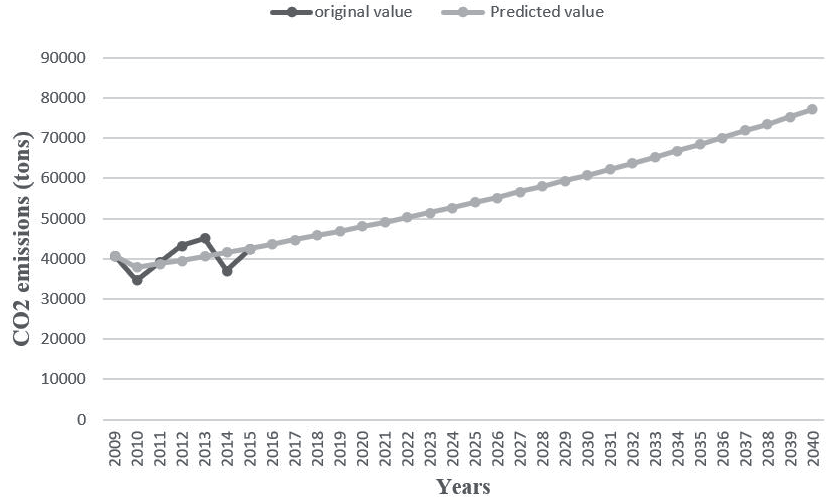
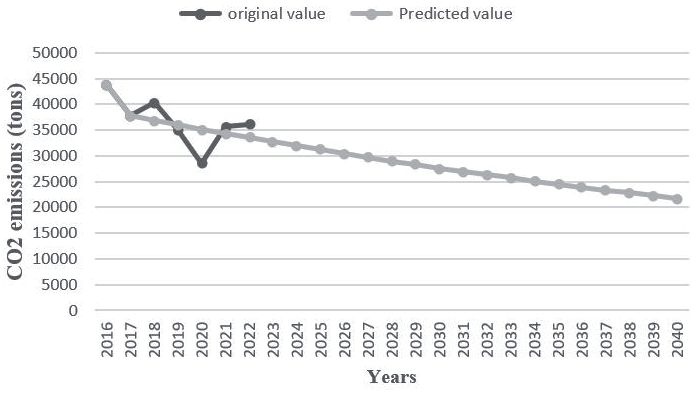
Table 3 displays Mombasa Port’s CO2 emissions (tons): the original, the predicted, and the relative error values. The predicted values and the relative errors of the GM (1,1) model are simultaneously determined using the original data, as indicated in Table 3. It shows that the model has a high degree of predictive validity. The average relative error of GM (1, 1) for the years 2009-2015 and 2016-2022, respectively, is 5.87% and 6.37%, less than 10%. Consequently, it is a practical method of predicting CO2 emissions. In addition, the posterior error ratio C, and the small error probability P values of GM (1, 1) for the years 2009-2015 are 0.0323 and 1.1, and for the years 2016-2022 are 0.0368 and 1.1, showing a great accuracy level of CO2 emissions for this period. These findings also indicate that the GM (1, 1) model, with low MAPE values [56] of the years 2009-2015 and 2016-2022 are 5.89% and 6.37%, respectively, for Mombasa Port’s CO2 emissions, successfully predicting the original value.
Table 4 shows the GM (1, 1) model forecasts for each set of data from 2023 to 2040. From the first set, i.e., “before implementation” 2009 to 2015, it can be seen that by 2040, Mombasa Port’s CO2 emission is projected to be 77086.931 tons. On the other hand, from the second set, i.e., “after implementation” from 2016 to 2022, it can be seen that by 2040, Mombasa Port’s CO2 emission is projected to be 21733.621 tons. Our first hypothesis ‒ that is, that the CO2 emission predicted value for 2040 based on data from the years 2016-2022 must be less than that of 2040 based on data from the years 2009-2022 ‒ is supported by these results.
Discussion
This projected increase in emissions using 2009-2015 data represents a significant challenge to Mombasa Port authorities’ efforts to combat climate change and achieve its sustainable development goals. However, the decrease in the projected value of CO2 emissions using 2016-2022 data reveals the positive impact of the “green concept” implementation.
To meet the port’s sustainable development objectives and comply with climate change mitigation methods, Mombasa Port authorities face a major obstacle in the form of the expected rise in emissions based on data from 2009 to 2015. This time frame most likely represents the port’s explosive expansion in the industrial and logistical sectors, which has increased CO2 emissions despite being vital to the economy.
More comprehensive, long-term sustainability strategies are required to lessen the carbon footprint of port operations since the rise in emissions emphasizes how difficult it is to strike a balance between environmental management and economic growth. On the other hand, a more optimistic scenario with lower estimated CO2 emissions is presented by the 2016-2022 data. This decrease shows how Mombasa Port has benefited from the green port concept (GPP implementation). By taking some successful steps to cut emissions and switch to cleaner energy sources, the KPA has shown that it is capable of tackling climate change and that it is committed to doing so.
Important programs, including implementing cleaner technology for cargo handling and transportation, increasing energy efficiency in port operations, and investing in infrastructure for renewable energy, have all helped to lower total emissions over this time. These results highlight the effectiveness of implementing strategies to reduce CO2 emissions within Mombasa Port and its potential impacts on the port.
Table 3.
Mombasa Port’s CO2 emissions (tons): the original value, the predicted value, and the relative error.
The reduction in emissions is an indicator of the effectiveness of policies and strategic plans to minimize the impact on the environment. Reducing dependence on fossil fuels has been greatly facilitated by the KPA’s use of renewable energy sources, like wind and solar power, and the introduction of energy-efficient machines. Furthermore, the implementation of environmentally friendly logistics techniques, including supply chain route optimization, the use of cleaner buses, and traffic reduction (congestion), shows how ports can promote environmental change whilst preserving their operational efficiency. Mombasa Port’s implementation of these initiatives provides insightful information to other ports dealing with similar issues. Green procedures may reduce ports’ carbon footprints and increase their resilience to climate change.
As renewable energy and green technologies are used more frequently, the GPP initiatives should have a long-term positive impact on emissions reduction. In other African ports, Mombasa Port’s success is an inspiration. The adoption of comparable green policies throughout the region might have a substantial cumulative effect on international efforts to tackle climate change. In addition, the investment in cleaner technologies could attract more environmentally mindful businesses, opening up new opportunities to grow the economy sustainably.
Table 4.
Forecast CO2 emissions in Mombasa Port from 2023 to 2040 based on data from 2009 to 2015 and 2016 to 2022.
Although GPP initiatives have proved effective to date, the challenges of sustaining these reductions need to be considered. Further investment in modernized infrastructure and a workforce skilled in the use of new technologies will be essential to maintain progress. The GPP initiatives have had a significant positive effect on emissions reduction in Mombasa Port, along with long-term economic and environmental benefits. Mombasa Port has become a pioneer in green port strategies in the region as a result of this shift to a more environmentally friendly operation, inspiring other African ports to follow suit.
To sum up, Mombasa Port’s GPP initiative is a good idea from KPA when it comes to sustainability, aiming to reduce gas emissions by implementing sustainable practices such as using renewable energy sources, improving waste management systems, and promoting environmentally friendly transport methods. This initiative will not only contribute to global efforts to combat climate change but will also enhance the overall environmental sustainability of the port and its surroundings.
Conclusions
In general, the more Africa opens its doors to foreign investment on all fronts, the more it will need to safeguard itself against the myriad fallout. The concept of “going green” must be treated with seriousness, particularly in light of the digitization initiatives undertaken by some African governments. CO2 emissions must be carefully controlled since they are the primary driver of climate change. Additionally, as the largest port in East Africa and the one that prioritizes the full implementation of the concept of “going green” both inside the port and across the region, it is imperative to address the various issues on emissions within Mombasa Port.
In this study, CO2 emissions from Mombasa Port are predicted using the grey forecast model GM (1, 1) since the model can deal with incomplete and uncertain data. The GM (1, 1) model is used to predict the port’s CO2 emission for the next 18 years, i.e., from 2023 to 2040, using data from the years 2009 to 2022. The data were separated into two sets, i.e., 2009-2015 categorizing the “before implementation” and 2016-2022 categorizing the “after implementation”. This was done to point out how effective the “green port policy” adopted by the port authorities is. Furthermore, the low MAPE values of the years 2009-2015 and 2016-2022, 5.89% and 6.37%, respectively, for Mombasa Port’s CO2 emissions, demonstrate the effectiveness of the GM (1, 1) model for predicting original data for the period 2009-2022. The results show that by 2040, the predicted CO2 emission for Mombasa Port is 77,086.931 tons based on data from 2009-2015 and 21,733.621 tons based on data from 2016-2022, confirming the assumption that the “after implementation” predicted emission is lower than the one of “before implementation”.
The KPA has implemented the GPP at the Mombasa Port to improve and attain the highest environmental performance standards to benefit the port community and all other areas under its management. Port authorities understand the importance of adopting a possible mix of measures to counteract the major challenges of imposing regulations, fiscal policies, pressing environmental issues, etc. It is clear from the results that sustainability is the only option in the long term for the economic stability of the port. Therefore, the results of this study’s GM (1, 1) grey forecasting model will motivate port managers to take more initiatives to reduce emissions from port sectors. This reduction in gas emissions can be achieved through some initiatives, including investing in renewable energy sources, optimizing port operations to minimize fuel consumption, and implementing sustainable transport practices in the port. These measures will not only help to mitigate climate change but also promote a cleaner and healthier environment for the local community. Furthermore, the results of this study can be contrasted with the application of other prediction techniques, and it can serve as an inspiration for future research into evaluating the sustainability of African ports.
This study used the standard GM (1, 1) grey forecast model, which has certain limitations. The study is also focused on CO2 emissions, given the availability of port data. However, we recognize the importance of considering port emissions beyond CO2 emissions. Therefore, in our future research, emissions from various energy sources, such as coal, oil, and natural gas, will be considered. In addition, we will take a closer look at the optimization of the standard grey forecasting model. Although the standard model has provided valuable information for our analysis, we recognize that there is room for improvement. By refining the model, we aim to improve our forecasting capabilities and produce more accurate and predictive results. By integrating port emissions other than carbon dioxide and optimizing the grey forecasting model, we aim to increase the scope and accuracy of our research. These improvements will give us a better understanding of port emissions and their implications for environmental management and policy-making.

