


Introduction
Pelabuhanratu Bay, located on the southern coast of Java, is the largest bay in the region, spanning approximately 105 km of coastline. This bay represents a dynamic coastal environment shaped by interactions between terrestrial and marine systems, making it a key area for studying sediment transport and water quality [1]. As an estuarine system, it receives freshwater input from multiple rivers while being influenced by oceanographic processes, including waves, tides, and monsoonal winds. Additionally, industrial activities, including a coal-fired power plant and a shipping port, contribute to the presence of total suspended solids (TSS) through both natural and anthropogenic processes [2, 3]. Despite its ecological and economic importance, limited empirical evidence exists on seasonal TSS dynamics in tropical monsoonal estuaries, including in Indonesia, creating a notable research gap in understanding sediment and water quality processes under seasonal climatic influences [4].
TSS consists of organic and inorganic particles suspended in the water column, affecting water clarity, light penetration, and aquatic productivity. These particles originate from natural sources, such as riverine discharge, precipitation, and wave action, as well as from human activities, including urbanization, industrial waste, and sediment resuspension from maritime operations [5, 6]. River discharge plays a significant role in determining TSS levels by transporting eroded soil and sediments from upstream areas, particularly during periods of heavy rainfall [7, 8]. While sediment transport has been widely studied in temperate estuaries, such as the Yangtze, Mekong, and Mississippi [9, 10], few studies have focused on how seasonal precipitation and hydrodynamics interact to influence TSS variability in small-to-medium tropical bays. This highlights a gap in understanding the mechanisms driving sediment fluxes in monsoon-dominated climatic systems [11, 12].
Hydrodynamic forces, such as monsoonal currents, tidal exchange, and coastal wave action, significantly influence the redistribution and resuspension of TSS [13]. For example, the southwest monsoon drives upwelling and coastal mixing, whereas the northeast monsoon enhances the offshore transport of suspended material [14, 15]. Tidal variability also contributes to sediment dynamics, with spring tides increasing sediment mobility, while neap tides promote sediment deposition [16, 17]. However, studies that integrate these multiple factors ‒ precipitation, tides, and currents ‒ in a unified seasonal analysis remain limited, particularly in Indonesian contexts [18, 19].
Elevated TSS concentrations can severely impact coastal and marine ecosystems by increasing turbidity, reducing light penetration, smothering benthic habitats, and transporting contaminants such as heavy metals and persistent organic pollutants [20-25]. These ecological impacts have not been systematically linked to upstream climatic and hydrodynamic forcing in previous studies of Pelabuhanratu Bay, highlighting a novel dimension of this study [26, 27].
Recent advances in satellite remote sensing have improved the ability to assess TSS distribution over time and space. Techniques such as those using Landsat 8, MODIS, and Sentinel-2 enable high-resolution monitoring of suspended sediments in coastal waters [3, 6, 28, 29]. Coupled with in-situ validation, these methods provide robust tools for understanding how precipitation patterns influence sediment concentration. Still, long-term seasonal analyses of TSS variability using remote sensing in Indonesia remain scarce, especially in regions such as Pelabuhanratu Bay [30-33].
This study addresses that gap by examining the influence of seasonal precipitation on TSS concentrations in Pelabuhanratu Bay, utilizing satellite-based monitoring, in situ data, and hydrological analysis. The originality of this work lies in its integration of climatic (rainfall), hydrodynamic (currents and tides), and remote sensing data to assess sediment variability in a monsoon-influenced coastal system [5]. Findings from this research provide empirical support for sustainable marine spatial planning and water quality management in Indonesia's rapidly developing coastal zones.
This study also contributes to the broader field of sustainability research. For instance, systemic development programs, such as China’s National Civilized City designation, have demonstrated that environmental and economic outcomes can be simultaneously enhanced through improved urban governance, branding, and green infrastructure [34]. Similarly, targeted spatial strategies in cross-border e-commerce zones have been linked to regional growth disparities, especially favoring coastal cities over inland regions [35]. Furthermore, environmental regulation has been shown to have a nonlinear effect on technological complexity in high-tech industries, emphasizing the importance of calibrated policy in achieving sustainability and innovation goals [36].
Table 1.
Specification of the data.
Materials and Methods
Research Area
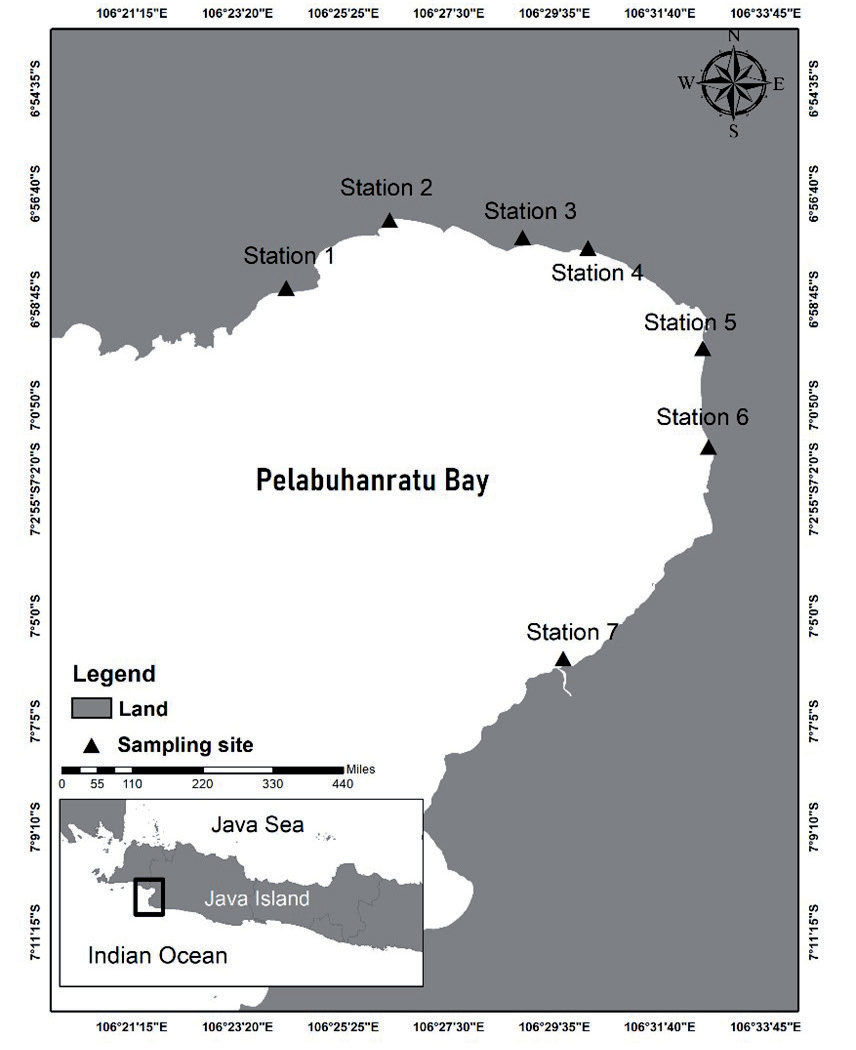
The research area is located in the waters of Pelabuhanratu Bay, with coordinates ranging from 105°53'26.22" E to 106°23'52.09" E and from 6°50'22.84" S to 7°21'36.89" S. The research area utilizes data from seven stations, each representing a river mouth in Pelabuhanratu Bay (Fig. 1). The concentration measurements were obtained at seven sites by establishing a latitude-longitude grid for precise point identification. Values were recorded every 5 seconds at each grid interval in the x and y directions. At each station, four points were recorded at intervals corresponding to the length of the established grid.
Data Collection
The data covers the timeframe from March 2015 to January 2019, spanning a total of 58 months. This includes TSS and precipitation information. The monthly precipitation data were acquired from the Meteorology, Climatology, and Geophysics Agency of the Republic of Indonesia (Table 1).
Data Processing
Image Data Processing
The acquired image data was analyzed using ErMapper software, utilizing the stack layer technique to amalgamate distinct data layers with 11 bands of satellite images. The region is then defined according to the research area, leading to a decrease in the image data size. The demarcation of land and sea, or masking, is executed to assign a value of 0 to clouds and terrestrial areas, hence streamlining the calculation of suspended solid concentration using channel comparison interpolation. The employed Equation:
Where: i2 = band 5, i1 = band 2, i3 = band 2.
Transformation of Satellite Image Values into TSS Concentration
The corrected LANDSAT 8 image data is then processed using an algorithm developed by the National Institute of Aeronautics and Space to obtain the TSS concentration value. The algorithm utilizes bands 2, 3, and 4 to create a regression model that combines both in situ data and satellite data. The formulation of the algorithm is based on the Syarif Mahakam algorithm.
Where: Y = TSS concentration, i1 = Reflectance band 2, band 3, and band 4.
Data Analysis
Spatial and temporal analysis was conducted on the distribution of TSS based on seasonal variation. The seasons in Indonesia consist of four seasons: the northwest season (December-February), the first transitional season (March-May), the southeast season (June-August), and the second transitional season (September-November). Spatial information, including the direction and distribution of TSS, as well as in situ data from seven sites, will then be correlated with seasonal precipitation patterns.
Results and Discussion
Precipitation Variation
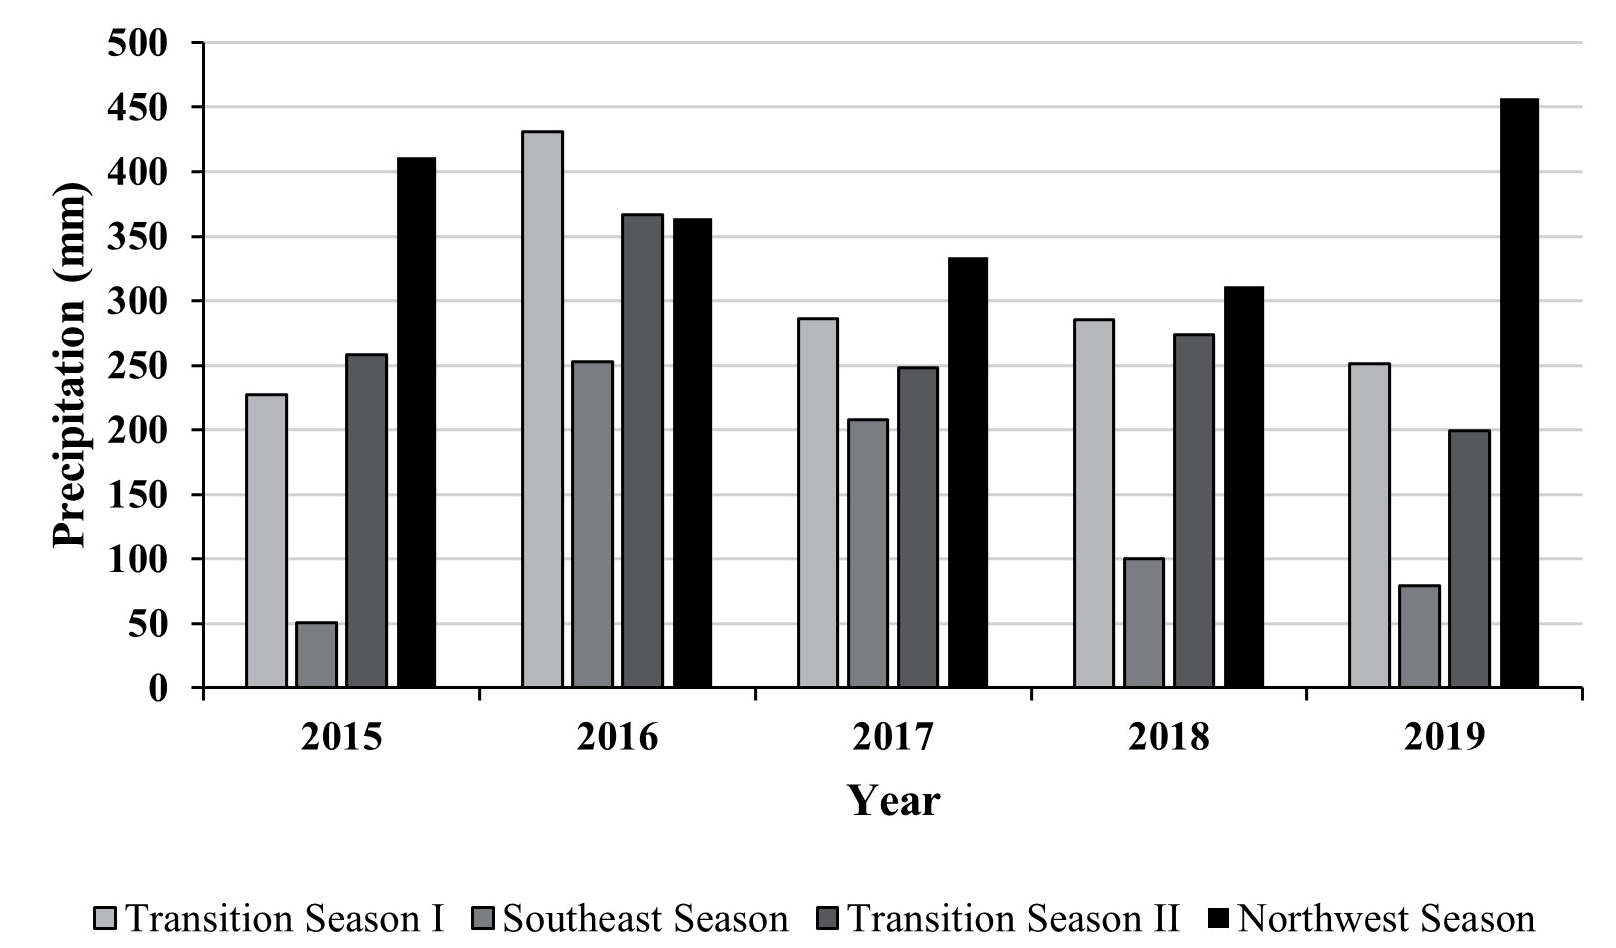
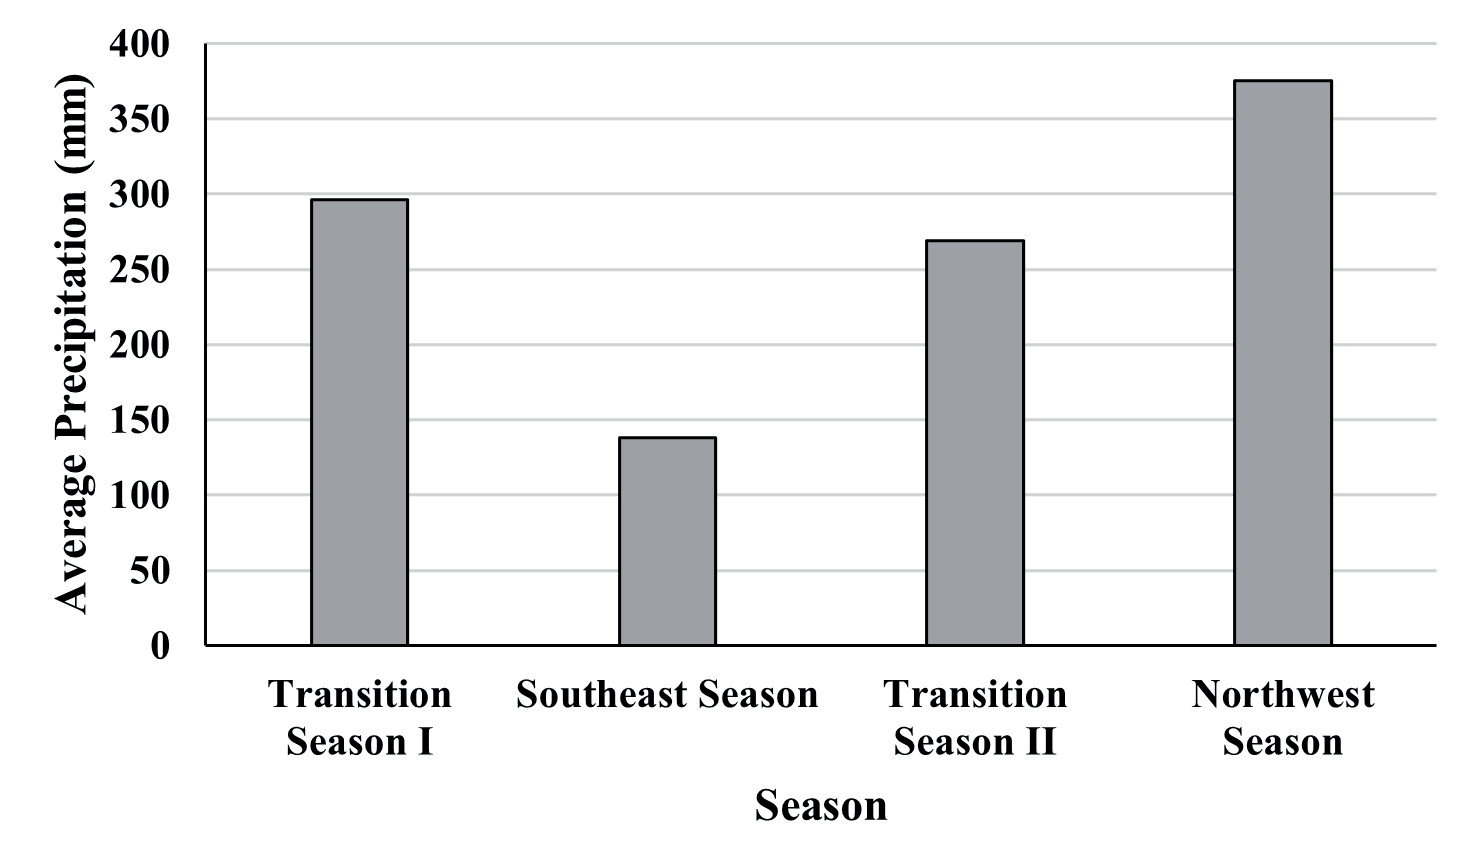
The average monthly precipitation based on seasonal variation from March 2015 to January 2019 in Pelabuhanratu Bay is illustrated in Fig. 2. From March 2015 to January 2019, precipitation in Pelabuhanratu Bay exhibited fluctuations, following a typical seasonal pattern where rainfall generally increases from the northwest season (December-February) to the first transitional season (March-May) and declines during the southeast season (June-August).
During Transition Season II (September-November) and the Northwest season (December-February) in 2016, precipitation values exhibited a similar pattern, attributed to the La Niña event, which intensified monsoonal winds and convection processes, resulting in increased precipitation [37, 38]. Conversely, 2015 recorded the lowest annual precipitation (227 mm), coinciding with a strong El Niño event that weakened monsoon activity and reduced rainfall across Indonesia [39, 40]. The Indian Ocean Dipole (IOD) also modulates seasonal precipitation variability, where positive IOD phases exacerbate dry conditions by weakening moisture transport into Indonesia, as seen in 2015, while negative IOD phases enhance rainfall by strengthening convection over the region [41, 42]. Studies indicate that the combined effects of ENSO and IOD can amplify extreme precipitation anomalies, with positive IOD-El Niño interactions intensifying droughts, while negative IOD-La Niña combinations heighten flood risks [43, 44].
The impact of seasonal precipitation variability extends beyond rainfall patterns, influencing hydrology and sediment transport in Pelabuhanratu Bay. Increased rainfall in the northwest season raises river discharge, potentially increasing sediment loads, yet TSS concentrations peaked during Transition Season II rather than in the northwest season. This suggests that factors beyond precipitation, such as wind-driven resuspension, ocean currents, and tidal interactions, play a crucial role in sediment transport dynamics [45, 46]. In estuarine systems, high river discharge alters salinity gradients and sediment deposition patterns, similar to monsoonal sediment fluxes observed in China’s Pearl and Yangtze River Estuaries [9, 47].
Long-term climate projections indicate that Indonesia is experiencing shifts in seasonal rainfall patterns due to climate change, including delayed monsoon onset and increased extreme precipitation events, which intensify flood risks and coastal erosion [48, 49]. The increasing frequency of heavy rainfall events alters hydrological cycles, potentially accelerating sediment deposition in estuaries, disrupting ecosystems, and impacting agriculture and fisheries [50, 51]. Future projections suggest that climate change-induced rainfall variability will intensify coastal sedimentation dynamics, emphasizing the need for adaptive water resource management and disaster mitigation strategies [52, 53].
TSS Concentration
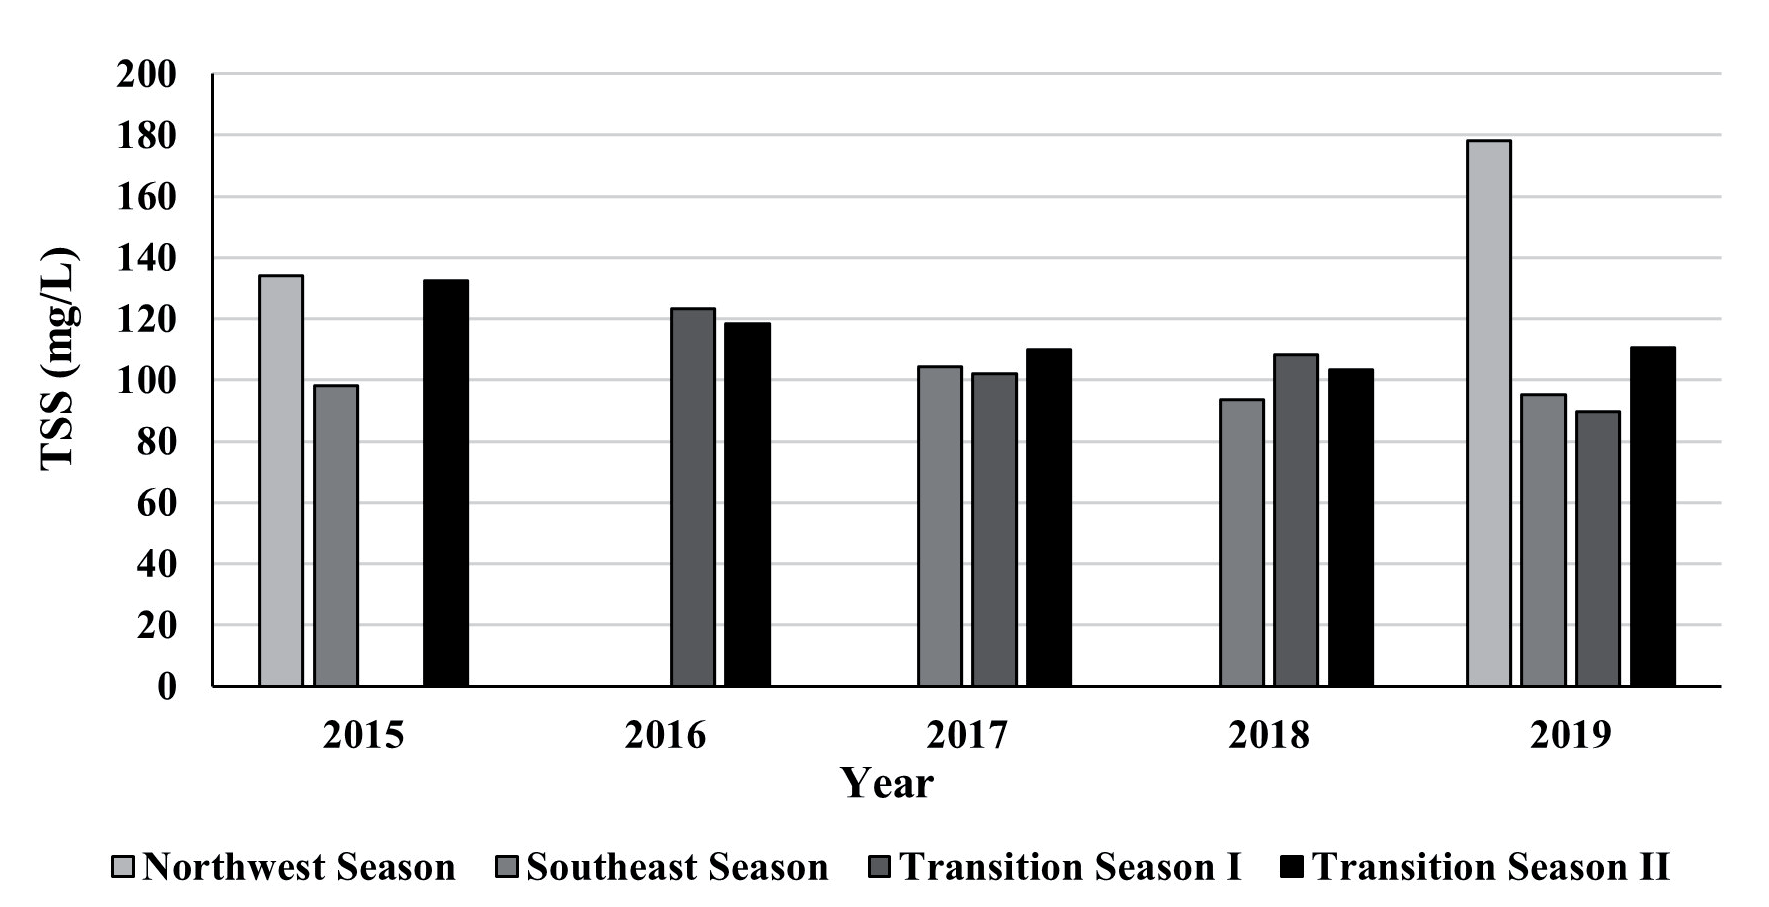
The TSS data obtained from March 2015 to January 2019 were grouped by season and classified into seven categories for spatial and temporal analysis (Fig. 3). Over the five years, the highest average TSS occurred during the second transition season, while the lowest was recorded during the northwest season. The highest average TSS was observed in the northwest season of 2019 (178.29 mg/L), while no TSS data were available for the northwest season in the three preceding years (Fig. 4). The first transition season recorded its highest TSS concentration in 2016 (123.14 mg/L) and the lowest in 2015 (Table 2). Meanwhile, the southeast season had its highest TSS in 2017 (104.43 mg/L), and the second transition season recorded its peak in 2015 (132.43 mg/L) and lowest in 2018 (103.29 mg/L).
Table 2.
Mean value of total suspended solids by season (2015-2019).
| Season | 2015 | 2016 | 2017 | 2018 | 2019 |
|---|---|---|---|---|---|
| Northwest | 134 | 0 | 0 | 0 | 178,2857 |
| Southeast | 98,14286 | 0 | 104,4286 | 93,42857 | 95,28571 |
| Transition I | 0 | 123,1429 | 102 | 108,1429 | 89,57143 |
| Transition II | 132,4286 | 118,2857 | 110 | 103,2857 | 110,7143 |
A combination of precipitation, river discharge, tidal currents, wind-driven resuspension, and human activities strongly influences the seasonal variations in TSS concentrations. In tropical estuarine and coastal waters, TSS levels tend to peak during the wet seasons, as monsoonal rainfall enhances sediment transport through river discharge and surface runoff [2, 14]. However, in Pelabuhanratu Bay, the highest TSS levels were recorded during the second transition season, indicating that tidal mixing and wind-driven resuspension also play crucial roles in sediment dynamics [54, 55]. The lowest TSS levels observed in the northwest season, despite peak rainfall, indicate that strong currents and wave action may distribute suspended particles more effectively, reducing localized concentrations [56, 57].
The relationship between precipitation, river discharge, and TSS levels is widely documented in coastal sediment transport studies, where high rainfall events mobilize sediments through runoff, increasing turbidity [8, 30]. Case studies from the Mekong and Rajang River Basins confirm that TSS levels rise significantly after heavy rainfall, followed by a gradual decline as sediment settles [58, 59]. However, in Pelabuhanratu Bay, the highest TSS values occurred during a season with relatively low precipitation, indicating that tidal cycles, wave action, and wind-driven mixing are major contributors to sediment resuspension [60, 61].
The influence of oceanic and meteorological factors on TSS transport is crucial, particularly in coastal environments that are subject to strong seasonal winds and monsoonal currents. Storm surges, tidal forces, and wave energy have been shown to resuspend bottom sediments, resulting in periodic spikes [62, 63]. Studies in macrotidal systems indicate that TSS variability is often linked to tidal resuspension, where sediments settle during neap tides and become resuspended during spring tides [64, 65]. In Pelabuhanratu Bay, monsoonal winds and tidal fluctuations likely contribute to increased sediment concentrations during the second transition season, despite relatively moderate rainfall inputs.
In addition to natural drivers, anthropogenic activities have a significant impact on TSS levels in coastal waters. Coastal development, deforestation, and urban expansion have led to increased erosion and sediment delivery to estuarine environments [66, 67]. Port activities, dredging, and land reclamation have also been identified as key contributors to elevated sediment loads in Indonesian coastal areas [3, 68]. In Pelabuhanratu Bay, coastal modifications such as urban expansion and increased industrial activity may be influencing sediment dynamics, particularly in areas near river mouths and shallow coastal zones.
Long-term trends suggest that climate change is altering sediment transport patterns, increasing the frequency and intensity of extreme weather events that drive TSS variability [69, 70]. Studies predict that more intense rainfall events, rising sea levels, and increased wave activity will disrupt coastal sedimentation patterns, potentially leading to higher erosion rates and altered nutrient cycling [71, 72]. As coastal ecosystems become increasingly vulnerable to climate-driven changes, monitoring and adaptive management strategies will be crucial in mitigating TSS-related impacts on marine biodiversity and fisheries [73, 74].
The observed seasonal variability in TSS levels in Pelabuhanratu Bay highlights the complexity of sediment transport mechanisms, which are influenced by a combination of climate-driven hydrological changes, oceanographic forces, and human-induced modifications. Given these dynamic interactions, future research should focus on long-term monitoring and modeling of sediment transport under shifting climatic conditions, ensuring effective coastal management and conservation efforts.
Temporal and Spatial Distribution of TSS Concentration
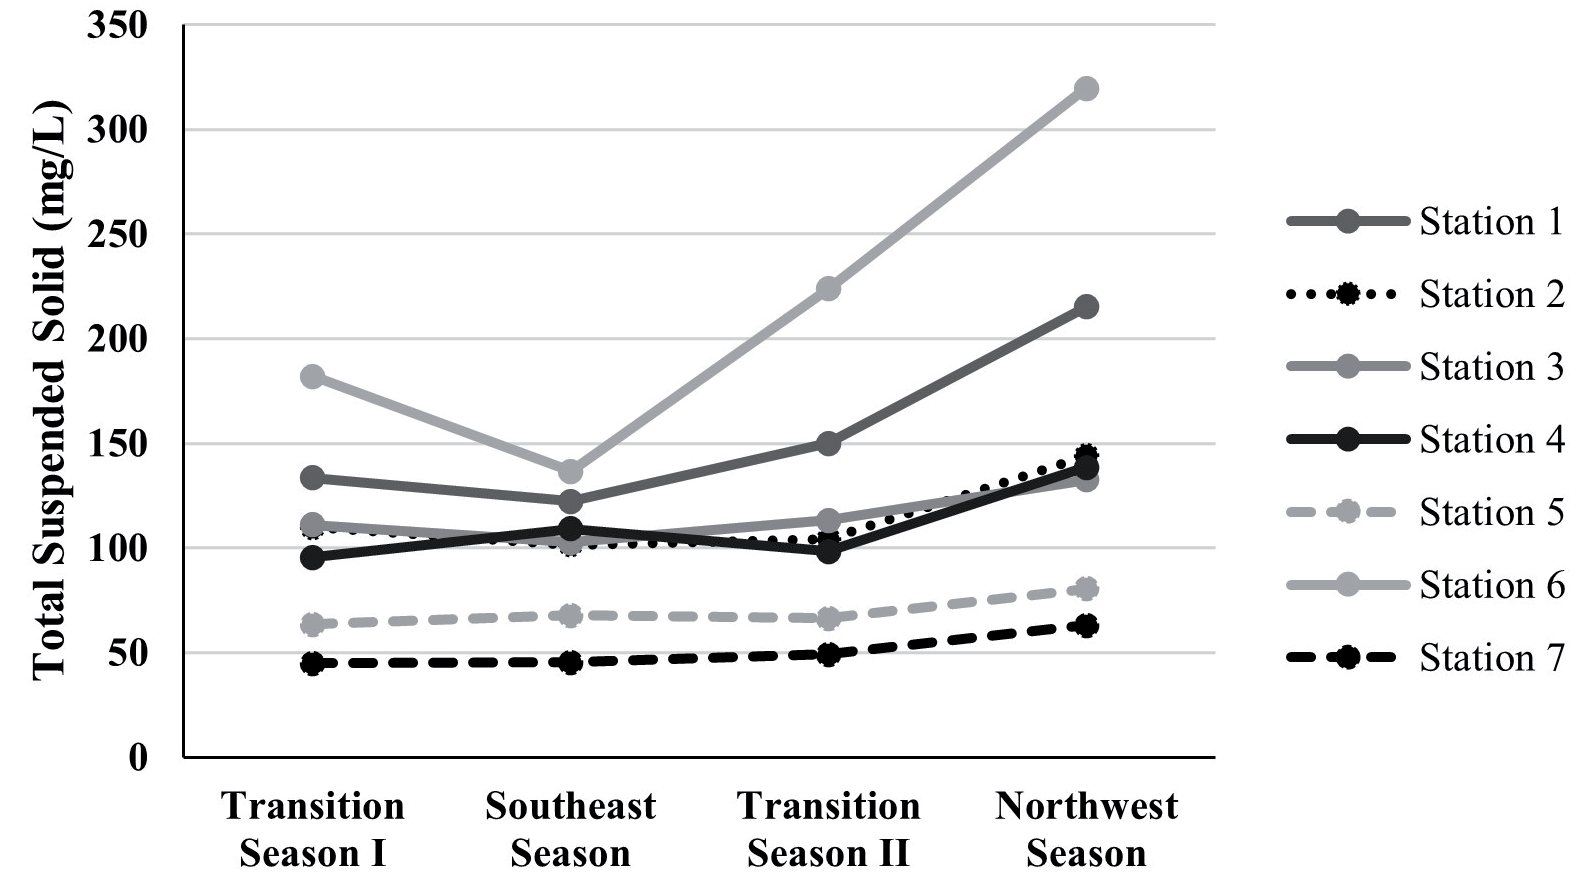
The spatial distribution of TSS in Pelabuhanratu Bay from 2015 to 2019 (Fig. 5) exhibits distinct seasonal patterns influenced by hydrodynamic conditions, river discharge, precipitation, and human activities. The TSS concentrations at stations 1, 2, 3, 6, and 7 closely align with seasonal precipitation trends, peaking during the northwest monsoon and declining during the southeast monsoon. However, stations 4 and 5 exhibited elevated TSS concentrations during the southeast season, suggesting that additional sediment resuspension processes are at play. Studies indicate that river discharge is a primary driver of TSS variability, particularly in estuarine and coastal systems, where sediment input from rivers significantly influences local turbidity levels [75, 76]. In Pelabuhanratu Bay, higher TSS values near river mouths confirm the role of freshwater inflows in sediment transport, whereas offshore locations exhibit lower concentrations due to dilution by ocean currents [18, 77]. Furthermore, seasonal tidal variations influence sediment resuspension, with stronger wave energy and tidal mixing contributing to localized TSS peaks during transitional seasons [7, 33].
The temporal variability of TSS is significantly affected by meteorological factors, including precipitation, wind patterns, and seasonal currents. High rainfall during the northwest monsoon season increases surface runoff and river discharge, thereby enhancing TSS concentrations [78, 79]. Conversely, storm-induced turbulence and tidal forces can resuspend previously settled sediments, thereby amplifying TSS levels even during periods of lower rainfall [80, 81]. The second transitional season in Pelabuhanratu Bay exhibited higher TSS levels than the first, reflecting the combined influence of monsoonal currents, tidal fluctuations, and wind-driven resuspension [5, 82]. Studies from other tropical estuaries confirm that TSS fluctuations are closely tied to riverine inputs, with higher discharge rates transporting increased sediment loads to coastal waters [83, 84]. In extreme weather conditions, such as typhoons or prolonged heavy rainfall, TSS spikes occur due to sudden sediment mobilization, further altering water clarity and nutrient cycling [85, 86].
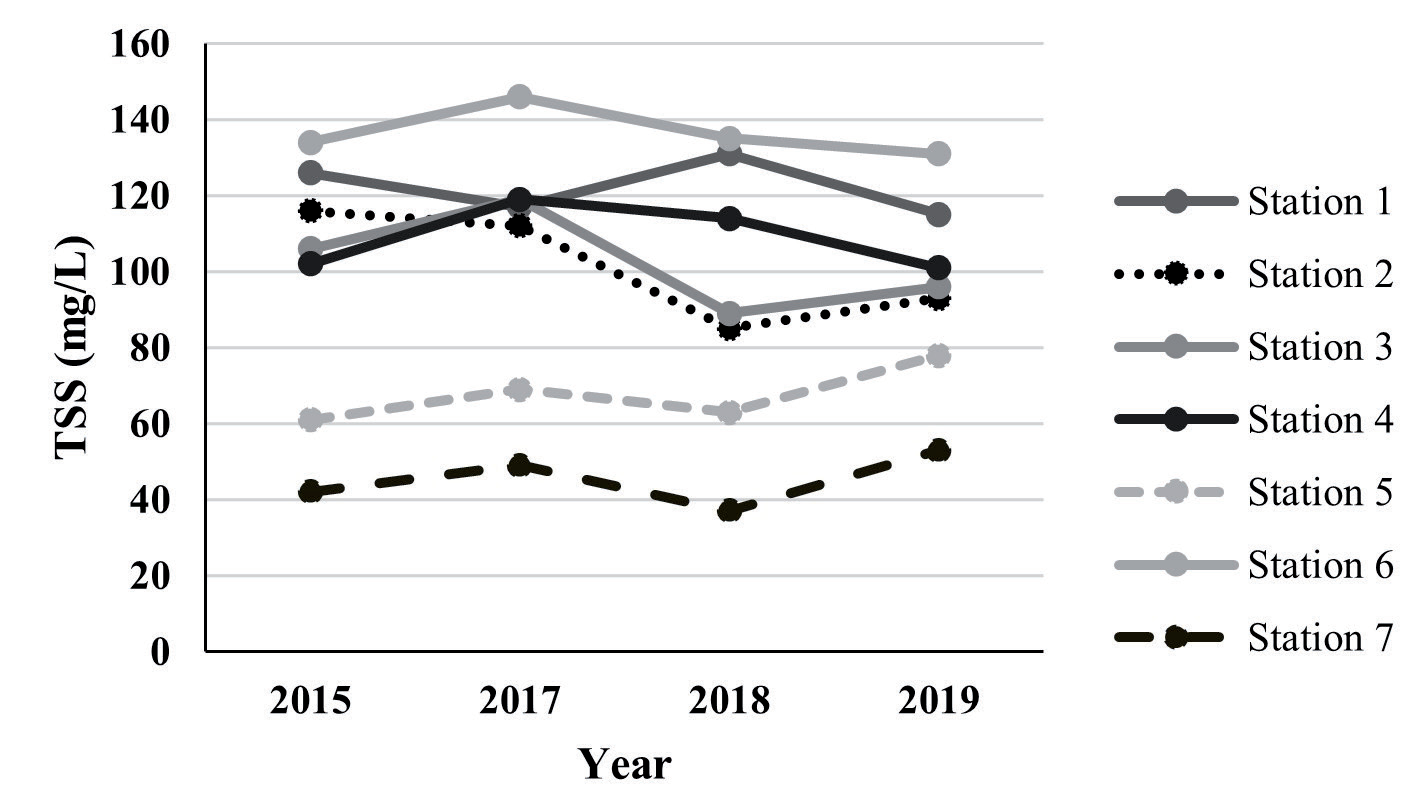
In addition to natural drivers, human activities significantly contribute to the spatial and temporal variability of TSS in coastal environments. Urbanization, land-use changes, and port activities increase sediment loads through enhanced runoff and habitat disturbance [33, 87]. Dredging and industrial expansion, common in coastal areas with active shipping routes, have been linked to localized TSS surges due to sediment resuspension [3, 88]. Furthermore, coastal modifications such as seawalls, jetties, and reclamation projects alter natural sediment transport dynamics, resulting in higher TSS levels in some areas and reduced sediment supply in others [86, 89]. The ecological implications of TSS fluctuations are significant, as increased turbidity can reduce light penetration, thereby affecting primary productivity and marine biodiversity [31, 90]. Moreover, suspended sediments act as carriers for pollutants, including heavy metals and organic contaminants, posing risks to both marine organisms and water quality [22, 91]. These findings underscore the importance of developing integrated sediment management strategies, particularly in high-risk areas where both natural and anthropogenic factors are at play, to ensure the sustainable health of coastal ecosystems.
TSS in the Transition Season I
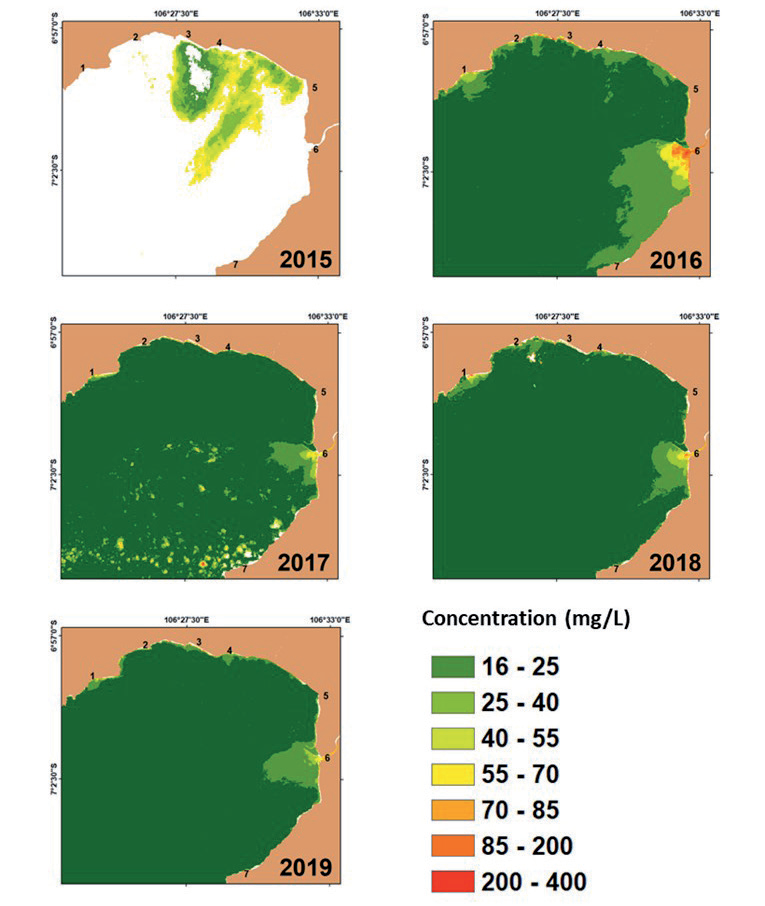
The concentration values of TSS during the first transition season exhibit significant spatial and temporal variability, as illustrated in Fig. 6. The spatial distribution of TSS fluctuates each year, with notable differences in concentration trends across the seven monitoring stations. However, in 2015, the dataset was compromised mainly due to excessive cloud cover (above 95%), rendering the data unreliable for accurate interpretation. Cloud cover remains one of the key challenges in remote sensing applications for water quality assessment, as it obscures optical satellite imagery and introduces uncertainty in TSS estimates. Studies have shown that cloud presence significantly affects the accuracy of remote sensing data, necessitating alternative methods, such as in situ validation and radar-based approaches, to compensate for missing observations [92, 93].
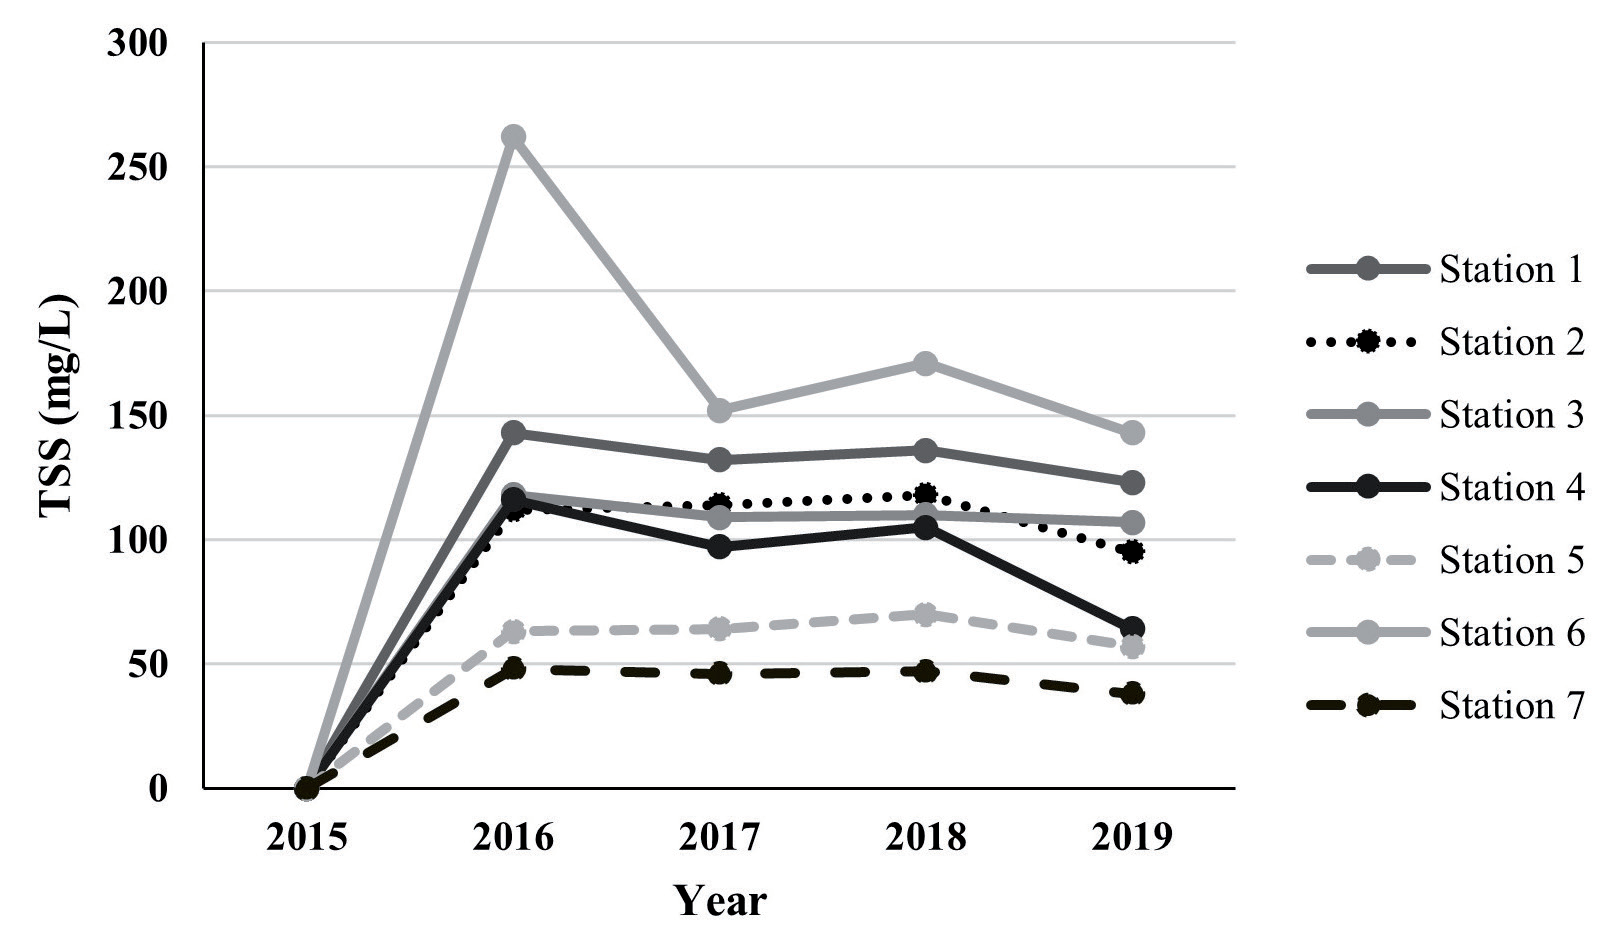
The distribution of TSS at each station follows distinct patterns influenced by hydrodynamic conditions, river discharge, and meteorological factors (Fig. 7). At station 1, the concentration remained relatively stagnant throughout the years, with values ranging between 85 and 200 mg/L in the estuarine region before gradually decreasing as it moved offshore. This pattern aligns with findings that estuarine areas tend to retain higher sediment concentrations due to the mixing of freshwater and marine inputs, which influence sediment deposition and transport processes [94, 95]. Similarly, station 2 exhibited a homogeneous distribution pattern, with values consistently between 85-200 mg/L in the estuarine region. In 2016, however, the station recorded the highest distribution dominance in the 40-55 mg/L range, likely due to shifts in sediment transport mechanisms influenced by rainfall and riverine input. River discharge plays a crucial role in regulating TSS levels, particularly during transition seasons when increased precipitation enhances sediment transport into coastal waters [81, 96].
At stations 3 and 4, the distribution of TSS was relatively stable across the years, with values ranging from 85 to 200 mg/L near the estuarine area, with a peak distribution occurring in 2016. However, in 2019, station 4 recorded lower concentration values of 55-70 mg/L in the estuarine region, suggesting possible shifts in hydrodynamic forcing or sediment retention capacity. Changes in wind and wave action are significant contributors to such fluctuations, as these factors influence sediment resuspension and stratification in transitional coastal waters [76, 97]. Similarly, station 5 showed a relatively homogeneous distribution of TSS, with concentrations ranging from 55 to 70 mg/L near the estuary before gradually decreasing offshore.
A more pronounced spatial variation was observed at station 6, which recorded the highest TSS concentrations among all stations over the five years. Between 2017, 2018, and 2019, TSS levels ranged between 85-200 mg/L, with a peak of 200-400 mg/L in 2016, which extended toward the northwest. This trend suggests a localized increase in sediment resuspension, possibly driven by wind-induced turbulence, increased runoff, or anthropogenic influences [18, 77]. High TSS levels in estuarine zones are often attributed to human activities such as land-use changes, deforestation, and industrial runoff, all of which contribute to elevated sediment loads in transitional coastal environments [98]. By contrast, station 7 consistently recorded the lowest TSS concentrations, with values ranging from 40 to 55 mg/L from 2016 to 2018 and a further decrease to 25-40 mg/L in 2019. The relatively low concentration levels at this station can be attributed to its proximity to a forested watershed, which naturally reduces sediment runoff through enhanced soil retention and vegetative cover, as also observed in similar riverine studies [99, 100].
Over the five years, TSS levels demonstrated a general declining trend across most stations, with increased concentrations between 2017 and 2018, followed by a notable reduction from 2018 to 2019. The most significant decline occurred at station 6 between 2016 and 2017, possibly reflecting changes in sediment deposition or water circulation patterns. Several studies have reported declining trends in TSS across estuarine systems, attributed to improved watershed management, sediment retention structures, and changing hydrodynamic conditions [13, 101]. Additionally, dam construction and reduced river discharge have been linked to declining sediment loads entering coastal waters, which in turn influence long-term trends in TSS levels [58, 102]. In the context of Pelabuhanratu Bay, these trends may reflect a combination of natural sediment transport processes and human-induced alterations in land use and water management.
The patterns observed in this study align with broader research on TSS dynamics in transitional seasons, where variations are influenced by a combination of meteorological, hydrodynamic, and anthropogenic factors. Transitional seasons are particularly sensitive to climatic variability, including monsoon shifts and El Niño-Southern Oscillation (ENSO) effects, which alter precipitation patterns and riverine sediment loads [103, 104]. In the Lower Mekong Basin, for instance, seasonal TSS fluctuations have been linked to land-use changes and hydrological variability, highlighting the interplay between natural and anthropogenic drivers [105, 106]. Similarly, research in other estuarine systems, such as Buenaventura Bay, has shown that human activities exacerbate seasonal sediment dynamics, resulting in pronounced shifts in water quality [26].
TSS in the Southeast Season
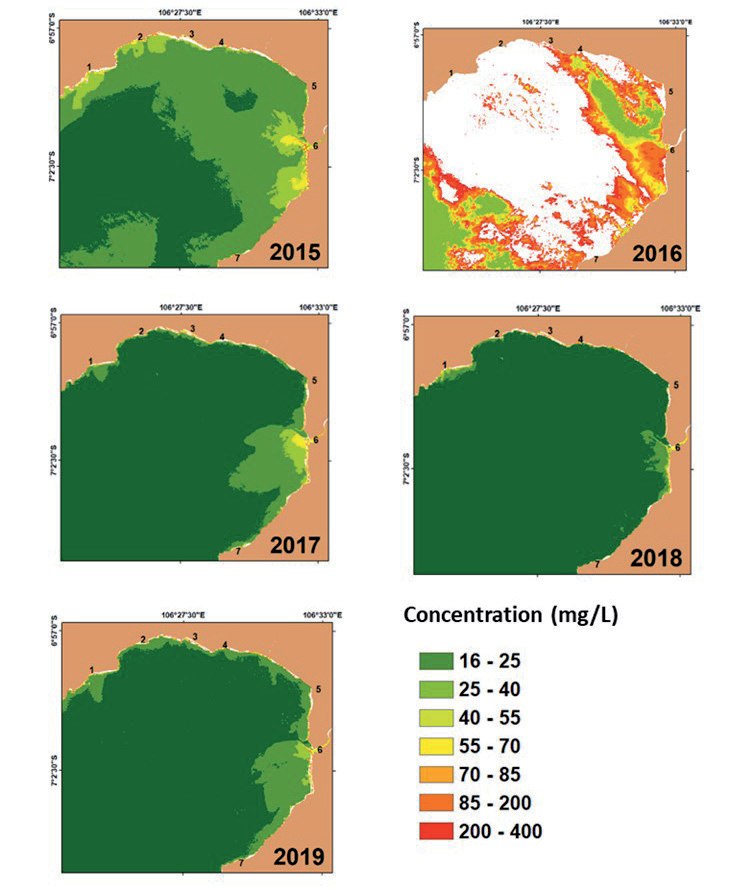
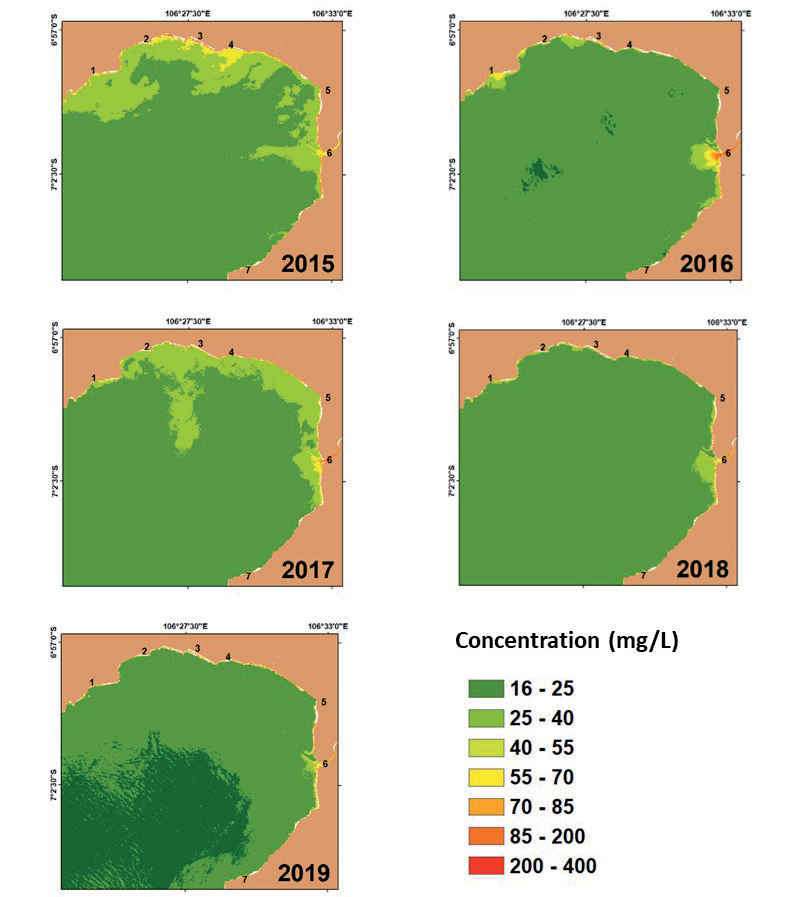
Monsoonal winds, hydrodynamic forces, river discharge, and anthropogenic activities significantly influence the seasonal variation of TSS in the Southeast monsoon season. The Landsat-8 data processing provided spatial and temporal information on TSS distribution from 2015 to 2019, illustrating fluctuations in TSS concentrations across various stations (Fig. 8). The highest concentrations were observed at stations 1, 3, 4, and 6, with TSS levels ranging from 85 to 200 mg/L in the estuarine region, before gradually decreasing southward (Fig. 9). Meanwhile, stations 5 and 7 exhibited lower concentrations, with TSS levels ranging from 40 to 70 mg/L. These variations are primarily driven by monsoonal hydrodynamics and terrestrial influences.
During the Southeast monsoon season, TSS concentrations frequently peak due to enhanced rainfall runoff and sediment resuspension dynamics. Studies have shown that monsoonal winds intensify sediment transport and mixing processes in coastal and estuarine systems, resulting in increased TSS levels during this period [107, 108]. The Indonesian Throughflow plays a crucial role in sediment redistribution, thereby influencing TSS dynamics in tropical regions such as Indonesia [109]. The increased wave action and hydrodynamic turbulence enhance sediment suspension, disrupting previously settled sediments and transporting them across coastal waters [18, 24]. The fluctuating freshwater input during monsoonal periods contributes to higher TSS concentrations as terrestrial runoff introduces a significant volume of sediments into estuarine systems [24].
Hydrodynamic factors such as tidal currents, wind-driven mixing, and river discharge also impact TSS variability during this season. The influence of river discharge and precipitation variability plays a crucial role in shaping TSS concentrations. Increased precipitation associated with the Southeast monsoon season enhances runoff and sediment transport, particularly in estuarine environments, where the interaction between riverine and marine forces modulates sediment deposition and resuspension [13, 110]. Studies indicate that estuarine turbidity maxima (ETMs) ‒ zones of concentrated suspended sediments ‒ form due to tidal influences and high river discharge, resulting in seasonally elevated TSS levels [111, 112]. Additionally, research on coastal sediment transport suggests that fluctuations in precipitation and river outflows significantly contribute to trends in TSS concentration during monsoonal seasons [113, 114].
Another critical factor affecting TSS measurement in the Southeast monsoon season is cloud cover interference in remote sensing data. In 2016, Landsat-8 data were rendered invalid due to 95% cloud cover, limiting the ability to analyze TSS spatially and temporally. Studies have highlighted that cloud cover disrupts satellite-based water quality assessments, reducing the reliability of image acquisition and altering spectral signals, which can lead to misinterpretations of TSS distributions [115, 116]. To overcome this issue, various cloud removal techniques have been employed, including machine learning-based cloud detection and the integration of Synthetic Aperture Radar (SAR) with optical imagery [117, 118]. Time-series approaches, such as the Enhanced Spatial and Temporal Adaptive Reflectance Fusion Model (ESTARFM), have also been employed to reconstruct missing data points and enhance TSS estimations in cloud-prone regions [119]. These innovations enhance the accuracy of remote sensing data, enabling more reliable water quality monitoring even under challenging atmospheric conditions.
The anthropogenic impact on TSS variability during the Southeast monsoon season is another significant consideration. Urbanization, deforestation, agricultural activities, and coastal modifications all contribute to fluctuations in sediment loads [120, 121]. Increased impervious surfaces and reduced vegetation cover lead to higher runoff rates, which transport more sediments into coastal systems and elevate TSS concentrations [122]. Additionally, human activities such as dredging, land reclamation, and port development disturb coastal sediments, exacerbating TSS variability [123]. In regions where extensive land-use changes have altered natural sediment dynamics, elevated TSS concentrations have been linked to increased sediment runoff from construction zones and agricultural lands [124-126]. Fishing practices, particularly bottom trawling, also disturb sediment beds, contributing to increased suspended solids in coastal waters [124].
Long-term climate change trends are increasingly influencing TSS concentrations in tropical estuarine and coastal environments. The effects of changing precipitation patterns, temperature fluctuations, and extreme weather events contribute to shifts in sediment dynamics and runoff patterns [127, 128]. Climate models predict that intensifying monsoonal precipitation will lead to higher sediment transport rates, thereby amplifying TSS concentrations in estuaries [129]. Conversely, changes in river flow regulation and sediment trapping resulting from dam construction have been linked to declining TSS trends in some river basins [130, 131]. These climate-driven alterations in hydrological cycles and sediment transport pathways pose challenges for coastal and estuarine management, necessitating adaptive strategies to mitigate the impacts on sediment dynamics and ecosystem health [132].
TSS During the Transition Season II
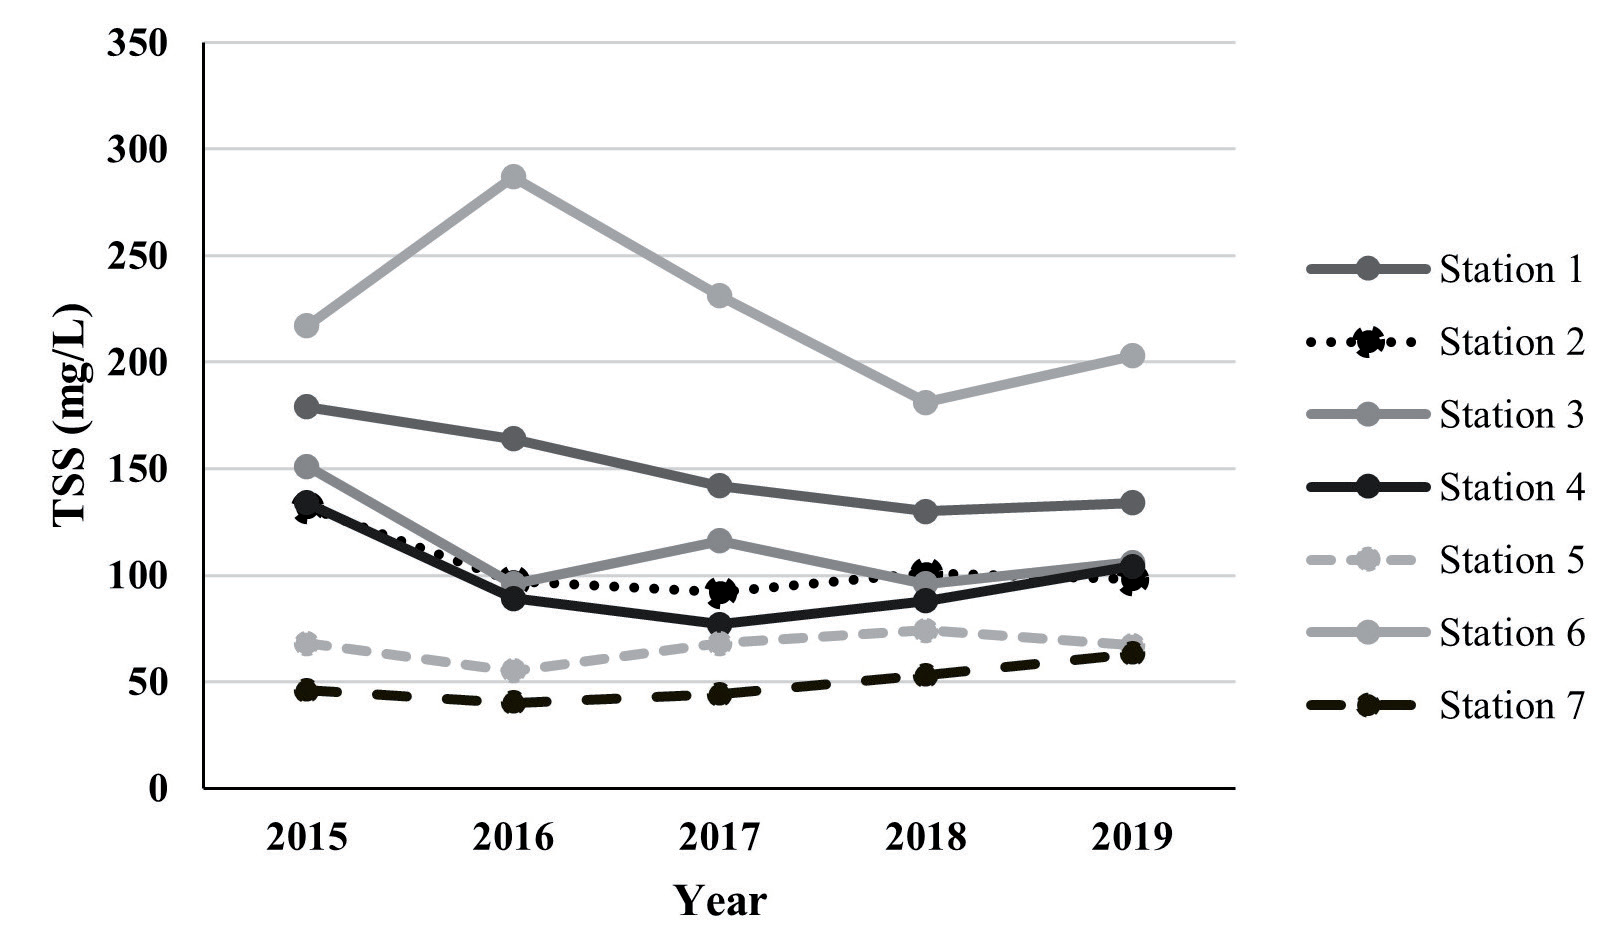
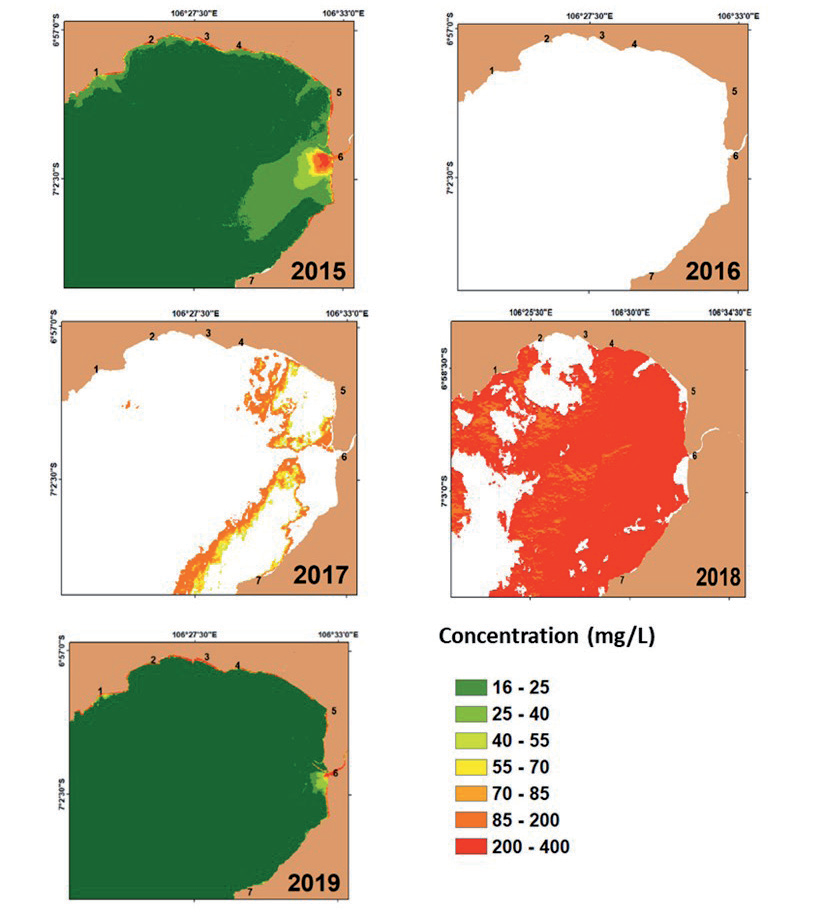
The spatial distribution and concentration fluctuations of TSS during Transition Season II, from 2015 to 2019, reveal distinct patterns, particularly in estuarine areas where concentrations tend to be higher than in offshore waters (Fig. 10). The variation in TSS concentration across different stations is influenced by seasonal hydrodynamics, river discharge, sediment resuspension, and anthropogenic activities, all of which play critical roles in the observed fluctuations. The highest recorded TSS concentrations were observed in 2015, with stations 1, 2, 3, and 4 exhibiting concentrations between 85 and 200 mg/L (Fig. 11). In contrast, station 6 recorded the highest values, ranging from 200 to 400 mg/L. Meanwhile, stations 5 and 7 showed relatively lower concentrations, with values ranging from 55 to 70 mg/L and 40 to 55 mg/L, respectively. These patterns are shaped by a combination of natural and anthropogenic drivers, highlighting the importance of understanding estuarine sediment dynamics during transitional periods.
TSS levels in estuarine systems during transitional seasons are predominantly governed by hydrodynamics, sediment resuspension, and freshwater inflows. Research has shown that shifts from dry to wet conditions have a significant impact on TSS concentrations, primarily due to the increased influence of freshwater inflows and sediment transport mechanisms [133]. The interplay of tidal dynamics and seasonal freshwater discharge influences sediment dispersion, with flood events causing abrupt changes in TSS levels [134]. Additionally, estuarine circulation patterns during transitional seasons influence sediment deposition and resuspension, affecting the spatial and temporal distribution of TSS [135]. As freshwater inflows increase during the transition period, sediment resuspension events become more frequent, resulting in elevated TSS concentrations, particularly in estuarine zones where mixing processes are intense [136, 137].
Variability in river discharge and hydrodynamics during transitional periods also plays a fundamental role in shaping TSS distribution. The interaction between riverine inputs and tidal forces generates estuarine turbidity maxima (ETMs), which are responsible for trapping and maintaining high sediment concentrations in specific areas [138]. Studies have shown that periods of high discharge correlate with increased TSS levels, while lower discharge seasons facilitate sediment deposition, resulting in reduced concentrations [139]. Additionally, fluctuations in estuarine salinity gradients, driven by river inflows and tidal dynamics, create stratification layers that modulate sediment transport [5]. Specific case studies in the Pearl River Estuary have demonstrated how variations in seasonal discharge influence sediment loads, reinforcing the importance of hydrodynamic processes in controlling TSS fluctuations during transitional seasons [140]. Furthermore, the Ganges-Brahmaputra-Meghna Delta exemplifies how seasonal rainfall-driven sediment fluxes contribute to dynamic TSS concentrations, particularly during monsoonal shifts [141].
Apart from natural drivers, anthropogenic influences, including land-use changes, urbanization, and industrial activities, significantly impact TSS levels during transitional seasons. Increased urbanization has led to enhanced surface runoff and sediment discharge, exacerbating TSS concentrations in estuarine waters [142]. During heavy rainfall events, impervious surfaces in urban areas accelerate runoff, transporting large sediment loads into coastal waters [143]. In China’s Pearl River Estuary, rapid urbanization over the past two decades has led to fluctuations in sediment concentration, highlighting the impact of human activities on TSS levels [10]. The influence of industrial activities, such as dredging and land reclamation, has also been highlighted as a significant contributor to TSS variability, particularly in coastal regions undergoing substantial infrastructural expansion [144]. These findings underscore the necessity for effective urban planning and sediment control measures to mitigate the impact of human activities on TSS levels.
In addition to seasonal variability, long-term trends in TSS concentrations are influenced by climate change, which alters precipitation patterns, increases storm frequency, and modifies sediment transport dynamics in estuarine systems [145]. Climate-induced changes in hydrological cycles have led to heightened soil erosion, resulting in increased TSS fluxes during transitional seasons [146]. For instance, in the Mekong River Basin, climate variability has intensified rainfall-induced sediment runoff, contributing to elevated TSS concentrations in estuarine environments [58]. Moreover, extreme storm events exacerbate sediment mobilization, causing abrupt spikes in TSS concentrations that disrupt ecological balance and water quality [147]. Studies in the Chesapeake Bay indicate that hypoxic conditions, triggered by elevated TSS levels, have negatively impacted fisheries and aquatic biodiversity, reinforcing the need for long-term monitoring of sediment fluxes in estuarine systems [148].
Remote sensing technologies have played a crucial role in monitoring TSS concentrations, particularly in estuarine waters affected by seasonal variability. However, challenges such as cloud cover often hinder satellite-based observations, necessitating the development of innovative solutions for data acquisition [32]. Recent advancements in machine learning algorithms have enhanced cloud removal techniques, allowing for more accurate TSS estimations despite atmospheric interferences [149]. The integration of multiple satellite datasets, such as those from Landsat-8 and Sentinel-2, has enhanced the ability to capture TSS dynamics with greater temporal and spatial resolution [11]. Additionally, the implementation of geostationary satellites, such as GOCI, has provided high-frequency monitoring capabilities, thereby reducing the impact of cloud cover on data acquisition [32]. Future research should focus on refining hydrodynamic modeling approaches and integrating remote sensing data with field measurements to develop more robust predictive models for TSS distribution [150].
TSS throughout the Northwest Season
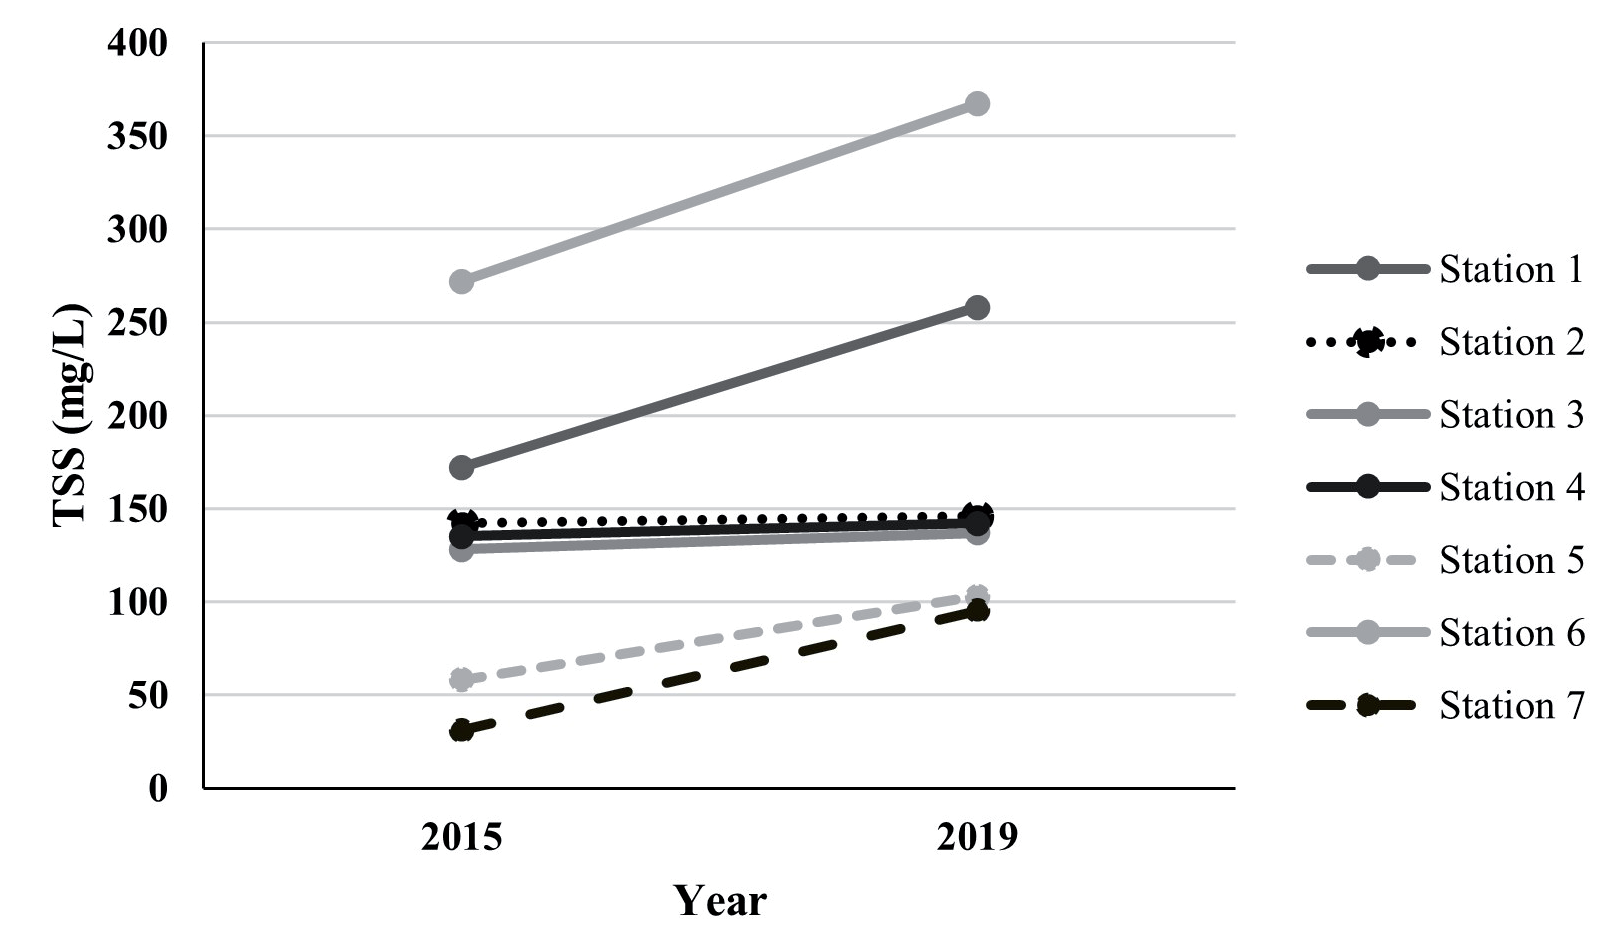
The seasonal variation of TSS in estuarine and coastal systems during the Northwest season is influenced by hydrodynamic forces, river discharge, tidal interactions, and anthropogenic activities. The spatial distribution data from 2015 and 2019 revealed distinct fluctuations in TSS concentration across different stations, with cloud cover limiting observations in certain years [19, 151] (Fig. 11). Stations 1, 2, 3, and 4 exhibited concentrations between 85 and 200 mg/L, while Station 6 recorded the highest TSS levels (200-400 mg/L in 2018) due to enhanced sediment resuspension and coastal circulation patterns [152] (Fig. 12). Conversely, station 7, located near the estuary, exhibited consistently lower TSS values (25-40 mg/L in 2015 and 85-200 mg/L in 2018), reflecting the role of riverine dilution in regulating sediment concentrations [153]. Long-term analysis from 2015 to 2019 reveals increasing TSS trends at stations 1, 5, 6, and 7, particularly at Station 6 (from 272 mg/L in 2015 to 367 mg/L in 2019), highlighting the significant influence of monsoonal sediment dynamics [154, 155] (Fig. 13).
Hydrodynamic processes, particularly river discharge and tidal forces, significantly influence the distribution of TSS, with seasonal precipitation enhancing sediment transport from river catchments into coastal waters [17, 156]. During the Northwest monsoon, increased freshwater inflow mobilizes sediments and sustains high TSS levels, with variations influenced by tidal oscillations and estuarine mixing [157, 158]. Anthropogenic factors, including urbanization, land-use changes, and deforestation, further contribute to TSS fluctuations, with stormwater runoff and agricultural expansion exacerbating sedimentation rates [159]. Additionally, climate change-induced shifts in precipitation and storm intensity are projected to exacerbate TSS trends, necessitating robust monitoring frameworks and adaptive sediment management strategies [160-162]. Remote sensing technologies, despite the challenges posed by persistent cloud cover, remain a critical tool for assessing TSS spatial variability. Advances in machine learning-based cloud detection and satellite-derived hydrodynamic modeling have improved monitoring accuracy [33, 163].
Understanding the complex interactions between natural and anthropogenic drivers of TSS variability is essential for sustainable estuarine management. The integration of long-term observational data, predictive hydrodynamic models, and enhanced remote sensing techniques is necessary to address sediment flux challenges under changing climate conditions [164, 165]. Future research should focus on refining sediment transport models and developing data-driven conservation strategies to mitigate the ecological and economic impacts of TSS fluctuations in dynamic estuarine ecosystems [81, 166].
Conclusions
This study demonstrates that the distribution and variability of TSS in Pelabuhanratu Bay from 2015 to 2019 were influenced by the interactions among precipitation, river discharge, tidal currents, and anthropogenic activities. The highest TSS concentrations occurred during Transition Season II. In contrast, the Northwest Monsoon, despite experiencing the highest precipitation, did not always exhibit a significant increase in TSS, indicating the role of hydrodynamic processes and sediment resuspension. Spatially, stations near river estuaries exhibited higher TSS concentrations than offshore areas, with station 6 recording the highest values due to sediment deposition and resuspension. In contrast, station 7 consistently showed lower concentrations, likely due to the influence of upstream vegetation acting as a natural sediment filter. Temporally, TSS concentrations increased at stations 1, 5, 6, and 7, while stations 2, 3, and 4 remained relatively stable, reflecting hydrodynamic patterns and human-induced changes. Remote sensing-based monitoring faces challenges due to high cloud cover, underscoring the need for an integrated approach that combines satellite data with field measurements to enhance accuracy. These findings underscore the importance of long-term monitoring and hydrodynamic modeling in enhancing our understanding of coastal water quality dynamics and supporting mitigation strategies against sedimentation and environmental degradation resulting from climate change and anthropogenic pressures.

