

Introduction
Marine coastal areas are ecologically affected by human activities, so managing and protecting the coastal environment, which includes a sensitive and rich ecosystem in terms of different biological species, is considered a complex challenge [1]. Humans directly and indirectly, through measures such as the development of urban and industrial areas and agricultural activities, release various pollutants in aquatic ecosystems, which have adverse effects on the quality of aquatic habitats and health [2].
Compounds of Polychlorinated Biphenyls (PCBs, C12H10-nCln) are carcinogenic, mutagenic, and persistent organic environmental pollutants [3]. Because of their persistence, long-term transport in an atmosphere, and a high potential for bioaccumulation, toxicity, and nonbiodegradability, they pose thoughtful threats to human health and ecosystems [4, 5]. PCB compounds are transferred in the aquatic food chain more than terrestrial ones, therefore their highest concentration has been reported in natural environments, marine mammals, fish-eating birds, and fish [6]. These compounds tend to accumulate in the food chain due to their stability and lipophilicity. These compounds accumulate in the animal’s bodies, particularly fish and shellfish, and as a result, people who consume these foods are exposed to PCBs [7]. Consumption of food containing PCBs may cause toxicity, neurological and reproductive disorders, and mutation and cancer in long-term exposure and consumption [8, 9].
Although the manufacture of PCBs has reportedly been banned, the potential or possibility of their entry into the environment still exists. The physical and chemical properties of PCBs, including high-temperature stability, chemical inertness, non-flammability, high electrical resistance, etc., have led to their increasing use in the industry [10]. It has been recorded that 150 of 209 isomers of these compounds have been reported in the environment [11]. In addition to the PCBs toxicity, there is also the risk of producing dibenzo-p-dioxins (PCDDs), dibenzofurans (PCDFs), and related compounds as a result of their incomplete oxidation [12].
The Caspian Sea is the largest closed water area in the world, and due to its size and location in several peninsulas, diverse ecosystems have been created in its different areas [13]. The rocky shores of the southern basin of the Caspian Sea have existed in two forms, natural and artificial, and the artificial beaches were created with goals such as preventing the rise of the sea level, building harbors, and other various marine structures [14]. From an ecological view, rocky shores are a very good model for studying the biological changes of the seas, and due to the direct influence of coastal currents and waves, they are considered a rich source of nutrients, oxygen, and sediments [15]. Rocky shores are home to many different populations of mollusks, bivalves, barnacles, seaweeds, algae, and other biological groups with adhesive ability [16]. Barnacles (Amphibalanus improvisus) have a global distribution. Species on decapod gills and free-living groups are adapted to clinging to other organisms and to hard substrates and artificial structures [17]. They have been used as heavy metals biomonitors in aquatic environment previously [18], nevertheless, no earlier research has exactly used barnacles as possible PCBs biomonitors. Barnacles are crustaceans which have many attributes to be a good biomonitor such as they are widespread and abundant in all seasons worldwide, having a sessile adult life, easy to collect, relatively tolerant to contaminants, capable of biomagnifying contaminants and reflecting changes in contaminant levels in the aquatic environment [19].
The coastal sediments of the Caspian Sea are affected by various agricultural activities, shipping, petrochemical industries, oil extraction, and industrial settlements, each of which has a significant contribution to the pollution of the region. Thus the present survey was done to investigate PCBs accumulation in barnacle and sediment biomarkers in the main ports of the Caspian Sea in the coastal lines of Gilan province, Iran.
Materials and Methods
Study Area
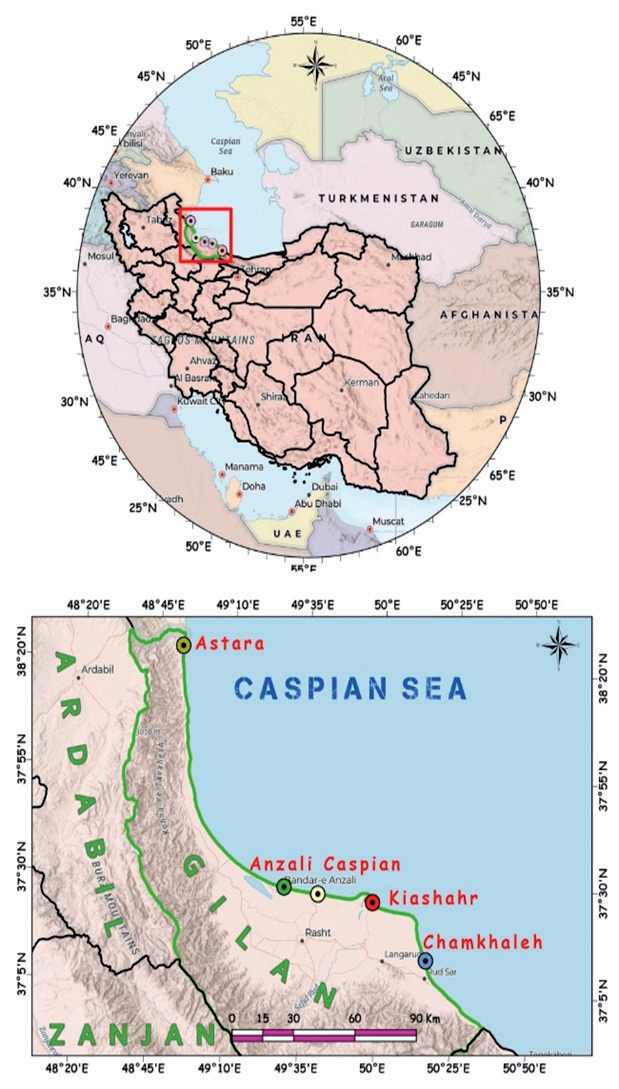
The Caspian Sea is the largest lake on the planet, which is called a sea due to its geographical and ecological features. This lake is located at 41.9350ºN and 50.6689ºE longitude and latitude. Fig. 1 shows the study location and stations. Totally, Astara. Anzali, Caspian, Kiashahr, and Chamkhaleh stations were selected to assess the PCBs concentration among barnacles and sedimentation samples (Fig. 1).
Table 1 shows the geographical properties of 5 selected stations.
In this research, a station in each coastal port and 3 repetitions in each station were considered to reduce the error rate. In the case of sediment and barnacles, each one was taken separately and sampled.
Sampling Procedure
First, preliminary action was taken in the spring season to visit and identify the sampling site and determine and record the stations accurately using GPS (Garmin 600, USA). Then, with the warming of the weather and the blooming of barnacles in the summer season and the months of August and September, the sampling operation was carried out with the appropriate sampling tool using the Van Veen Grab for sedimentation and choosing the standard sampling method for the biomarker. In this research, 5 stations were considered and in each station, 3 repetitions were randomly done for sediment and 3 repetitions for barnacles, and a total of 30 samples were collected. After collection, the samples were first washed with seawater and then with distilled water and stored in aluminum containers at -4ºC. All samples were transferred to the laboratory.
Sample Preparation
Before extracting, the sediment and barnacle samples were frozen for 48 hours using a freeze dryer (Christ Alpha 1-2, Germany) until the samples were completely dry, then the sediment samples were filttered using 250 m filter. The barnacle samples were also ground.
PCBs Determination in Sediments and Barnacles
PCBs extraction method from sea sediments and barnacle tissue was done using an ultrasonic probe. Briefly, 5 g of granulated sample is transferred to a 40 mL vial. To obtain extraction recovery, 60 µl of 10 ppb standard surrogate (PCB-209) was added to the sediment inside the vial. Then, the sediment was added 3 times with 20 ml of a 50:50 mixture of dichloromethane: acetone solvents, and the sediment was exposed to ultrasonic waves from the ultrasonic probe for 5 min. Then, using a centrifuge, the sediment was separated and the extracting solvent was collected in a 100 mL rotary flask. To fully extract PCBs, the extraction and decantation steps were repeated three times. Then, the solvent inside the balloon was dried using a rotary, then the rotary balloon was washed with 5 mL of n-hexane, and the resulting solution was transferred to the clean-up stage.
To clean up materials, some glass wool was transferred into the Pasteur paste, then 500 mg of silica gel was transferred into the pipette. Before passing the extracted solution, the silica gel stationary phase was conditioned with 3 mL of n-hexane. Then, the extracted solution was passed through the column and the column was washed again with 10 mL of n-hexane and the resulting solution was collected inside a vial. Finally, the resulting solution was brought to a volume of 200 µL using N2 blowing. To analyze the compounds of PCBs, one microliter of the resulting solution was injected into the GC-MS device and 18 isomers of PCB compounds were obtained.
GC-MS Analysis
A GC device (Agilent Technologies 6890N, USA) coupled to MS (Agilent Technologies 5973N, USA) equipped with the Rxi 5ms column (30 m long × 0.25 mm i.d × 0.25 µm df) was used to determine the PCBs concertation amongst the examined samples. The oven temperature program is shown in Table 2. The carrier gas was helium, and the flow rate was 1 mL/min [20].
Results and Discussion
The present study was done to assess the PCBs concentrations amongst the sediment and barnacle samples collected from 5 important ports of the Gilan province, Iran (Caspian Sea).
Table 3 shows the percent recoveries, limit of detection (LOD) and limit of quantitation (LOQ) values of PCBs. Table 4 shows the PCBs concentrations amongst the barnacle and sediment samples collected from different ports. The findings showed that PCBs concentration in examined samples had a range between 02.00±0.10 to 53.00±00.60 ng/g. Amongst the barnacle samples, PCB-77 (53.00±00.60 ng/g in Chamkhaleh, 53.00±01.20 ng/g in Caspian, 53.00±02.40 ng/g in Anzali, and 53.00±02.70 ng/g in Astara ports), had the highest concentration, while PCB-114 (02.00±00.10 ng/g in Astara port) had the lowest. Amongst the sediment samples, PCB-52 (53.00±00.70 ng/g in Chamkhaleh port) had the highest concentration, while PCB-114 (03.00±00.20 ng/g in Anzali port) had the lowest. Statistically significant differences were observed between PCBs concentration and types of samples (P<0.05).
Table 2.
GC-MS oven temperature program.
| Stage | Temperature (ºC) | |
|---|---|---|
| GC | Initial | 130ºC (2 min hold) |
| Increased at 15ºC/min | 160ºC | |
| Increased at 5ºC/min | 300ºC (30 min hold) | |
| MS transfer line | 300ºC | |
| Ion source | 230ºC | |
| Quadrupole | 150ºC | |
| Injector port | 270ºC | |
Table 3.
The percent recoveries, LOD and LOQ values of PCBs.
Table 4.
PCBs concentrations amongst the barnacle and sediment samples collected from different ports.
The strategic position of the Caspian Sea, including its rich source of oil and gas and commercial source of diverse kinds of fish and shrimp, makes it important to assess the ecological properties. Rendering the huge volume of oil and gas exchanges, as well as the activities of ships and factories around the Caspian Sea, the possibility of contamination of the ecosystem of this sea with various types of environmental pollutants, especially PCBs, is very high. As PCBs can be filtered by filter feeders from water and according to their accumulation in lipid-rich tissues of aquatic organisms, these organisms can be used as bioindicators of persistent PCBs pollutants in marine and coastal environments [21]. The majority of the preceding investigations used to fish and shellfish species as PCBs bioindicators [7, 22, 23]. However, in the present survey, barnacles and sediment of the Caspian sea were used to assess the PCBs concertation. Barnacles have been used as heavy metals bioindicators in the marine environment beforehand [24], nevertheless, no previous research has precisely used barnacles as potential PCBs bioindicators in the Caspian sea. Extensive and plentiful distribution in all seasons globally, a sessile adult life, easy collection procedure, tolerant nature against contaminants, and the property of reflecting the existing contaminant conditions make barnacles to be the best bioindicator of marine and coastal environment [25].
The findings of the present survey showed that the sediment and barnacle samples collected from ports near the Caspian Sea were polluted with diverse classes of PCBs. In some of the studied ports, the sediment samples and others the barnacle samples were more polluted in terms of a specific type of PCBs. Therefore, no regular pattern was seen in this case. Additionally, no regular results were obtained regarding which of the sediment or barnacle samples had more PCBs pollution. However, PCB-77 and PCB-52 amongst the barnacle and sediment samples were the most frequently identified, respectively. Revelry, PCB-114 amongst both barnacle and sediment samples had the lowest distribution. PCBs concentration in examined samples had a range between 02.00±00.10 to 53.00±00.60 ng/g.
Because of the high diversity of PCBs type analyzed in previous investigations, along with dissimilar measurement units and methods, and finally, the absence of published works about the PCBs concentrations in barnacle samples, comparing the findings of the present research with previous studies is complicated and could not be reasonable. In this regard, a survey conducted in China [26] showed that the dioxin-like (DL)-PCBs concentration amongst the fish samples was 00.88 ng/g wet weight, which was lower than our examined rate in the majority of cases. The PCBs concentration measured in barnacle and sediments of the Caspian sea, Iran (02.00±00.10 to 53.00±00.60 ng/g dw) was high compared to other aquatic environments, including Chapala Lake, Mexico (09.00-27.00 ng/g) [27], Larak Island, Persian Gulf, Iran (02.95-07.95 ng/g) [28], Southern Yellow Sea, Western Pacific Ocean (00.51-05.84 ng/g) [29], Indian sea, Hugli estuary (00.18-02.33 ng/g) [30], Belgium (00.03-03.10 ng/g) [31], and Japan (0.04-00.64 ng/g) [32]. However, PCB’s concentrations were low compared to values found in surveys conducted in China Pearl river (16.15-477.85 ng/g) [33], San Diego Bay, USA (23.00-1387.00 ng/g) [34], and Bangladesh (32.17-199.40 ng/g) [35]. A survey conducted in Anzali port, Caspian sea, Iran [36], showed that The mean DL-PCBs concentration amongst the collected fish samples ranged from 232.00±16.00 to 1156.00±14.00 pg/g lipids. Another Iranian survey conducted in Gilan province, Caspian Sea, Iran [37] showed that the mean PCBs concentration amongst the land uses samples ranged from 05.10±00.00 to 28.00±07.00 µg/kg. Vaezzadeh et al. (2021) [38] showed that PCBs concentrations amongst the barnacle samples collected from Malaysia ranged from 07.90±00.00 to 300.00±00.00 ng/g. Similar PCBs profiles have been reported in previous investigations. In this regard, PCB-101, PCB-138, and PCB-153 were also identified in Philippine oyster [39], Spanish bivalve [40], European mussels [41], and Brazilian bivalve [42] samples. PCB-28 was also detected in Chinese mollusk [43], while PCB-52 and PCB-101 were detected in Ghana bivalve [44] samples. PCB-87 and PCB-101 were also detected in Thai mussels [45] and PCB-180 was detected in Senegal mollusks [46]. Similar to our research, PCB-52 and PCB-77 were detected in samples collected from China [47, 48], Egypt [49], Saudi Arabia [50], Korea [51], and the United States [52].
Sewage outfalls, surface runoff, shipping activities, and wastewater discharges have been identified as the main contributors to PCBs distribution in seawater. Such differences found in the PCBs concentration between diverse investigations may be due to differences between geographical origin, environment condition, the season of sampling, type of collected samples, organism’s lipid content, living and feeding habits, method of analysis, types of detected PCBs, and biodegradability, water solubility, and chlorinated levels of PCB congeners in the aquatic ecosystem.
Conclusions
In the present study, barnacles for the first time as PCBs bioindicators in the Caspian Sea were assessed. The findings showed that samples of all examined 5 ports besides the Caspian Sea were polluted with PCBs. Relatively high PCBs concentrations amongst the examined samples may also suggest the high contamination rate of the marine and coastal environments, fish, and other aquatic organisms of this region, which may pose an important public health issue. This, coupled with the increasing environmental pollution around Gilan province, the Caspian Sea, could become a concern for its population that traditionally consumes large quantities of fish. Thus, it is essential to determine the limitations of the PCBs concentrations in both barnacles and sediments as biomonitors to assess the quality of the ecosystem. Because the season, sampling location, and organism species were not similar in the present research and the previous studies, supplementary surveys on PCB levels in barnacles and sediments from similar locations are essential.

