

Introduction
Environmental pollution poses a significant challenge that cannot be overlooked during economic growth due to its detrimental effects on public health. According to the Ministry of Ecology and Environment (MEE)’s National Ambient Air Quality Status Bulletin for 2023, China’s average concentrations of PM2.5, O3, SO2, and NO2 exceeded the standards set by the World Health Organization (WHO), measuring at 33 ug/m3, 98 ug/m3, 61 ug/m3, and 28 ug/m3, respectively. Furthermore, carbon emissions have caused irreversible damage to sustainable economic advancement, such as droughts, floods, and other extreme weather events.
In contrast to developed countries, where the primary focus has shifted to carbon mitigation after addressing environmental pollution, China currently faces enhancing its ecological environment while striving for carbon neutrality. This highlights the necessity for a comprehensive governance approach [1, 2]. The December 2020 Central Economic Work Conference emphasized the vital role of combating pollution and achieving a synergistic effect in reducing both pollution and carbon emissions. Similarly, the 20th National Congress of the Communist Party of China stressed the importance of coordinating industrial restructuring, pollution control, ecological protection, and climate change response to realize the vision of a beautiful China. It emphasized promoting carbon reduction, pollution abatement, green expansion, and economic growth together. These documents underscore the urgent need for simultaneous carbon and pollution reduction for effective environmental governance and also highlight the importance of aligning environmental policies to achieve synergistic effects.
To achieve carbon mitigation, the Chinese government has successively implemented eight pilot carbon markets since 2013 and officially launched the national carbon market in July 2021. The carbon market operates by assigning scarce initial carbon quotas to various sectors, which can then be traded. These covered sectors buy or sell carbon quotas based on their individual marginal mitigation costs and carbon prices to ensure compliance. Due to economic linkages between covered and non-covered sectors, varying scope of covered sectors would impact the economy, environment, and social welfare differently [3]. Given the improvement of the carbon market operation system and the increasing pressure to reduce emissions, policymakers are considering expanding the coverage of the carbon market. While many studies have addressed the selection criteria for covered sectors, few have focused on improving the synergies between carbon reduction and air pollutant mitigation. This paper aims to bridge this gap, further enhancing the carbon market’s cost-effectiveness.
In pursuit of synergistic gains in pollution reduction and carbon mitigation within the carbon market, this paper integrates complete forward and backward linkages from Input-Output models to construct cost-benefit values for various sectors and pollutants, which is a basis for sector selection. Unlike existing studies that often rely on single indicators such as sectoral carbon emission intensity, total emissions, or other criteria for selection, the standards proposed in this paper have the following notable advantages: First, by utilizing complete forward and backward linkage values in Input-Output analysis, it comprehensively captures the direct and indirect impacts of sectoral changes on the economy, aligning with policymakers’ needs to consider issues from a macro perspective. Second, the introduction of cost-benefit values quantifies the pollution emissions per unit of output; selecting sectors with higher cost-benefit ratios can help to reduce economic costs and enhance the cost-effectiveness of policies. Moreover, drawing upon the theory of intertemporal resource allocation, the different covered sectors’ inclusion sequence will influence the overall cost of emission reduction in the carbon market. Consequently, this paper systematically analyzes the inclusion sequence of covered sectors by devising a comprehensive cost-benefit indicator.
This paper makes two potential contributions to the existing literature. Firstly, it introduces a novel selection criterion for sector coverage. This criterion integrates complete forward and backward linkages with cost-benefit analysis, addressing a gap in current literature by improving cost-effectiveness and synergistic gains in pollution reduction and carbon mitigation within the carbon market. Secondly, it establishes a weighted cost-benefit indicator to determine the sector inclusion sequence from the perspective of minimizing emission reduction costs.
The structure of this paper is as follows: the second section is a literature review and theoretical analysis. Next, introduce the research method and data preprocessing. Results and Discussion are the fourth section. The fifth section is further analysis. Finally, there are a conclusion and policy implications.
Literature Review and Theoretical Analysis
Literature Review
The idea of the synergistic effect of carbon reduction on air pollutants originates from the 1995 IPCC report, which highlighted additional benefits resulting from policies aimed at addressing climate change in developed countries. Scholars worldwide, including those in China, have extensively researched this concept, focusing primarily on evaluating policy effectiveness [4–7]. Chen et al. [4] investigated the synergistic emission reduction effect of emissions trading systems (ETS) on both air pollution and carbon emissions using the time-varying difference-in-differences (DID) model. Zeng and He [5] examined the synergistic reduction effect of transportation using the Kaya constant equation and the LMDI decomposition model. Li et al. [1] analyzed the synergistic emission reduction effect of ETS pilots, highlighting significant reductions in CO2 and sulfur dioxide (SO2) emissions. Chen et al. [6] verified and quantified the bidirectional synergistic effects between reductions in carbon emissions and air pollutants (SO2 and PM2.5) at the city level. Liu et al. [7] found significant potential for improvement in China’s pollution and carbon reduction synergy effect using the SAM-DDF model and the Luenberger productivity index with provincial data from 2006–2018. While several scholars have offered insights into the synergistic pathway of pollution and carbon reduction [8–10], there remains a lack of research on enhancing this synergy within carbon markets.
China has established the world’s largest carbon emissions trading system. However, there is a lack of official documentation regarding the criteria used to determine the current sector coverage. Zhang et al. [11] and Qi et al. [12] noted that the selection of sectors in pilot carbon markets primarily hinges on factors such as absolute carbon emissions, emission intensity, carbon share, and data availability. Qian et al. [13] proposed the use of the Carbon Leakage Index for sector selection, while Hu et al. [14] developed a model based on controllability theory in complex networks to identify sectors for carbon emissions control. Shen et al. [15] identified key sectors for carbon emissions reduction in China using the Ghosh model, which includes coal mining and washing, mineral processing, petroleum refining, coking, nuclear fuel processing, and the chemical sector. Some studies have also used computable general equilibrium (CGE) models to simulate and evaluate the impacts of various coverage scenarios. Lin and Jia [3] analyzed government policies over different periods and concluded that scenarios including three sectors are preferable. However, none of these studies have considered the synergistic effects of carbon reduction on air pollutants when selecting covered sectors. Moreover, some studies heavily rely on assumptions about current economic conditions and only consider partial sector coverage scenarios, limiting their ability to provide optimal sector sets for policymakers.
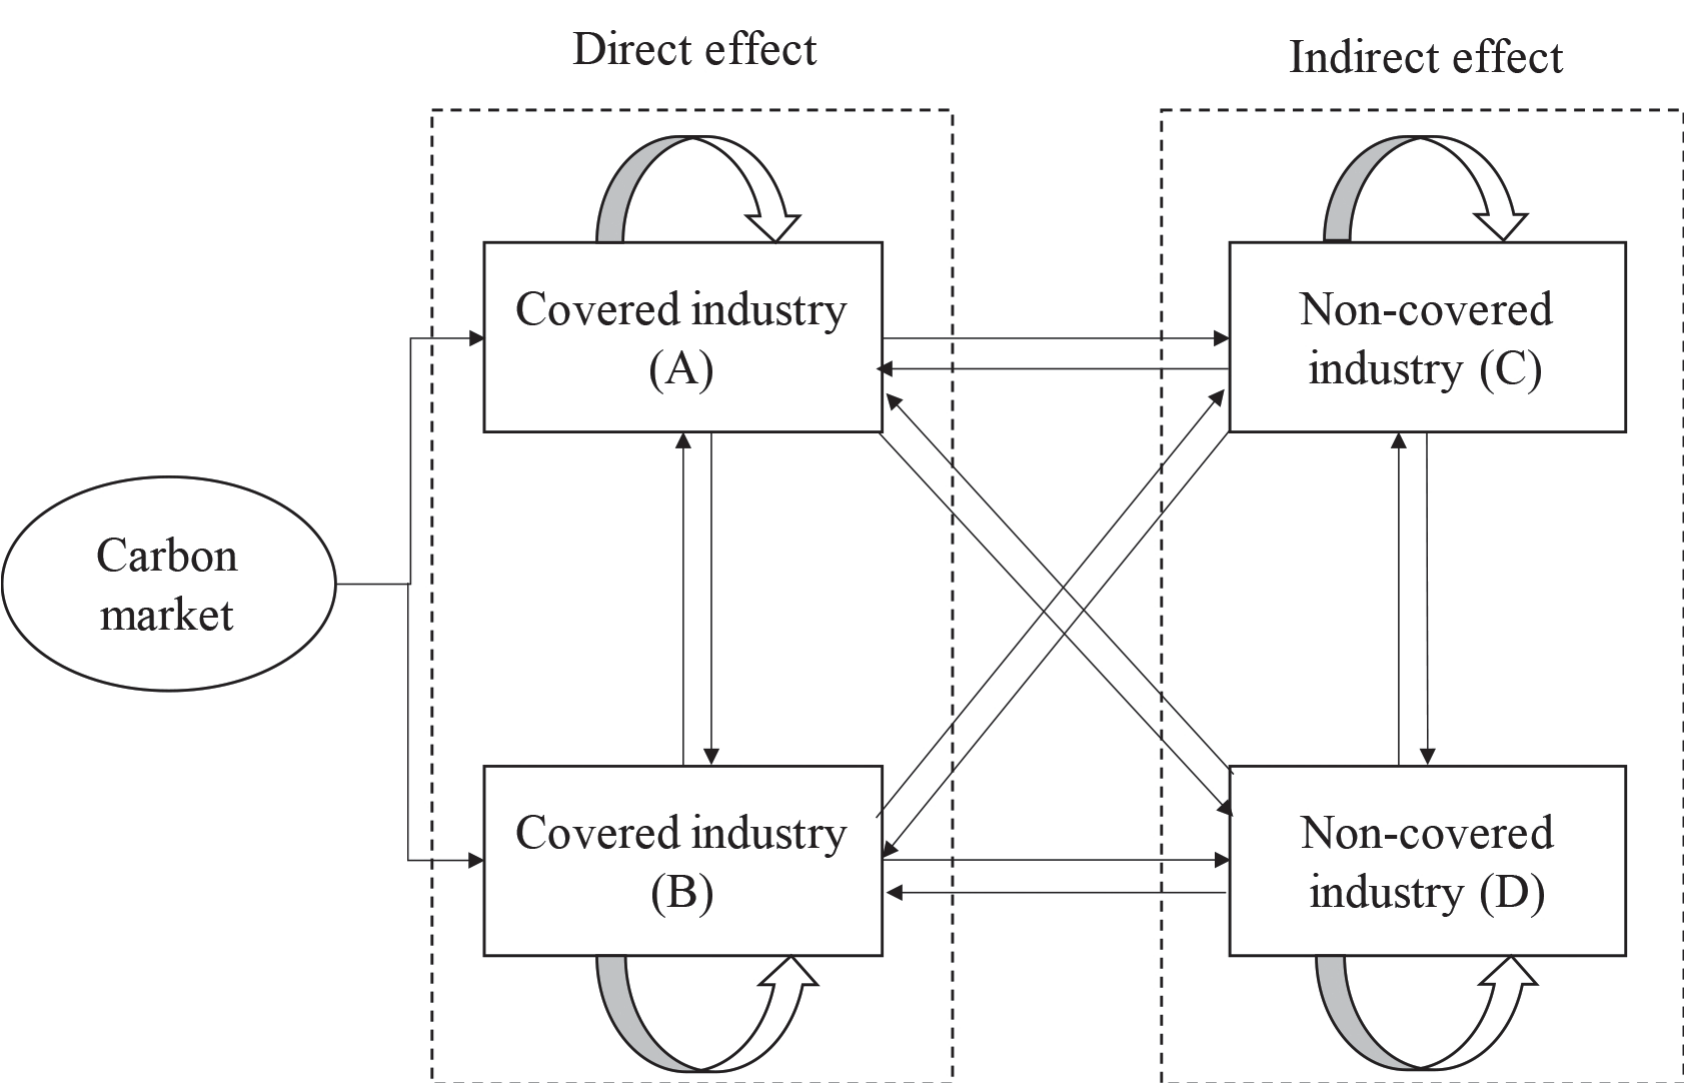
Fig. 1.
Theoretical analysis of the effects of carbon market. Note: This figure intuitively illustrates the impact mechanisms of the carbon market on both covered and non-covered sector sectors. Lines between the two sectors represent interactions, while lines pointing towards their own sectors indicate feedback loops.
A review of recent literature reveals a dearth of studies establishing criteria for selecting sectors in carbon markets to enhance both the synergy between carbon reduction and air pollutant mitigation and policy cost-effectiveness. To address this gap, we conducted an analysis to determine the criteria for selecting sectors covered by the carbon market and their sequencing, utilizing input-output modeling and cost-benefit analysis. This research, which is highly innovative in both topic and approach, depicts how to select carbon market-covered sectors and contributes to the literature by providing new insights and implications for scholars, investors, and policymakers.
Theoretical Analysis
Minimizing economic costs while achieving environmentally friendly, low-carbon development is both an urgent challenge and a guiding principle in ecological management. This reflects the theory of policy optimization, whose core objective is to enhance the efficiency and effectiveness of policy formulation and implementation, ensuring policies achieve their goals while minimizing negative impacts. Therefore, applying policy optimization theory can assist governments in better addressing complex social, economic, and environmental challenges [16, 17]. To visualize the cost of policy, Fig. 1 illustrates the specific functions of the carbon market mechanism. By considering the target objects of the carbon market, sectors can be categorized into covered industry sectors A and B, subject to their regulations, and non-covered industry sectors C and D. Within this framework, covered industry sectors A and B incur initial carbon emission costs, impacting their production expenses in the short term, regardless of technological advancements. Drawing upon the theory of comparative advantage, the precise categorization of sectors within the socio-economic framework not only boosts production efficiency but also strengthens economic ties across sectors, giving rise to complex industrial networks and interactions. Consequently, with the Input-Output model, the initial carbon emission costs borne by covered sectors create ripple effects throughout society, affecting sector output, carbon emissions, and pollutant emissions via intra-sector and inter-sector cycles. We simplify these effects by considering impacts on covered sectors as direct and those on non-covered sectors as indirect. The aggregate impact of these direct and indirect effects constitutes the total effect of the carbon market.
Table 1.
Sectors classification by different cost-benefit value.
Based on the above analysis, the overall impact of carbon markets can be assessed using three key indicators: changes in economic costs, carbon emissions, and pollutant emissions. When selecting covered sectors, if only the total amount or intensity of carbon emissions is taken as the criteria for selection, neglecting the comparison of costs and benefits under different circumstances, it is easy to result in higher overall economic costs and smaller changes in carbon and pollutant emissions under fixed carbon emission targets, thereby causing policy inefficiency and decreasing overall social welfare. Hence, establishing selection criteria for covered sectors based on cost-effectiveness is more rational and scientifically grounded. Given that carbon dioxide and other air pollutants predominantly originate from energy consumption [18], controlling carbon dioxide emissions typically leads to a simultaneous reduction in air pollutants. As each indicator carries distinct implications, it is challenging to distinguish their effects solely through a simple comparative analysis. Cost-benefit analysis, by establishing the ratio between benefits and costs (cost-benefit value), enables comparisons across different indicators, serving as a common method to assess policy effectiveness and a crucial approach for economic decision-making [19, 20]. To optimize cost while maximizing combined pollution and carbon reduction benefits, the impact of the carbon market on these emissions is evaluated based on their cost-benefit value. Carbon emission cost-benefit value signifies the carbon dioxide reduction achieved per unit cost, while pollutant emission cost-effectiveness denotes the pollutant reduction achieved per unit cost. Higher cost-benefit values denote greater policy effectiveness. Considering that the primary aim of carbon market policies is to curb carbon dioxide emissions, we regard the cost-benefit of carbon emissions as a measure of policy efficacy and pollutant emissions as an indicator of policy environmental synergies. Table 1 illustrates sector classification based on their cost-benefit values. When both effectiveness and environmental synergy are high, every unit of cost yields greater reductions in both carbon and pollutant emissions. Therefore, this paper advocates selecting sectors covered by the national carbon market based on high values of carbon emission cost-benefit and pollutant emission cost-benefit.
From the experience of domestic and foreign carbon market operations, to avoid a large impact on the economy and enhance the acceptance of the policy, the gradual inclusion of the covered sectors in batches is a feasible option. Given the differences in the impact of each sector on the economy and the high cost of policy adjustment, a reasonable inclusion order is an issue that policymakers must consider. With the advancement of accounting technology, balancing economic costs and emission reductions is a key basis for designing the sector inclusion sequence. Cost-benefit analysis is an important balancing method. Based on the fact that there is a big difference between the cost-benefit value of carbon emissions and pollutant emissions in different sectors and there is a difference in the degree of importance attached to pollutant emission reduction and carbon dioxide emission reduction by policymakers, the order of incorporation under different emission reduction policy objectives is not the same. This paper subsequently calculates the results using different policy scenarios.
Experimental
Research Method
To calculate the cost-benefit values of pollutant emissions and carbon emissions, it is necessary to determine the overall economic costs and changes in carbon dioxide and pollutant emissions resulting from changes in output per unit for each sector. In contrast to econometric methods such as structural equation models and regression, Input-Output models comprehensively incorporate inter-sectoral economic relationships, providing a more holistic, accurate reflection of the overall economic system’s response to a given variable. Therefore, this study employs an Input-Output model to assess the impact of changes in unit output across sectors on the economy, carbon emissions, and pollutant emissions.
The Input-Output model is a crucial short-term macroeconomic analysis tool that has seen widespread application in policy analyses spanning energy, environment, and economics in recent years. According to the inherent logic of the Input-Output model [21], the impact of a unit output change in a particular sector on the total output of all sectors in society can be understood through two pathways: one is the increase in demand for various sector products required for production within that sector due to the increase in its output, termed the complete economic backward linkage value; the other is the increase in supply to sectors using the products of that sector as intermediate inputs due to the increase in its output, termed the complete economic forward linkage value.
According to Leontief [22], the total production of each sector can be understood as the combined result of intermediate inputs and final consumptions.
Where x is a n × 1 column vector of total output, y is a n × 1 column vector of final uses, which consists of the consumption of residents and government, investment, and export. A is a n × n intermediate input (or direct requirement) coefficient matrix as follows:
Where Xij represents sector j’s use of sector i’s products, xj is sector j’s total output. It is important to highlight that in employing the Input-Output model, we make the assumption that remains constant. This assumption holds true in the short term due to the relatively stable nature of technology levels and factor input substitutions.
Rewrite the Eq. (1) as follows:
Where I is a n-dimensional unitary matrix, L is the Leontief inverse matrix, and its element lij represents the complete increase of output in sector i due to a unit increase of output in sector j. Then summing the elements in the ith column of the L matrix measures the change in the overall output generated from one unit increase of sector i’s output, which is regarded as the complete economic backward linkage for sector i.
Similarly, the total output of each sector can also be expressed by intermediate inputs and initial inputs, such as labor, capital, depreciation, and operating surplus, as illustrated below:
Where ‘'’ represents the transposition, υ is the 1 × n initial input vector, B is the n × n supply coefficient matrix, which is written as:
To solve total output, Eq. (6) yields:
Where G is the Ghosh matrix, its element gij represents the increase in total output in sector i due to one unit increase in output in sector j. Summing the elements of ith row of the G matrix gives the change in overall output of a unit change in sector i’s output, which is regarded as the complete economic forward linkage for sector i.
Similar to the complete forward and backward linkage values in the economy, combining the coefficients for carbon dioxide and various pollutant emissions allows us to calculate the complete forward and backward linkage values in carbon dioxide and pollutant emissions across society resulting from a one-unit increase in sector i’s output. This can be specifically expressed as follows:
Where k represents carbon dioxide or other pollutants, cjk represents the emission factor for a pollutant or carbon dioxide corresponding to the unit output of sector j.
Based on the theoretical analysis, to enhance the cost-effectiveness of the carbon market, we have adopted a cost-benefit approach for selecting sectors to participate in. This approach considers the ratio of changes in carbon dioxide and pollutant emissions to changes in total output as the key indicator. It is important to note that while individual linkages may show significant impacts of the carbon market on specific sectors, a higher value in one linkage doesn’t necessarily imply a greater overall impact. To ensure a comprehensive and reliable assessment of cost-effectiveness, we propose averaging the complete forward and backward linkages. This approach provides a balanced perspective on the economic, carbon emission, and pollutant emission changes. The cost-benefit value of gas k in sector i can be expressed as:
To enable more comprehensive comparisons, we standardized the cost-benefit value, expressed as follows:
When sector i’s cost-benefit value is higher than the average cost-benefit value, we can get
Table 2.
29 sectors.
Condition 1:
Condition 2:
Where p represents the type of pollutants other than CO2. Condition 1 ensures the optimization of cost-benefit associated with carbon emissions, aligning with the primary objective of the carbon market to achieve carbon reduction. Meanwhile, Condition 2 is designed to maximize the cost-benefit of pollutant emissions, thereby enhancing the synergy between pollution and carbon reduction efforts. Given the diverse nature of pollutants, the presence of any pollutant with a cost-benefit value equal to or greater than 1 signifies the efficacy of the policy’s synergy. Consequently, Condition 2 can be further delineated as follows:
Data Sources and Preprocessing
To prevent overestimation of the economic and pollution linkage resulting from imports, we utilize China’s 2020 non-competitive input-output table from the National Bureau of Statistics to calculate our data. Energy consumption data for each sector are extracted from the 2021 Chinese Energy Statistics Yearbook. Aligned with China’s air pollution prevention and control policies and the air pollution statistical bulletin released by the Ministry of Ecology and Environment (MEE), our analysis focuses primarily on three key air pollutants: SO2, NOX, and particulate matter (Dust). Specific emission data for these pollutants are sourced from the 2021 Chinese Environmental Statistics Yearbook.
To ensure consistency with energy consumption and environmental emissions data, we aggregated sector classifications from various sources, resulting in a comprehensive input-output table featuring 29 sectors, as depicted in Table 2. While calculating pollutant emission coefficients, access to emission data from each sector is crucial. However, the Chinese Environmental Statistics Yearbook only provides emissions data from agricultural, industrial, mobile, and domestic sources, with emissions from the tertiary sector notably absent. According to the 2016–2019 National Ecological and Environmental Statistics Bulletin, domestic sources encompass emissions from the tertiary sector, as well as urban and rural residential pollution, while mobile sources include emissions from motor vehicles. Given that motor vehicle usage spans various sectors such as construction, transportation, storage, postal services, and other tertiary and residential sectors, pollutant emissions primarily arise from fossil fuel consumption. To distribute emissions from the construction, transportation, storage, postal, other tertiary sectors, and residential sectors, we propose allocation based on the proportion of residential and mobile sources relative to their respective energy consumption.
Furthermore, the calculation of CO2 emissions from each sector follows the methodology outlined in the 2006 IPCC Guidelines for National Greenhouse Gas Inventories. This involves a bottom-up, step-by-step approach utilizing energy consumption and carbon emission coefficients for each sector. Based on sector-specific energy consumption data published in the Energy Statistics Yearbook, we mainly select eight energy categories (coal, coke, crude oil, gasoline, kerosene, diesel, fuel oil, and natural gas) for calculation, employing the following formula:
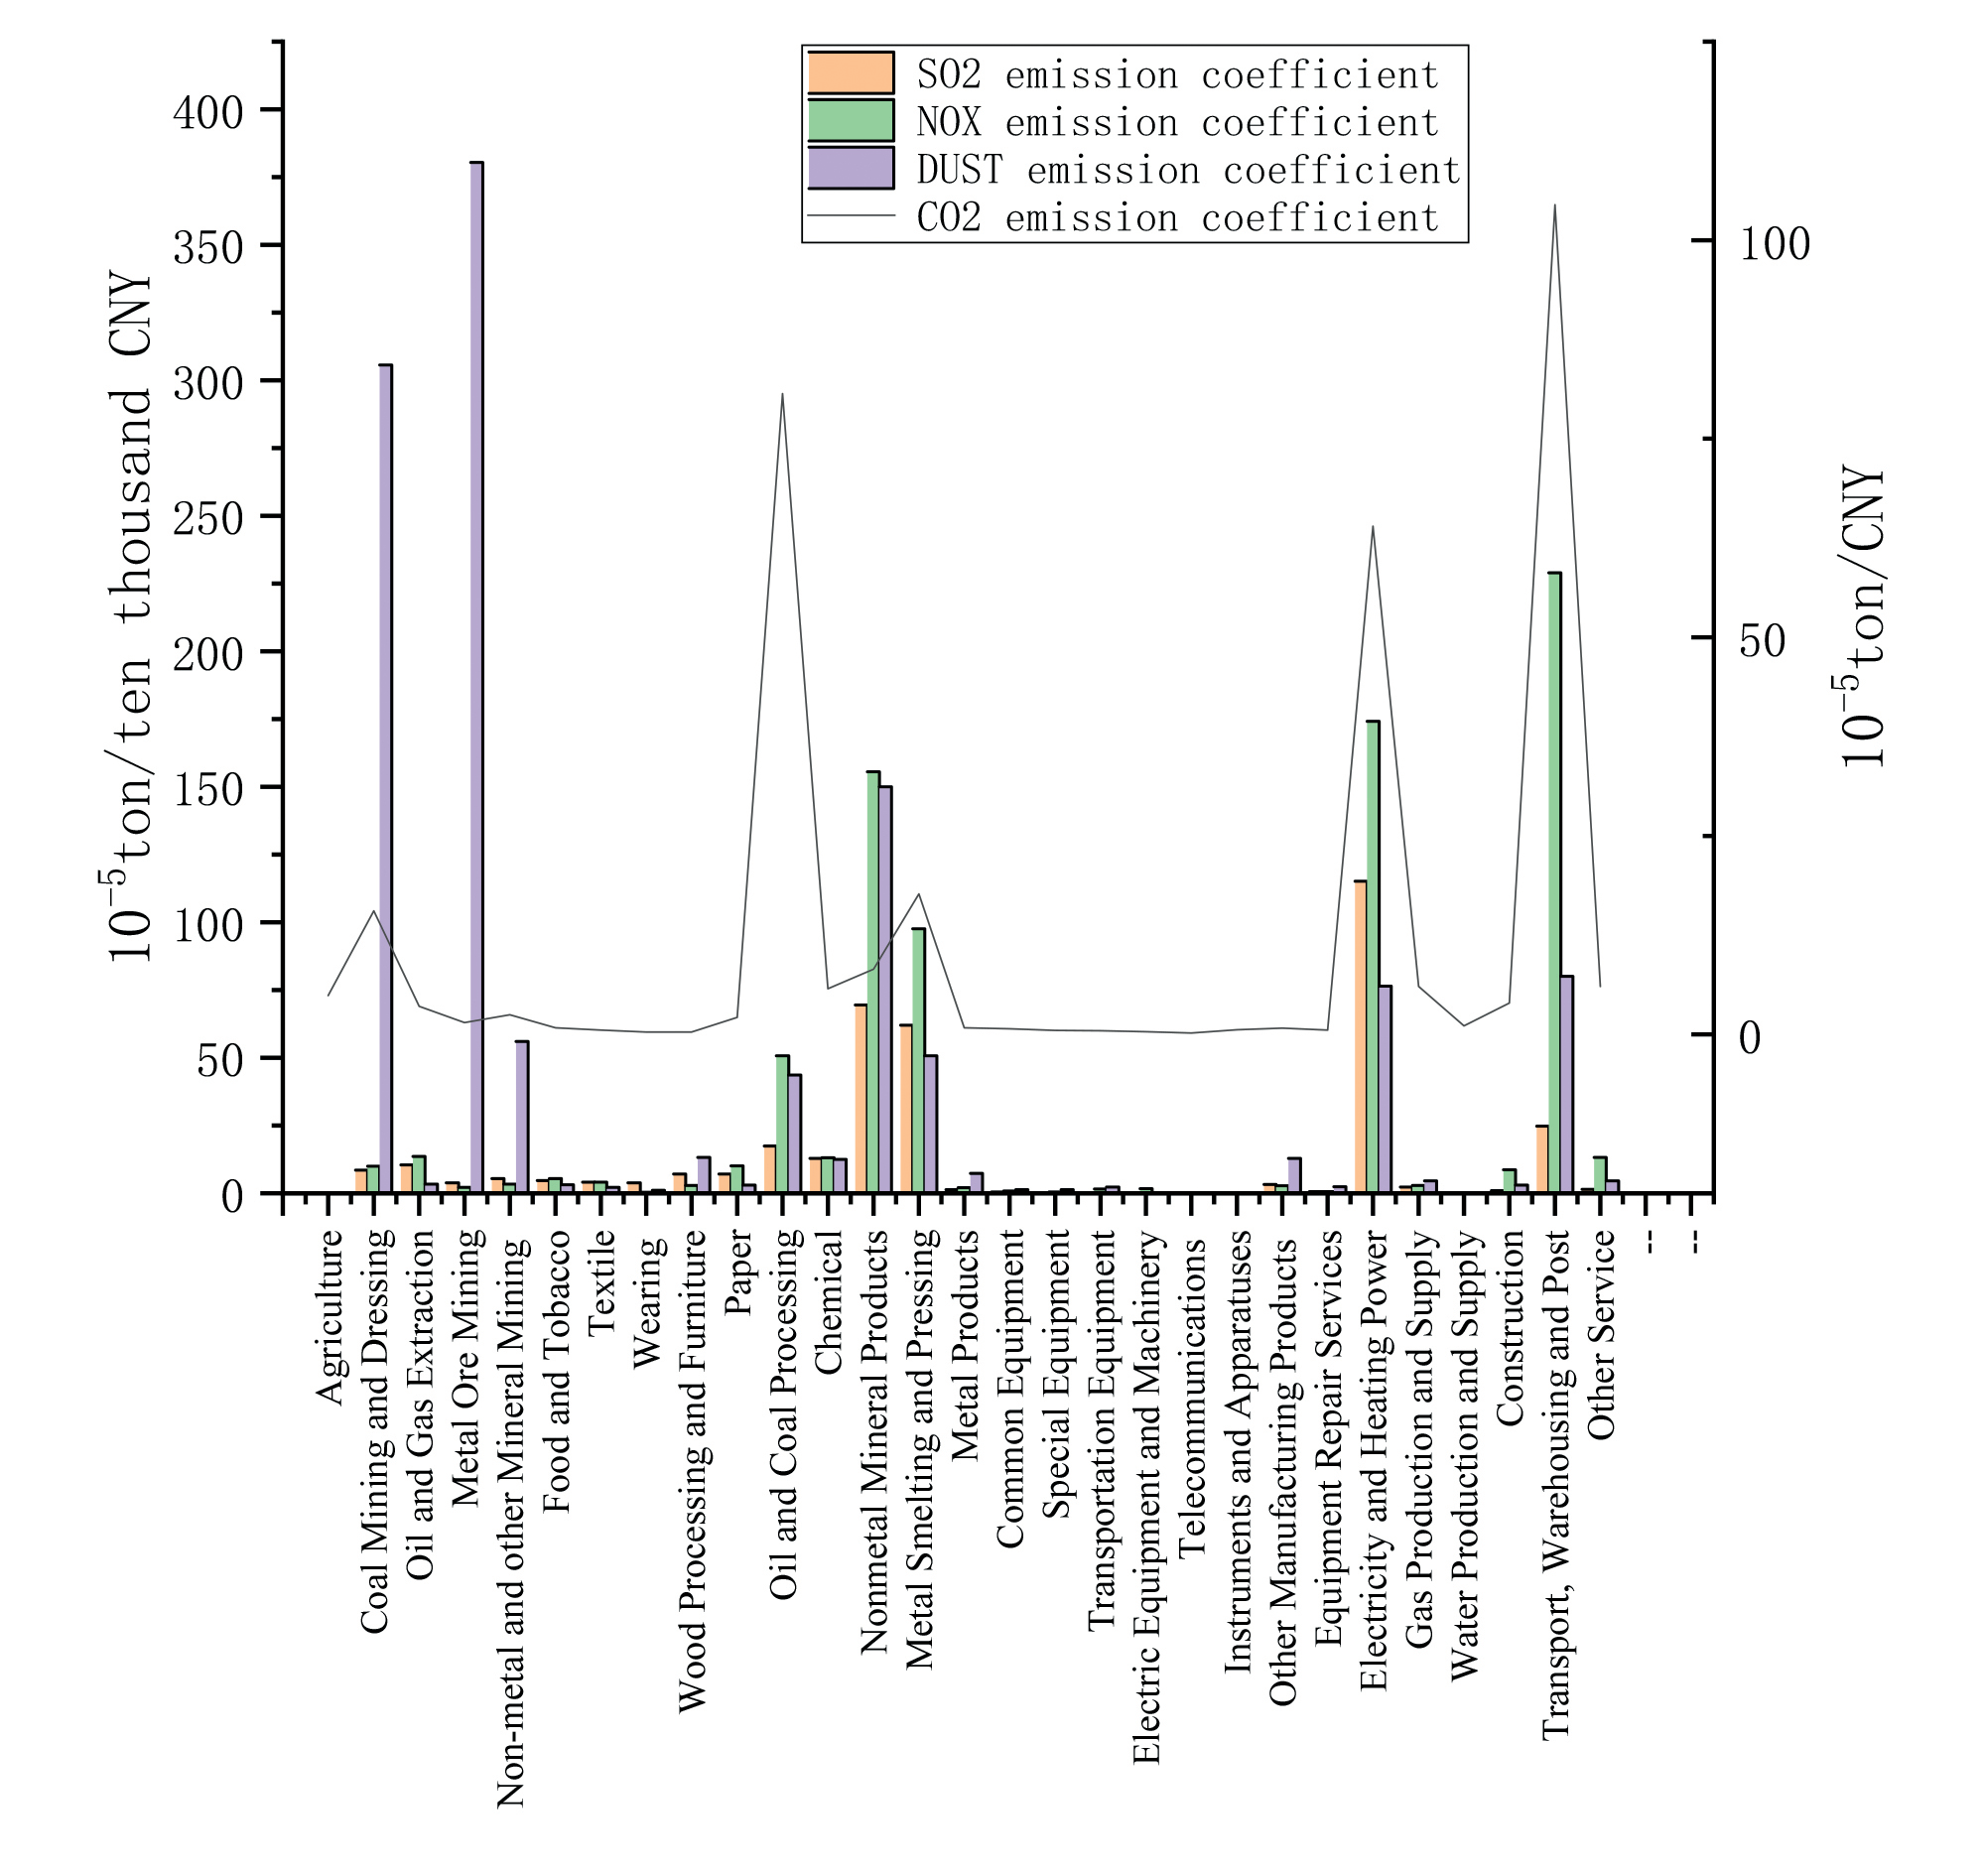
Fig. 2.
Results of emission coefficients in 29 sectors. Notes: The left y-axis represents SO2, NOX and Dust emission coefficients. The right y-axis represents CO2 emission coefficient.
Where i represents sector, j represents energy types, Ei,j is sector i’s consumption of energy j, δj is the CO2 emission coefficient of energy j, NCVj, CFj, COFj represent the average low-level heat generation, carbon content per unit calorific value, and carbon oxidation factor of energy j, respectively.
Results and Discussion
Carbon Dioxide and Pollutants Emission Coefficients of Each Sector
When utilizing Input-Output models to calculate the inter-sector linkage values of carbon dioxide and pollutant emissions, it is necessary to compute the emission coefficients of carbon dioxide and various pollutants for each sector. Fig. 2 shows the emission coefficients of carbon dioxide and other pollutants for 29 sectors. From Fig. 2, it is evident that there are significant differences among the emission coefficients across different sectors, and even within the same sector, there are notable variations among different types of emissions. Specifically, the maximum CO2 emission coefficient is 0.001044 ton/CNY, while the minimum is 1.67E-06 ton/CNY. The maximum SO2 emission coefficient is 0.000695 ton/ ten thousand CNY, with a minimum of 7.37E-08 ton/ten thousand CNY. Similarly, the maximum NOX emission coefficient is 0.00229 ton/ten thousand CNY, and the minimum is 1.23E-07 ton/ten thousand CNY. Lastly, the maximum Dust emission coefficient is 0.003804 ton/ten thousand CNY, and the minimum is 1.47E-07 ton/ten thousand CNY. Further analysis reveals that the difference between the maximum and minimum values ranges from 102 to 105. The main reason for these differences in emission intensity lies in the production structure of each sector. For instance, Transportation, Electricity Generation, and Oil and Coal Processing are energy-intensive industries, which is why they have higher carbon emission intensities. On the other hand, industries like Telecommunications, Instruments, and Equipment have lower energy demands, resulting in lower carbon emission intensities. These disparities, both within and between sectors, underscore the varying policy effects resulting from different combinations of covered sectors. Additionally, it indicates that merely selecting covered sectors based on total carbon emissions or carbon intensity cannot guarantee cost-effectiveness and the synergistic effects of pollution reduction and carbon mitigation in carbon markets.
Average Complete Linkage Values of Each Sector
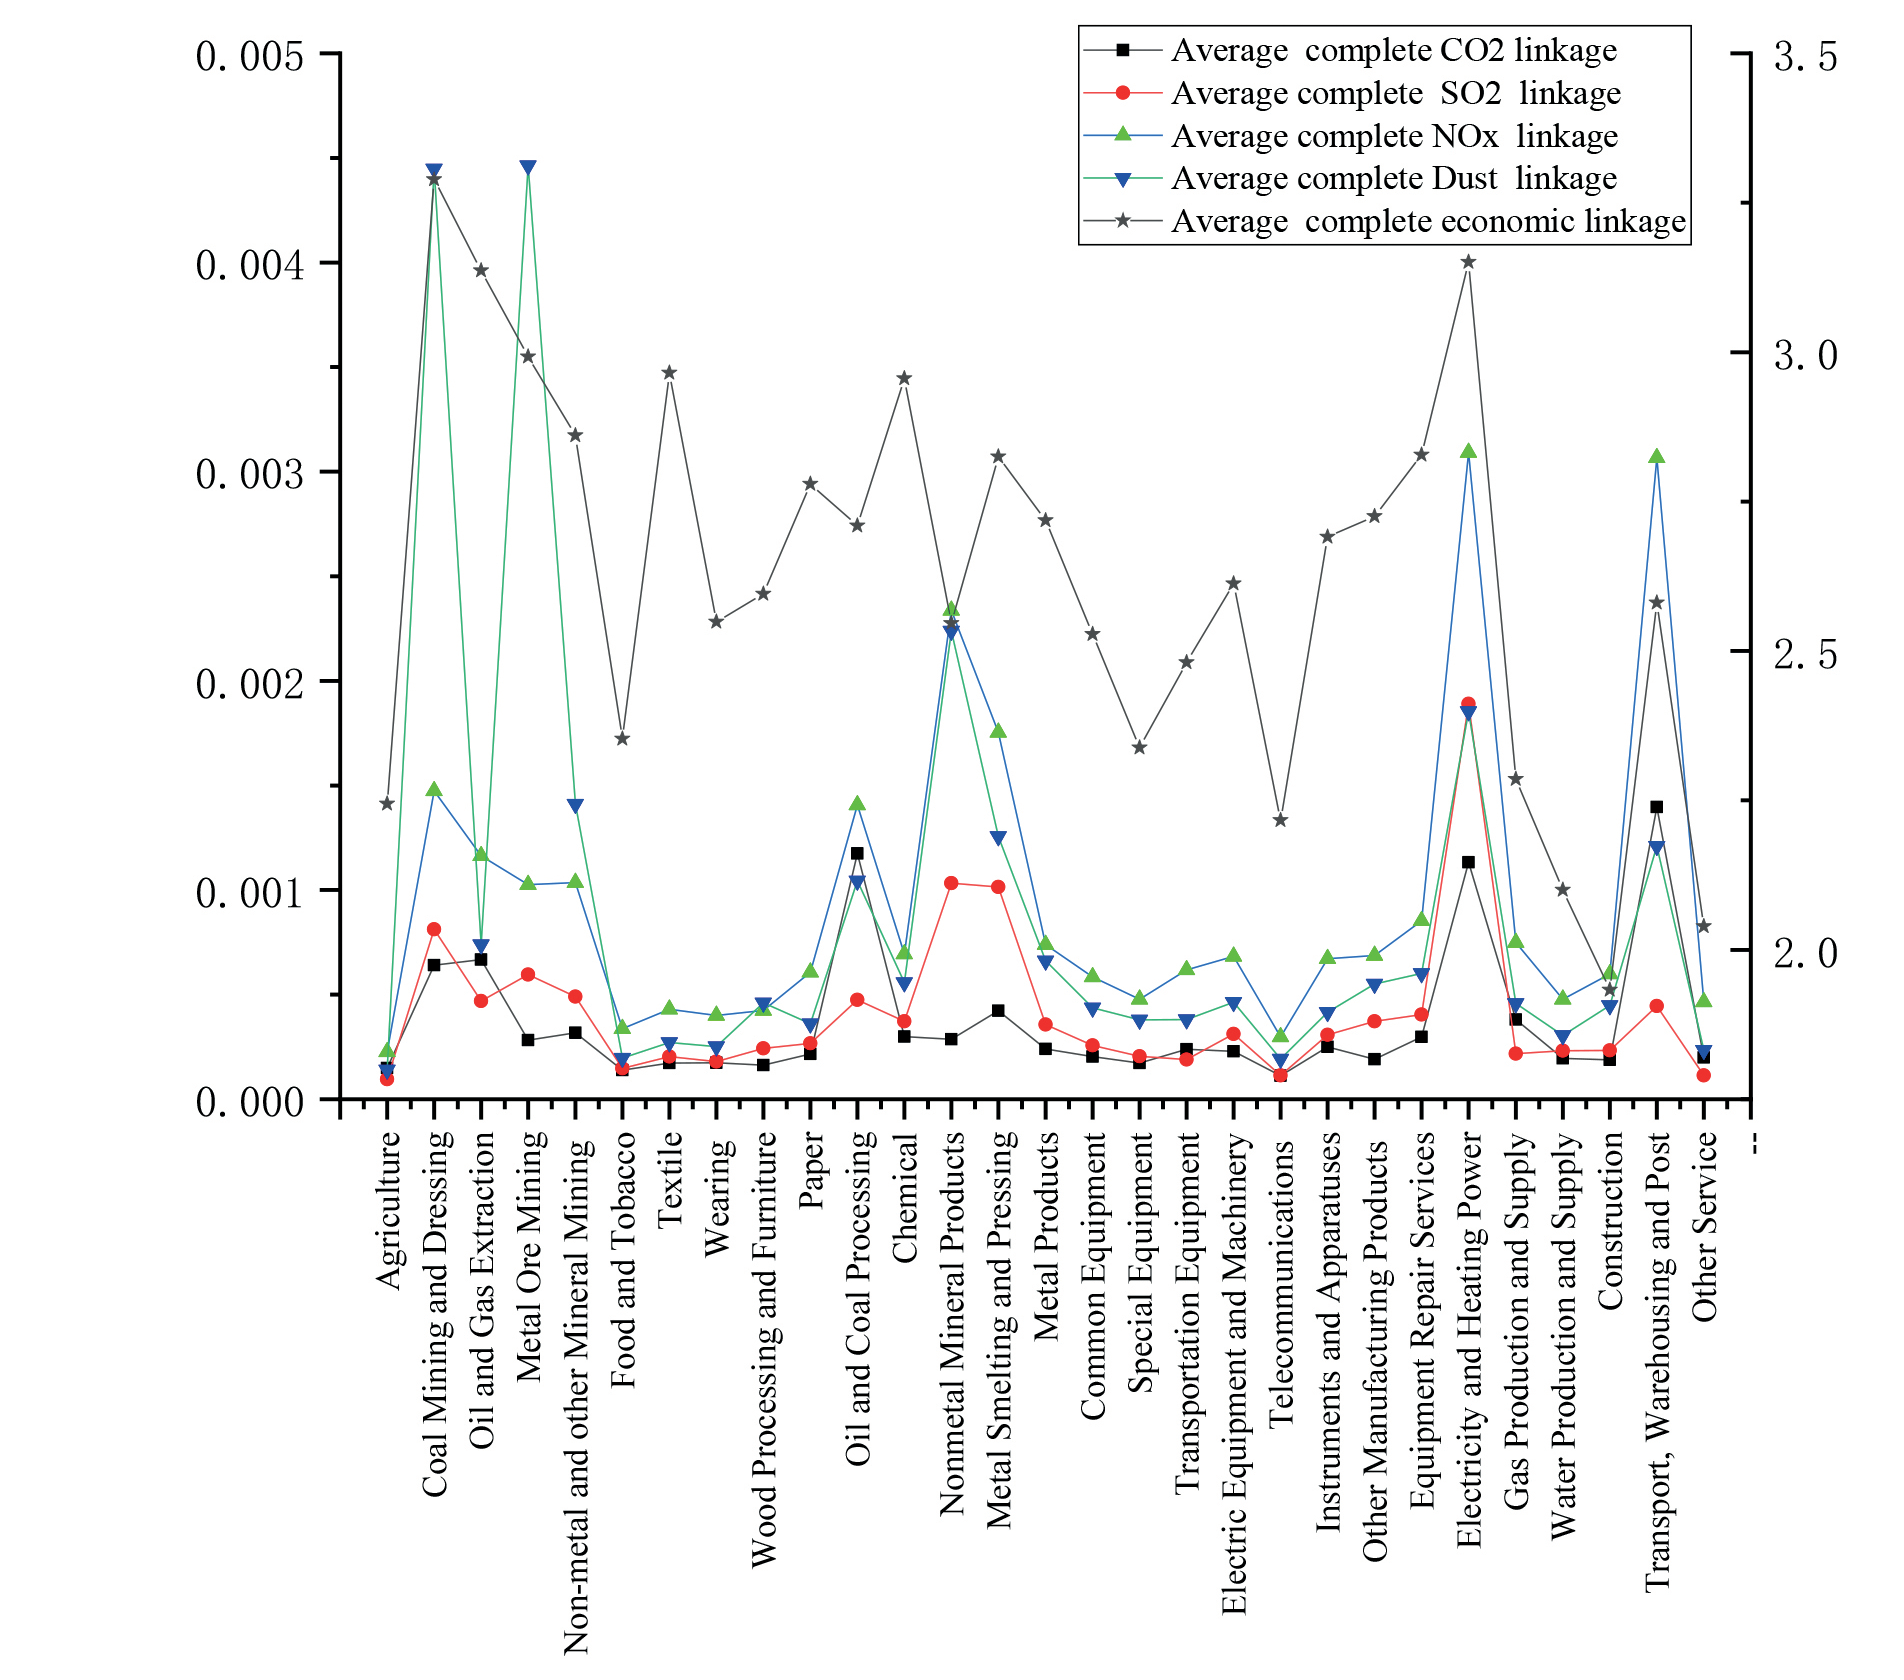
The magnitude of linkage values can reflect the impact of changes in output per unit of sector on the overall economic environment. After obtaining the emission coefficients of various sectors, various average linkage value results can be obtained according to Eq. (4, 8–10), as shown specifically in Fig. 3. From Fig. 3, it can be observed that there are significant differences in both inter-sectors and different types of average linkage values. Firstly, in terms of various average complete linkage values, for the economic average complete linkage value, the Construction sector is the lowest while the Coal Mining and Dressing sector is the highest; for the CO2 average complete linkage value, the Telecommunications sector is the lowest while the Transport, Warehousing, and Post sectors are the highest; for the SO2 average complete linkage value, Agriculture sector is the lowest while Electricity and Heating Power sector is the highest; for the Dust average complete linkage value, the Agriculture sector is the lowest while the Metal Ore Mining sector is the highest. Secondly, in terms of individual sectors, the performance of various average complete linkage values of each sector varies, such as the high economic average complete linkage values in the Textile sector and Chemical sector, but low values for other types of average linkage values; the Metal Ore Mining sector has a low CO2 average complete linkage value, but has high SO2, NOX, and Dust average complete linkage values. There are two main factors that contribute to this phenomenon: the first is the differences in energy structures across various sectors; the second is that different sectors have different positions in the chain. With technological development and the impact of the COVID-19 pandemic, the structure of the industry has changed, and the construction sector has played a decreasing role in pulling the Chinese economy on the whole.
These observations indicate that a higher average complete economic linkage value does not necessarily correlate with higher average complete CO2 or air pollutant linkages. Similarly, a higher average complete CO2 linkage does not imply a higher average complete linkage of air pollutants. Therefore, to better comprehend the impact of each sector due to carbon markets, calculating the cost-benefit values for each sector becomes imperative.
Selection of Covered Sectors Based on Cost-Benefit Value
To assess the impact of various sectors within the carbon market policy framework, this study further calculates the cost-benefit values of carbon emissions and various pollutants for each sector using Eq. (12), as detailed in Table 3.
As per the theoretical analysis section earlier, a cost-benefit value exceeding 1 indicates that the cost-benefit ratio resulting from a unit output change in the sector sector surpasses the average cost-benefit ratio. In other words, a higher cost-benefit value signifies that the emission change per unit output change exceeds the average emission change. Therefore, higher cost-benefit values imply lower overall economic costs for equivalent emission changes. From Table 3, it is evident that the Coal mining and Dressing sector, Oil and Gas extraction sector, Oil and Coal Processing sector, Metal Smelting and Pressing sector, Electricity and Heating Power sector, and Transport, Warehousing, and Post sectors exhibit carbon emissions cost-benefit values exceeding 1, alongside at least one pollutant. In accordance with the selection criteria for covered sectors, incorporating these sectors into the national carbon market can enhance policy effectiveness while promoting synergy between pollution control and carbon reduction. Additionally, although certain sectors fail to meet the criteria for inclusion in the carbon market, they demonstrate high cost-benefit values for one or more pollutants. For example, the Metal Ore Mining sector displays elevated cost-benefit values for sulfur dioxide and particulate matter, while the Non-metal and other Mineral Mining sectors and the Nonmetal Mineral Products sector exhibit notable cost-benefit values for pollutants apart from carbon emissions. These observations provide significant reference points for subsequent policy formulation aimed at strengthening single pollutant control efforts.
Incorporating findings from covered sectors alongside the eight major emitting sectors (petrochemical, chemical, building materials, non-ferrous metals, paper, steel, electric power, and aviation), it is apparent that the selected covered sectors align predominantly with these key sectors. However, it is noteworthy that our study meticulously screened various sub-sectors within these major sectors based on effectiveness and synergy criteria. This rigorous approach aimed to refine sectoral coverage for enhanced policy cost-effectiveness within the carbon market. In addition, the Paper sector, Nonmetal Mineral Products sector, and Chemical sector are absent from our sectoral calculations for two reasons: firstly, our study’s carbon dioxide emissions calculation only encompasses emissions from energy consumption, potentially underestimating emissions from paper production processes. Secondly, our sector selection criteria extend beyond carbon reduction to include synergies between pollution control and carbon mitigation. As illustrated in the table, the cost-benefit analysis consistently indicates lower pollutant emission values for the Paper sector, Nonmetal Mineral Products sector, and Chemical sector compared to the average, indicating a misalignment with the sector selection criteria applied in this study.
Further Analysis
Drawing from the operational experiences of international carbon markets, it is evident that gradually expanding the coverage scope is a relatively feasible approach to alleviate the substantial negative impact of the carbon market on the economy. Different sequences of inclusion would lead to various timings and levels of emission reduction pressure among covered sectors, resulting in distinct short-term impacts and long-term effects on the overall economic structure without accounting for emission reduction potential and technological advancements. Policy adjustments will take some time; unreasonable sequencing could prematurely or belatedly burden certain covered sectors with emission reduction responsibilities, amplifying macroeconomic adjustment challenges and escalating the costs of energy transition and industrial upgrading. Thus, it is crucial to design the sequence of inclusion balancing emission reduction pressure and economic costs.
Table 3.
Results of cost-benefit values in 29 sectors.
Currently, the selection of China’s first carbon market coverage sector (the power sector) is simply based on the maturity of the data acquisition technology. However, with the subsequent enhancement of data statistics technology, overlooking the roles of various sectors in economic operations can lead to significant economic costs, thereby affecting the sustainable development of the economy. In the following, this paper will give the rationale for inclusion order from the perspective of balancing emission reduction and economic cost, which will provide an important reference for the subsequent expansion of the carbon market.
As we all know, carbon intensity reflects the carbon emissions corresponding to a unit of output value. The larger the value, the lower the economic cost. Meanwhile, as we know from the above, the cost-benefit value is the ratio of emission reduction to economic cost, and accordingly, the higher the cost-benefit value, the lower the economic cost. The obvious difference is that the cost-benefit value is calculated on the basis of the ratio of the overall emission reduction caused by the change of the output value of a certain sector unit to the overall economic cost, while the carbon intensity only takes into account the change of the direct emissions and direct costs, and the calculation results are more limited. Since the reduction of any one of SO2, NOX, and Dust reflects the synergistic function of the carbon market, the weights of the three pollutants are considered equal in this paper. Combined with the cost-benefit values calculated in Eq. (12), this paper constructs a comprehensive indicator as the basis for the selection of the inclusion order, as shown in Eq. (14).
Table 4.
Inclusion order of covered sectors under three scenarios.
Where ω1, ω2 represent the weight of carbon and air pollutant cost-benefit values, respectively, ω1 + ω2 = 1. By setting varied weights, we can derive the corresponding prioritization sequence for covered sectors. If the policy primarily aims to reduce CO2 emissions, we can achieve this by setting a higher ω1; When the policy targets to reduce both CO2 emissions and other pollutants, we could accomplish this by setting ω1 = ω2 = 1/2. To further assess variations among different sorting methods, this paper constructs three scenarios:
Scenario 1: Carbon intensity-based setup;
Scenario 2: Dual targets for reducing carbon dioxide and pollutants, ω1 = ω2 = 1/2.
Scenario 3: Emphasis on reducing carbon dioxide emissions, ω1 = 3/4, ω2 = 1/4.
Table 4 presents the order of inclusion for every sector across the three scenarios, calculated using Eq. (14).
The above table illustrates that the order of inclusion varies across the three scenarios, except for the Transport, Warehousing, and Post sectors, where the prioritization remains consistent. Comparing the inclusion order among Scenarios 1, 2, and 3 reveals that the difference between Scenario 1 and Scenario 3 is greater than that between Scenario 1 and Scenario 2, which, in turn, is greater than that between Scenario 2 and Scenario 3. This suggests that determining the inclusion order solely based on carbon intensity indicators may incur significant economic costs, particularly when aiming to promote the reduction of carbon dioxide emissions. Given that the primary objective of current carbon market policies is emission reduction, this paper recommends adopting the inclusion order from Scenario 3 as a reference for the future expansion of the carbon market.
Conclusions
As an important market-based approach for achieving carbon dioxide emissions reduction, well-designed carbon market mechanisms will contribute to promoting the process of pollution reduction and carbon mitigation in China while reducing policy costs. With the increasing pressure of environmental governance and the stabilization of carbon market operations, a scientific expansion plan for the carbon market can facilitate the realization of its maximum efficiency, which can also provide valuable references for other countries’s carbon markets.
Based on Input-Output models, this paper constructs cost-benefit values for various pollutants. The selection criteria for sectors to be covered are established with the goal of minimizing economic costs while achieving synergistic effects in pollution reduction and carbon mitigation. Additionally, a sequential inclusion plan for subsequent sectors is proposed, which can provide scientific and theoretical support for the expansion of the carbon market. Our research reveals that within China’s plan to expand its carbon market to cover eight major sectors, certain sub-sectors, such as the Gas Production and Supply sector, show lower synergy in pollution reduction and carbon mitigation. Additionally, sub-sectors like the Metal Ore Mining sector, Non-metal and other Mineral Mining sector, Chemical sector, and Nonmetal Mineral Products sector demonstrate lower cost-effectiveness in reducing carbon emissions. Merely relying on carbon intensity for determining the inclusion sequence of sectors can lead to substantial economic costs. With the identification of the key goals of the emission abatement policy, it is essential to determine the order of sectoral inclusion based on cost-benefit values.
Based on the conclusions drawn above, this paper proposes three key policy recommendations:
1. Refining Sector Classification within the Carbon Market.
A diverse range of covered sectors will foster greater market influence, enhance trading activity, facilitate the discovery of reasonable carbon prices, and reduce economic costs. Current expansion plans for the carbon market only provide definitions at the level of major sector categories. As concluded in this paper, certain sub-sectors within these major categories exhibit poor emission reduction performance and should not be included in the carbon market. Additionally, some sub-sectors lack synergy in pollution reduction and carbon mitigation, the inclusion of which would escalate overall environmental policy costs. In contrast, the analytical framework presented in this paper proposes a relatively detailed scheme, which to some extent improves policy efficiency.
2. Optimizing the Sequence of Sector Inclusion.
Gradually expanding the coverage of sectorial sectors in the carbon market is an important pathway to enhance its effectiveness. Due to the high cost and lag effect of policy adjustments, unreasonable policy schemes often lead to significant economic and social welfare effects. According to the conclusions of this paper, the sequencing of sectors to be adopted should be based on policy objectives. By assigning different weights to various cost-benefit values, the sequencing with the lowest economic cost can be achieved. Additionally, the number of sectors covered in a single implementation also affects the effectiveness of the policy. Therefore, in policy formulation, a more detailed sequencing should be set by further considering the maximization of intertemporal benefits.
3. Enhancing Emission Accounting Systems.
Urgent improvements are needed in the carbon dioxide and pollutant emission accounting systems for each sector. Current environmental statistics systems suffer from deficiencies, including incomplete pollutant data and inadequate accounting standards, undermining the fairness of carbon market transactions. Inadequate data availability excludes some sectors from the carbon market. Accurate data is essential for informing future carbon market policies and improving operational efficiency. Relevant authorities should promptly develop comprehensive environmental statistical indices and detailed accounting methods, establishing accessible data platforms.
In addition, it is important to note that this paper analyzes 29 sectors based on available data types. However, to thoroughly investigate the synergistic effects of pollution and carbon reduction across various sectors, it is crucial to gather more comprehensive data through diverse methods. The short-term effects presented here are derived from the Input-Output model and can serve as a basis for short-term policy adjustments. Future research should focus on enhancing data acquisition and refining analysis methods to offer more precise and reliable policy recommendations for enhancing the carbon market.

