

Introduction
Mountainous regions offer substantial economic benefits [1], and their abundant resources provide a robust material foundation for human socio-economic development [2]. However, in comparison to plains and basins, mountainous regions characterized by intricate topography exhibit heightened susceptibility to climate variability and geological disasters [3], thereby exacerbating the degradation of both EGE. Recently, with the acceleration of socio-economic development and the acceleration of urbanization and industrialization, the burden on natural resources has been escalating. Consequently, issues such as environmental pollution and geological hazards have become increasingly prominent [4]. Moreover, mountainous regions have also been impacted by environmental pressures, socio-economic changes, and unsustainable exploitation of natural resources [5], resulting in severe degradation of EGE in these areas. At the same time, the degradation of EGE will hinder the attainment of improved levels of social and economic progress [6]. On the other hand, human beings' irrational utilization of mountain resources will significantly exacerbate the deterioration of their EGE [7]. In this context, objectively measuring the EGE as well as economic development in mountainous areas while exploring synergistic development between them has emerged as a pivotal issue to be addressed in this research.
In the realm of ecological environment monitoring, the utilization of remote sensing technology in many regions has been able to achieve visual observation and transparent inspection. Among them, [8] proposed the Remote Sensing Ecological Index (RSEI) model, which facilitates rapid monitoring and impartial assessment of regional ecological environment quality (EEQ) [9]. Nonetheless, only vegetation, soil, and water are included in the four ecological indicators involved in the RSEI model and cannot reflect the ecological environment of different regions [10]. Consequently, different regions should emphasize their unique ecological environment attributes based on specific conditions and topographic features. In this vein, scholars have undertaken region-specific improvements. For instance, [11] enhanced the assessment of forest EEQ by incorporating Forest Canopy Height (FCH) and Vegetation Cover (FVC) into the TDRSEI model. Similarly, [12] developed a modified remote sensing ecological index (MRSEI) for arid areas by incorporating the desertification monitoring index (DMI) and salinity monitoring index (SMI). [13] incorporated black particulate matter into the MRSEI model to assess EEQ in a coal mining area. The aforementioned studies enhanced the RSEI in several domains. Disasters such as earthquakes, mudslides, landslides, and landslides in mountainous areas occur frequently, often causing serious damage [14] and seriously jeopardizing the life safety and social life of local residents. Therefore, for mountainous areas with diverse ecological environments and complex geological formations, the EGE should be considered, and the monitoring of mountainous environments requires the introduction of geologic factors based on RSEI, but a reasonable EGE quality evaluation system has not yet been established for mountainous areas.
The research and monitoring of the natural environment is ultimately aimed at guiding human practice and achieving high-quality development of society so as to realize a harmonious coexistence between humanity and nature [15]. Undoubtedly, the study of the synergetic development of the natural environment and social economy is an intricate, systematic problem. Therefore, it is fundamental to explore and evaluate the sustainability of the regional natural environment and social economy. In previous studies, [16] employed a fixed effect regression model to assess the spatial-temporal characteristics between socio-economic variables and EEQ in urban agglomeration. [17] simulated the "inverted N-type" geometric curve association between the EEQ and economic growth through the Environmental Kuznets Curve (EKC) model. [18] utilized the vector autoregressive model (VAR) to examine the processes of evolution within the realms of population, economics, and the eco-geological environment, while [19] constructed a random effects panel Tobit model to examine driving factors influencing China's new urbanization coordination level with agroecological environment. Although scholars have explored natural environment and socio-economic development from various perspectives, few studies have delved further into understanding the synergistic relationship between EGE and economic development. Additionally, existing research has paid limited attention to mountainous areas, instead focusing more on coordinated development in urban areas [20, 21], watershed regions [22], tropical zones [23, 24], basins [25], or coastal areas [26-28]. Therefore, it is imperative to bridge this research gap by investigating the coordinated development of natural environments and social economies, specifically in mountainous regions.
In summary, existing studies have the following shortcomings: (1) When measuring the EGE, the traditional RSEI index model ignores the influence of geological conditions on the mountain environment and cannot comprehensively reflect the EGE quality of mountainous areas. (2) Few studies have investigated the synergistic association between economic development and EGE in mountainous areas, which does not support the realization of high-quality development of mountainous societies and natural environments. Therefore, this study improves the RSEI by incorporating geologic factors in a conventional mountainous region, using the CCD model to examine the correlation between EGE and economic development. This approach offers a new research perspective for promoting high-quality economic development in mountainous regions.
There are two main innovations and contributions in this study: (1) The four indexes of Elevation (DEM), Slope, Topographic Relief (RDLS), and Aspect, which can reflect geological conditions, were introduced. Together with the four indicators of greenness, wetness, dryness, and heat, the GRSEI model was reconstructed for spatial-temporal analysis, and the EGE quality of the TGRA was assessed by ENVI software. (2) Taking a typical mountainous area of the TGRA as an example, the CCD model was utilized to systematically investigate the synergistic association between EGE and economic development. This study aims to offer policy recommendations for policymakers to facilitate high-quality development in mountainous regions while establishing a crucial evaluation foundation for environmental conservation and sustainable development in such areas.
Study Area and Data Sources
Study Area
The TGRA is situated within the Yangtze River's upper and middle portions, including 26 districts and counties under the jurisdiction of Chongqing Municipality and Enshi Prefecture, as well as Yichang City in Hubei Province. The geographic coordinates of the TGRA are between 106°00'-111°59'E and 29°16'- 31°25'N, with around 57,500 km² total area. The TGRA represents a representative mountainous region, with the landform dominated by hill and mountainous [29], of which the hilly makes up about 22% and the mountainous about 74% [30]. It also has a complex geological structure, a great deal of terrain variation [31], and a maximum elevation difference of more than 500 meters. Additionally, the area has an ecologically fragile environment by nature, and the abundance of mountains and land readily causes soil erosion [32]. All districts along the river in the TGRA have varying degrees of ecological environment, natural disasters, mineral resources, and other geological problems. The TGRA is vital to the Yangtze River basin, as its eco-geological environment is relatively fragile, making it a major ecologically protected area in China [33]. The TGRA is a representative mountainous area that has long been impacted by both human activity and earthquakes so it often encounters geological disasters, mudslides, landslides, and other natural disasters. By 2016, there had been 481 earthquakes in the TGRA. Among them, 4,847 potential geological disasters were recorded, with 113 experiencing structural changes and poor stability [34].
In recent years, with the construction of the Three Gorges Project and the expansion of urbanization, the socio-economic structure of the TGRA has undergone significant changes. However, the unilateral pursuit of accelerated economic progress in the urbanization procedure of the TGRA has caused varying levels of harm to the surrounding ecological and geological surroundings, which has also increased the frequency of geohazards and put residents' lives, property, and quality of life in jeopardy. Therefore, there is an urgent need to answer the question of the coupled evolution of the EGE and socio-economic development in the TGRA.
Data Sources
Eco-Geological Data
The article utilizes remote sensing ecological data, namely MOD09A1 surface albedo data, MOD11A2 surface temperature data, and MOD13A1 vegetation index data obtained from MODIS product data. The time for acquiring remote sensing ecological data is from June to September 2002 to 2022, during which the vegetation growth season is in the TGRA, which is convenient in distinguishing vegetation from non-vegetation. When screening data, the data with less cloud cover and high quality are selected, and then the format conversion and reprojection of the initial MODIS data are carried out with the help of the MODIS Reprojection Tool (MRT). Convert Hierarchical Data Format (HDF) data to Tag Image File Format (Tiff) data format and complete spatial mosaic and resampling of images. The resampling is 250m×250m, the geographic coordinate system is World Geodetic System 1984 (WGS84), and the projection is Universal Transverse Mercator (UTM). The data for each index from June to September was calculated using the maximum synthesis method. An average value was then sought, and the resulting annual average index served as the foundation for the principal component analysis that followed.
The geological data used in this paper are GDEMV2 30M resolution digital elevation data from DEM data. First, ArcGIS software was used to extract the TGRA and generate the DEM index. Following pre-processing steps like mosaicking, cropping, and alignment, the three indicators—slope, topographic relief (RDLS), and aspect—were visualized.
Sources of Economic Data
The economic data used for the calculations in this research are mainly from the Statistical Yearbooks of Yichang City, Enshi Prefecture, and Chongqing Municipality, as well as the statistical bulletins of the economic and social development of each district and county from 2002 to 2022. Among them, the nighttime lighting data comes from the dataset shared by [35], which is the corrected China-wide class DMSP-OLS data year by year from 1992-2022 acquired by incorporating DMSP-OLS and SNPP-VIIRS data. In this paper, the software ArcGIS10.8 is used to extract the nighttime lighting data in the scope of the TGRA, and the average of the nighttime lighting data of each region in the TGRA during the period of 2002-2022 is obtained by calculation. For the missing part of economic data, the interpolation method is used to supplement.
Research Methods
Improved RSEI
This study examines the impact of terrain features and geohazards on EGE within the TGRA, as well as the significant role that slope plays in the distribution of soil and vegetation within the ecosystem. DEM, Slope, RDLS, and Aspect reflecting geological conditions are introduced to reconstruct the GRSEI model together with the four indexes of greenness, wetness, dryness, and heat, which comprehensively reflect the quality of EGE. The function can be represented as follows:
The following are the formulas for the ecological indicators:
(1) Greenness. It is customary to use the Normalized Difference Vegetation Index (NDVI) to track the state of vegetation and vegetation cover growth, so NDVI can be used to monitor the vegetation. The greenness index was extracted from the NDVI index of MOD13A1 [36].
(2) Wetness. The humidity component in the tasseled cap transform is related to soil moisture, and the humidity indicator can be represented by the humidity component WET in the tasseled cap transformation [37], with the following formula:
(3) Dryness. The index-based built-up indicator (IBI) and the bare soil index (SI) are chosen, which together affect surface dryness [38]. Consequently, the following formula can be used to create the dryness index by combining the two:
(4) Heat. The land surface temperature (LST) is selected to represent the heat index, which is a crucial metric that represents the transfer of substances and energy in soil, vegetation, and atmospheric systems [39]. The equation for LST is as follows:
where b1-7 represents the surface reflectance in the 1-7 band for the MOD09A1 product and ρ1 represents the LST band data in the MOD11A2 product.
Regarding the four geologic indicators introduced, as evident from Table 1.
Calculation of GRSEI
This study employs Principal Component Analysis (PCA) to objectively allocate weights based on the individual component's contribution to the primary components, which can reduce the bias resulting from subjective assignment and couple eight single indicators into one comprehensive index. The TGRA is rich in water and is connected by the Yangtze River, and the influence of the water body on the outcomes of the main component analysis is considerable. To truly reflect the EGE of the TGRA, the water body is masked with the help of the improved normalized difference water body index (MNDWI) [40], to avoid the impact on the load distribution of the PCA.
To mitigate the impact of varying indicator values, it is essential to normalize all indicators before doing principal component analysis, given their distinct dimensions. The normalization formula can be expressed as follows:
Of which IN is the standardized indicator value; I symbolize the initial value of the indicator; Imax and Imin denote the highest and lowest points of the indicator, respectively.
Then, the eight eco-geological indicators were subjected to principal component analysis after undergoing normalization, and the GRSEI was counted by ENVI software to acquire the original index GRSEI0. The formula for calculation is as follows:
Table 1.
Details of geological indicator data.
Table 2.
Economic development evaluation system of the TGRA.
Of which PC1 is the 1st principal component of PCA, and f specifies the method of normalization used for each factor.
To make comparing various periods easier, the obtained GRSEI0 values were normalized again to obtain the GRSEI values of the TGRA. The higher value of GRSEI represents the better EGE of the study area, and vice versa indicates the worse EGE. According to the related literature [41], this paper leverages the natural breakpoint method to categorize the EGE into five distinct levels, which are bad, poor, medium, good, and excellent grades, so as to mirror the spatiotemporal variation of GRSEI in the TGRA between 2002 and 2022.
System of Indicators for Evaluating Economic Development
Considering the objectivity and precision in determining the weights of the indexes, the method of calculating the weights of the economic development indicators in this research is the entropy weight method [42]. Based on a comprehensive literature review and considering the specific circumstances of the TGRA, this study selects evaluation indicators as presented in Table 3. The framework for assessing the economic development of the TGRA is then constructed by incorporating four first-level indicators: economic scale, economic performance, economic vitality, and economic structure. Additionally, twelve second-level indicators are chosen. The weights of each index are determined using the entropy weight method based on collected index data, and MATLAB software is utilized to obtain first-level index scores and comprehensive scores, which are then ranked according to their overall scores.
GDP per capita is used to assess the macroeconomic development of the zone. The wages of urban on-the-job workers reflect the remuneration of labor, which can more accurately indicate the degree of economic advancement, so it is included as one of the indicators for measuring the quality of the economy. Highway mileage represents the traffic condition of the city, which reflects the economic vitality of the regional society. The urbanization rate serves as the foundation for the growth of urbanization, and the concentration of population urbanization serves as the primary catalyst for regional economic development. The GDP growth rate reflects the growth of economic quantity, and only when the economic quantity grows to a certain stage can we pursue the economy's superior development. The main source of nighttime light data is the stable light generated by man-made activities in the urban area. High-brightness areas have a high degree of socioeconomic development. Therefore, nighttime light data are often used in the study of regional economic development. Table 2 displays specific indicators.
CCD Model
Coupling refers to the dynamic interplay and reciprocal impact between two or more systems. In economics, it is frequently used to estimate the systematic relationship between variables, elucidating the degree of interdependencies and mutual constraints inherent within these systems. The CCD model is widely utilized in social science and regional development research due to its ability to simultaneously consider multiple subsystems. It employs quantitative methods to evaluate the interaction and coordination between systems, providing intuitive and understandable results that are applicable to various scales and regions of empirical research. Furthermore, the standardized treatment and weight allocation methods of the model enhance the scientific and objective nature of its results. Its flexibility and modifiability enable it to adapt to different research needs, thus playing a crucial role in fields such as regional development and environmental management. This study utilizes the CCD model to evaluate the cooperative relationship between the EGE and economic development and evaluate the status of collaborative development between the two from the perspectives of coupling degree (C) and coupling coordination degree (D) [43]. The C is applied to evaluate the intensity of the relationship between the EGE and economic development in the TGRA. However, it may be observed that the coupling degree during low periods exhibits a higher value compared to that during high periods, which fails to precisely capture the overall degree of [44]. For this reason, this study adopts the D as an indicator to effectively judge the level of coordination between both systems.
The calculation formula in question is as follows:
E represents the quality of the EGE, determined by the average value of GRSEI in each zone; S represents the socio-economic condition. C denotes the coupling degree, which signifies the magnitude of the interaction. T is the comprehensive assessment value that serves as an indicator of the degree of coordination, with α and β denoting the contribution of the two systems, both set at 0.5 due to the equal importance of E and S. D symbolizes the level of coordination in the coupling of two systems, reflecting the degree of harmony between the EGE and economic development. The value spans from 0 to 1. The degree of cooperation between the two systems improves as the value of D grows, resulting in a more balanced development, while the lower the value, the level of coordination decreases, and the development becomes more uneven. If the systems cooperate properly and promote each other, it is benign coupling, and vice versa is malignant coupling. By referencing research and considering the level of development [45], the relationship between EGE and social economic growth is categorized into three categories and eight stages as depicted in Table 3.
Results
Measurement of the Quality of the EGE
As depicted in Fig. 1a, the regions with "poor" are primarily focused in Chongqing's nine major metropolitan areas. The EGE deterioration around these urban areas worsens over time, indicating that areas with higher population density and human activity experience more significant environmental issues. This shows that the denser the distribution of the area, the more frequent the human activities are, which leads to the eco-geologic problems becoming more prominent. Secondly, the areas with "poor" and "medium" grades are located around the main city of Chongqing, as well as beside the branch rivers and around the Yangtze River Basin. Finally, zones with "excellent" and "good" are primarily found within the Hubei section of the TGRA and in areas with significant slopes and terrain undulations. It can be seen that the steeper the terrain and the greater the undulation, the more it restricts human development activities, thereby helping to sustain a relatively high level of EGE.
Fig. 1b takes 2012 as the dividing line and divides the changes in the GRSEI of the TGRA into two periods, 2002-2012 and 2012-2022, and the results are shown in Fig. 1b. It can be found that: (1) During the period 2002-2012, the total EGE of the TGRA is at an optimal level. (2) Between 2012 and 2022, part of the area that had been improved in the previous period tended to deteriorate again. This indicates that human activities aimed at fostering social and economic progress during the previous decade have had some negative impacts on the EGE of the TGRA. (3) Over the last two decades, the area of improved EGE exceeds the area of deteriorated EGE, indicating that the overall EGE of the TGRA was optimized during the period from 2002 to 2022.
Table 3.
Coupling coordination development framework and phase division.
Fig. 1.
EGE changes in the TGRA from years 2002 to 2022 (a) spatiotemporal variation in GRSEI in the TGRA from 2002 to 2022 (b) quantitative changes in the transfer of EGE types (c) GRSEI changes in the TGRA from 2002 to 2022.
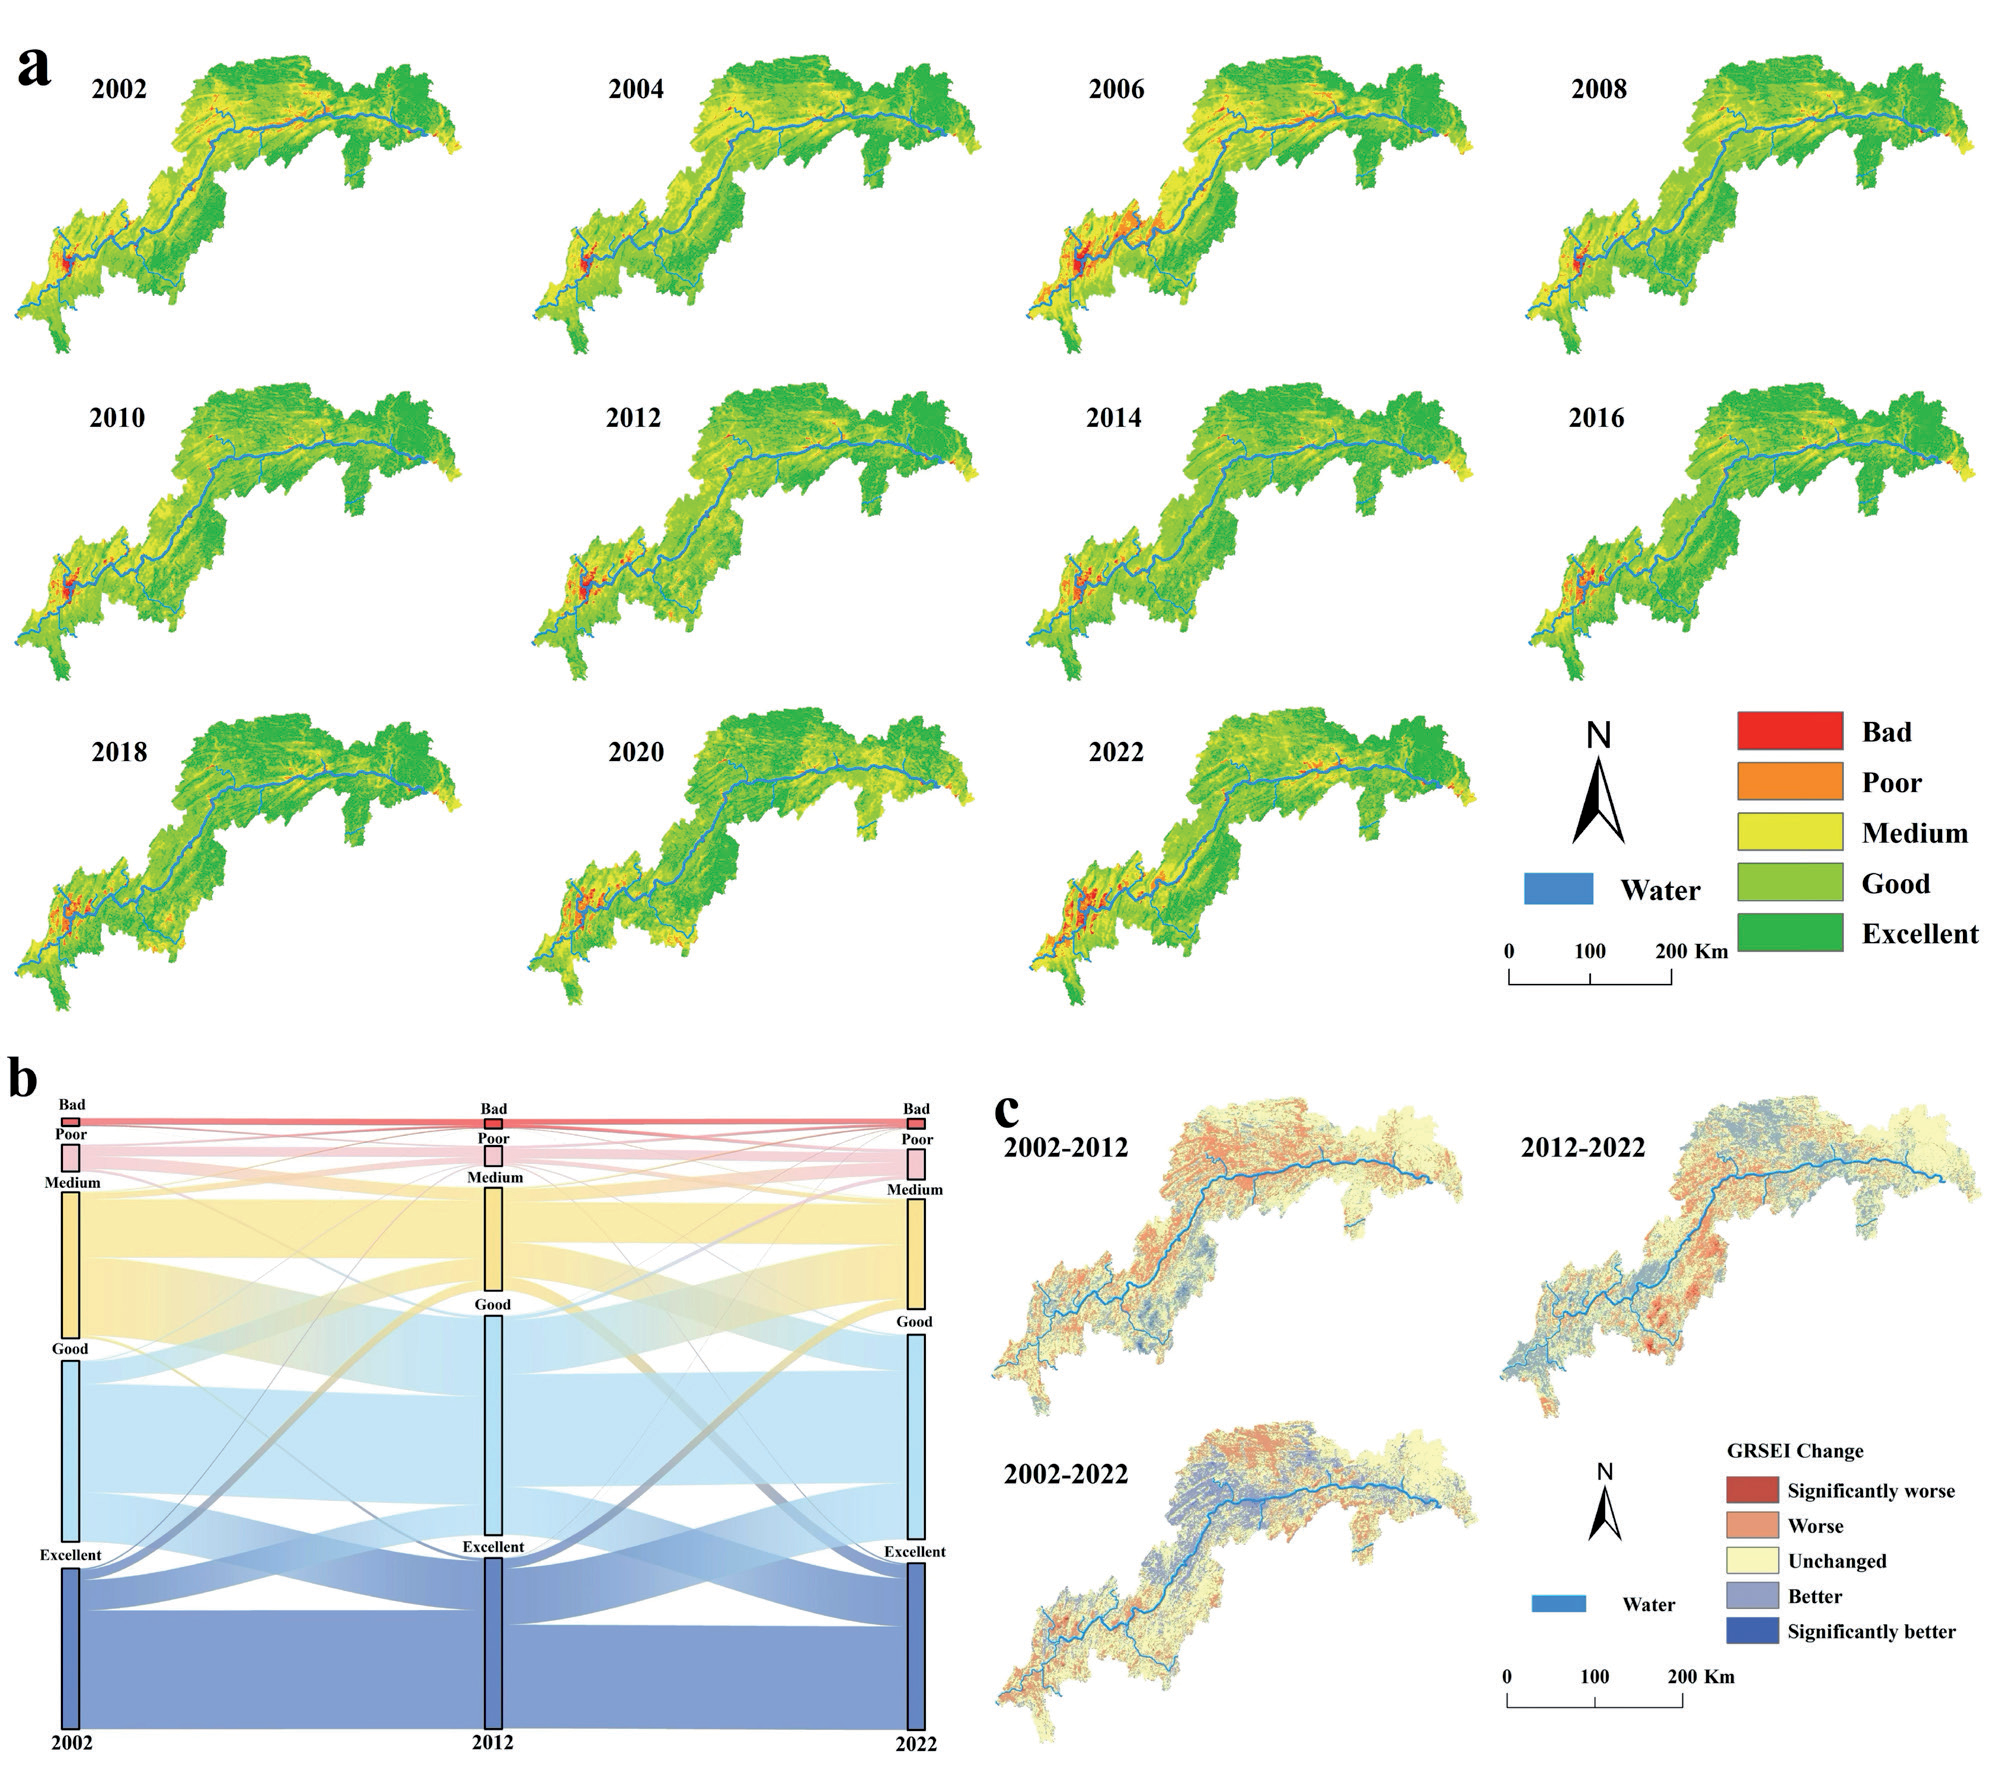
As shown in Fig. 1c, The EGE grade change is categorized into five grades: an obvious change if it's more than two grades, a general change if it's one grade, and no change if it remains the same. The changes in EGE quality grades in the TGRA are classified as "significantly worse," "worse," "unchanged," "better," and "significantly better". As depicted in Fig. 1c, from 2002 to 2012, the EGE quality in the southern part of the TGRA deteriorated significantly, and the trend of deterioration around the main urban area of Chongqing was not obvious. Between 2012 and 2022, the EGE in the southern areas of the TGRA showed improvement. Over the course of the previous two decades, the EGE in the Hubei section of the TGRA has shown the most stability, with minimal changes. Improved EGE quality is primarily found within the central segment of the TGRA, while areas experiencing "significantly worse" and "worse" in GRSEI are mainly located in the Chongqing area of the TGRA. The regions showing "significantly worse" and "worse" are primarily located within the western and eastern regions of Chongqing and near the primary metropolitan region of Chongqing. The primary metropolitan region of Chongqing has been deteriorating in the preceding two decades.
Drawing upon the EGE trend observed in the TGRA over the last 20 years, it is predicted that after 2022, the EGE will likely increase in the "poor" and "bad" categories, decrease in the "medium" categories, and remain stable in the "excellent" and "good" categories. Although the overall EGE of the TGRA has improved from 2002 to 2022, the environment in this area has been deteriorating over the past decade. It is likely that without intervention, the EGE of the TGRA will continue to decline and may even be worse than it was in 2002.
Fig. 2.
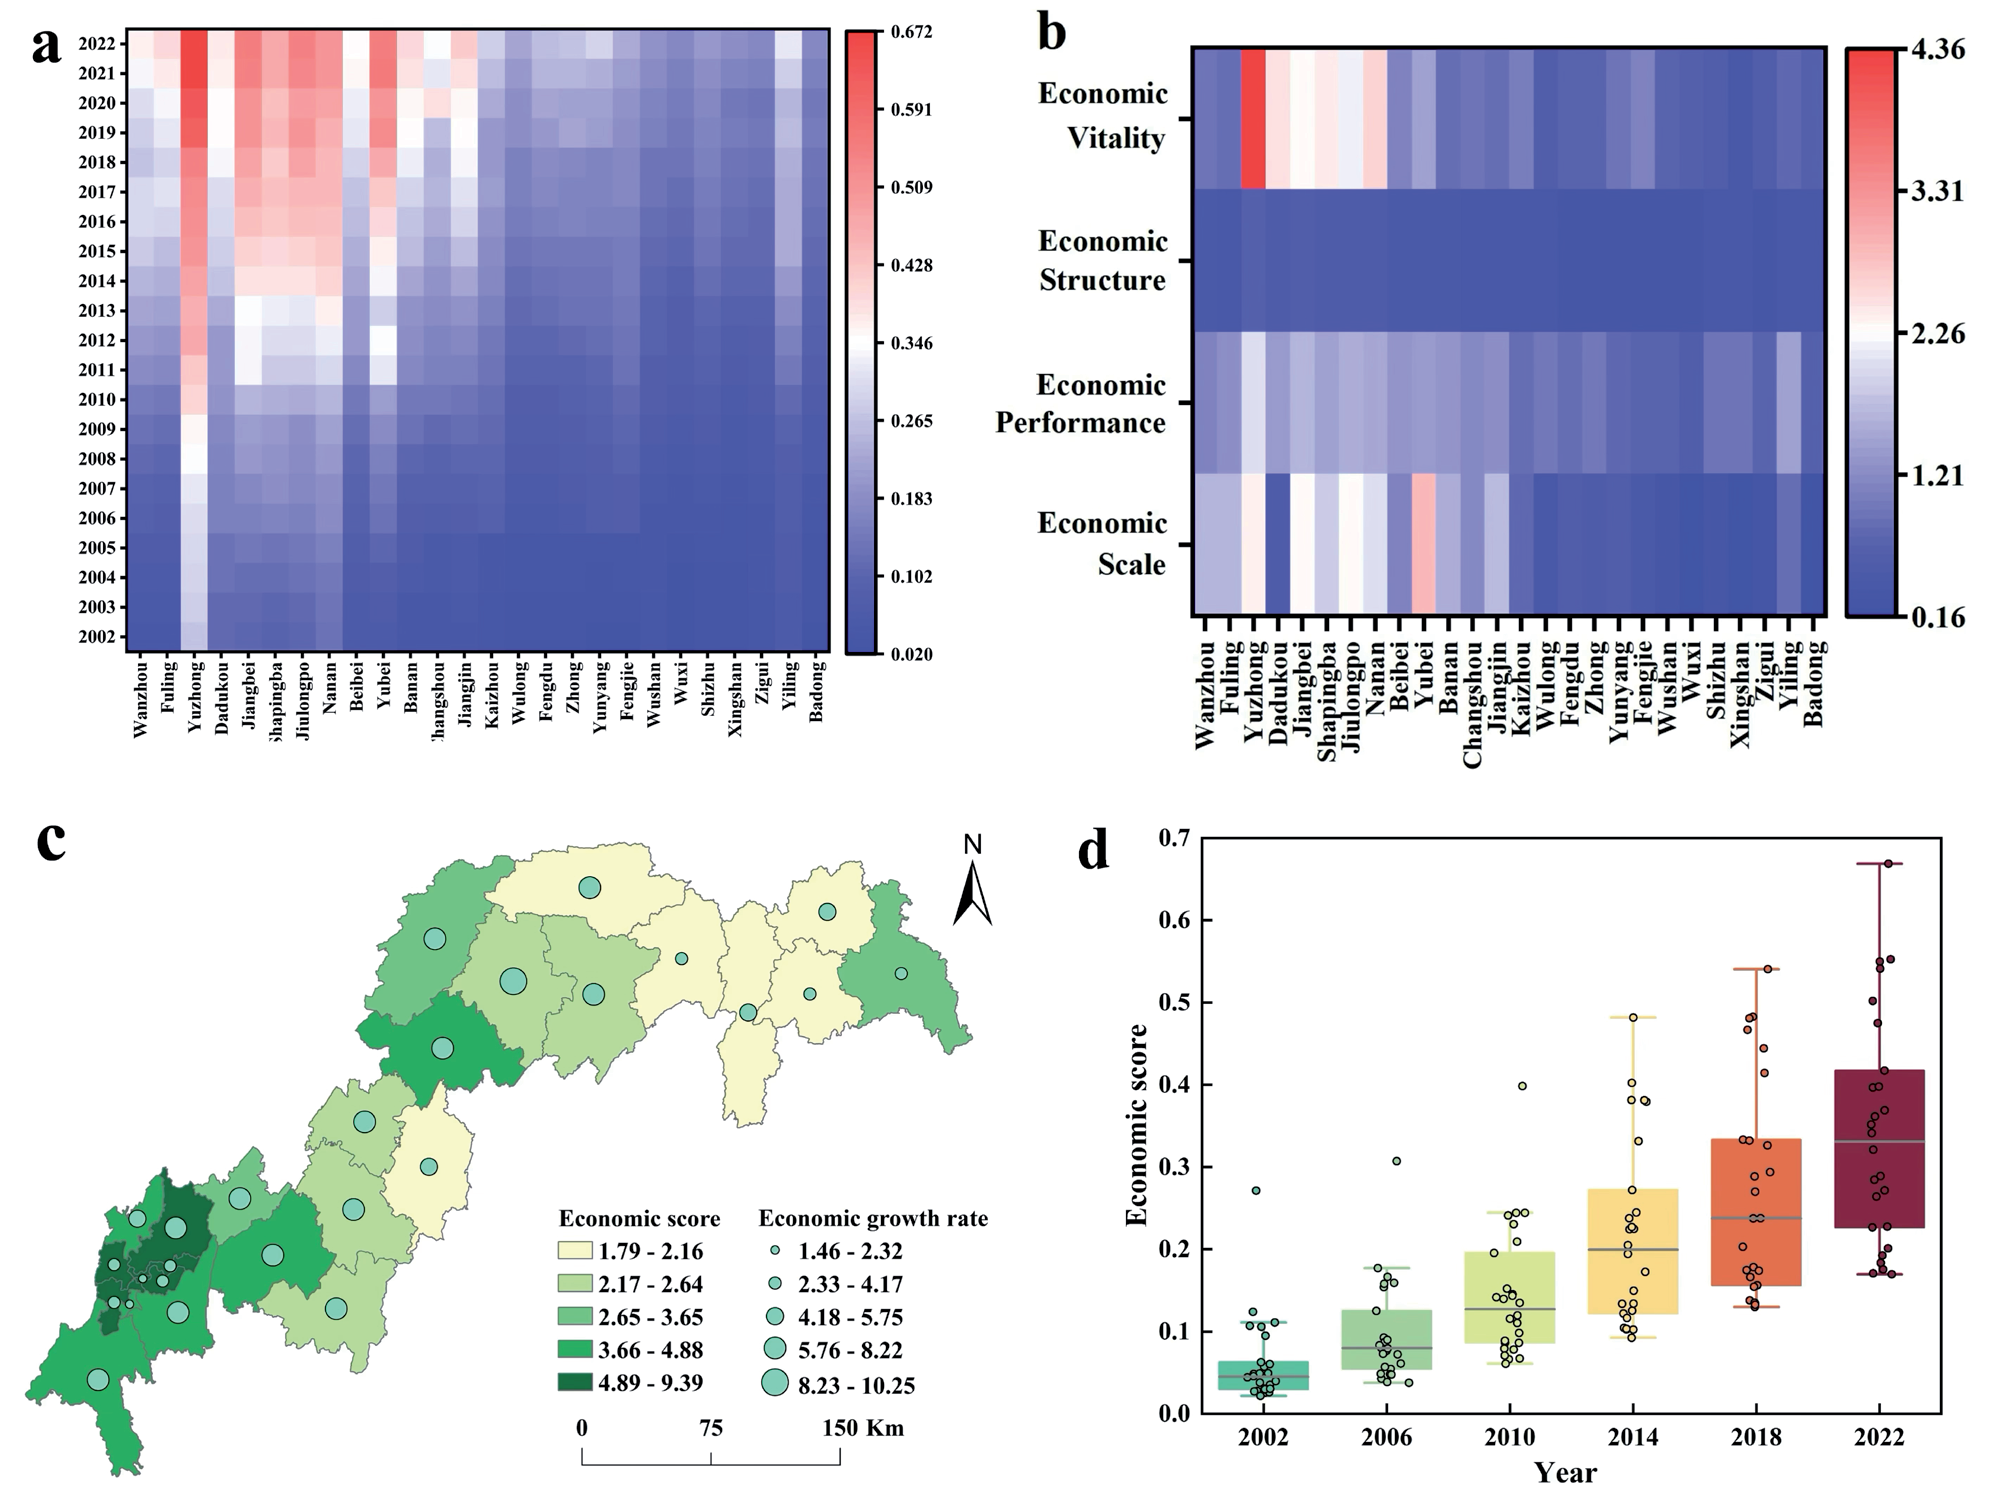
Economic development level of TGRA from 2002 to 2022 (a) the respective regions' economic development scores between 2002 and 2022; (b) four subsystems' contribution to the 26 regions' economic development; (c) the economic score and economic growth rate of each region; (d) the economic development trends of the TGRA.
Measurement of Economic Development
As is shown in Fig. 2a, from an overarching perspective, steady progress has been observed in the economic development of the TGRA. At a district and county level analysis within the Chongqing section of this area, Yuzhong District, Nanan District, Yubei District, Dadukou District, Shapingba District, and Jiangbei District emerge as frontrunners in terms of economic growth. These six districts are integral parts of the core metropolitan region of Chongqing, with Yuzhong District consistently demonstrating leadership with respect to comprehensive economic development. In contrast, among Hubei section districts and counties, Yiling District exhibits superior levels of economic advancement while others lag.
Comprehensive Figs. 2a and 2b exhibit that economic scale and economic vitality are the primary motivating factors for the sustainable economic growth of the TGRA, and it can be found that the economic vitality of the Yuzhong District drives its rapid economic development. Consequently, to achieve sustainable and rapid economic development, the city must constantly be infused with economic vitality.
As depicted in Fig. 2c, from the spatial dimension, the top ten scored Chongqing’s main urban areas all have better economic development than other areas in the TGRA. In the TGRA's Hubei section, Yiling District exhibits a relatively elevated degree of economic development when compared to the other three districts. The remaining three regions are all ranked at the bottom of the list, illustrating that their levels of economic development are comparatively lower. When viewed from the temporal dimension, the economic development of the TGRA from 2002 to 2022 exhibits a variable upward trajectory in terms of its comprehensive evaluation value. Yunyang County, Fengdu County, and Yubei District have the highest growth rates, with Yunyang County increasing by 10.25 times and Fengdu County by 8.22 times, respectively. Yuzhong District, which has expanded just 1.46 times in the last two decades, exhibits the most sluggish rate of increase. The Yuzhong District exhibits the highest degree of economic development, albeit at the slowest rate of growth.
Fig. 3.
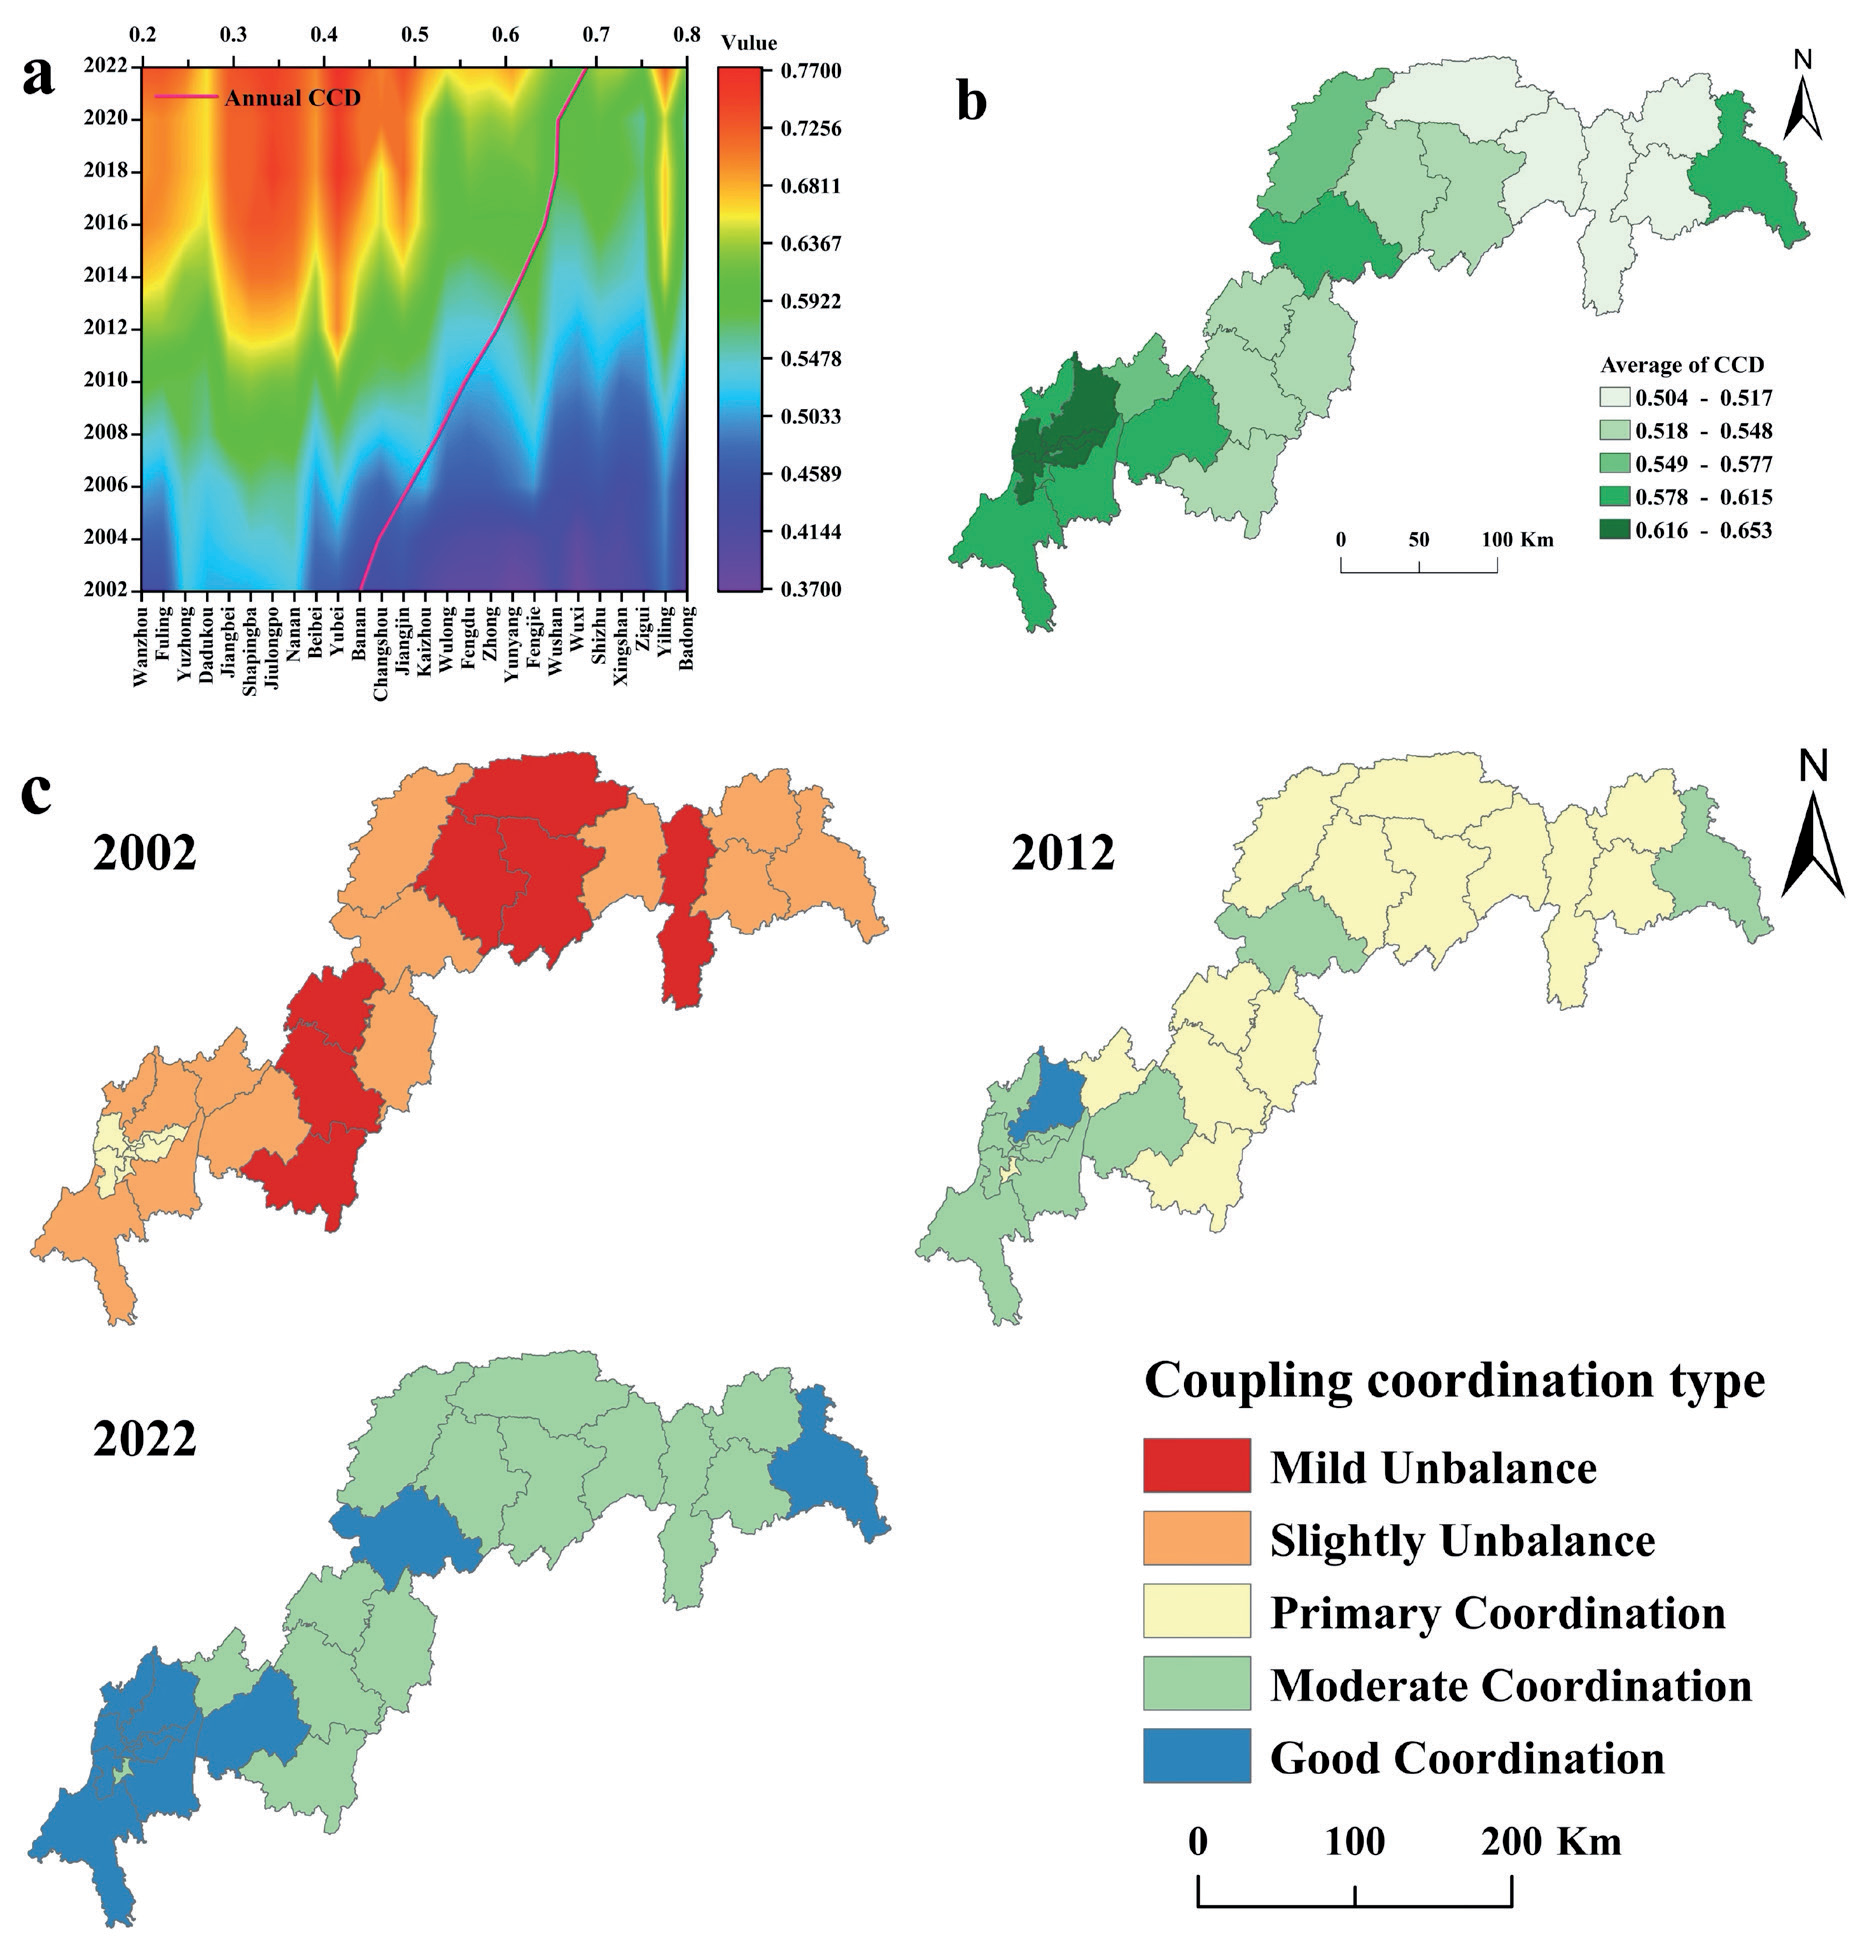
The spatial-temporal distribution of CCD in the TGRA between 2002 and 2022 (a) changing trend of CCD from 2002 to 2022 (b) the average CCD value; (c) spatial-temporal changes of CCD types in the TGRA from 2002 to 2022.
As evident from Fig. 2d, in the previous 20 years, the economic development trend in the TGRA has been steadily rising, but the economic development level gap among the districts and counties in the TGRA has also gradually widened. This is likely because the TGRA consists of two distinct administrative units, Hubei Province and Chongqing Municipality, and the governments are unable to coordinate the rate of economic development in the TGRA with one another. As a result, the socio-economic development of the TGRA is imbalanced.
CCD Evaluation Results in the TRGA
As portrayed in Fig. 3a, the average CCD value of the TGRA exhibits a consistent upward trend over the years. The CCD increases over time, rising from the stage of slightly unbalanced to the stage of moderate coordination, from 0.44 in 2002 to 0.69 in 2022. Locally, the CCD of 26 districts and counties in the TGRA presents a global increasing state; the eco-geological system and the socio-economic system are increasingly interacting.
When combined with Fig. 3b, it becomes more evident that the neighboring districts and counties in the TGRA tend to be developing similarly. Furthermore, the EGE system and the socioeconomic system exhibit a considerable spatial aggregation effect due to their synergistic development. Additionally, a robust correlation is observed between the CCD and the level of economic development, particularly in the core area of Chongqing, where the CCD is not only higher than in other areas but also has a radiating effect on the surrounding districts and counties. In the future, a mechanism for the construction and sharing of regional resource elements must be further established, and high-quality synergistic growth between Chongqing's metropolitan centers and the surrounding areas must be encouraged.
As seen in Fig. 3c: (1) From the time dimension, the CCD of EGE and economic development in each region of the TGRA has been on the rise over the last 20 years, and as of 2022, the CCD for each region has become more balanced in its development. Among them, mild unbalance and slight unbalance dominated in 2002, primary coordination and moderate coordination dominated in 2012, and moderate coordination and good coordination dominated in 2022. (2) Examining from a spatial perspective, the main high-value aggregation area is Chongqing's core area, and the region of good coordination gradually increased over time. (3) The CCD of flat terrain areas is significantly larger than the CCD of steep terrain areas, and the CCD of economically developed regions is significantly larger than the CCD of economically backward regions.
It is expected that with the comprehensive implementation of geological disaster projects, the ecological civilization concept, and industrial transformation, the CCD of the TGRA will continue to rise, and an increasing number of regions will reach a higher level of coordination in the long term.
Discussion
Comparison of Results Between GRSEI and RSEI
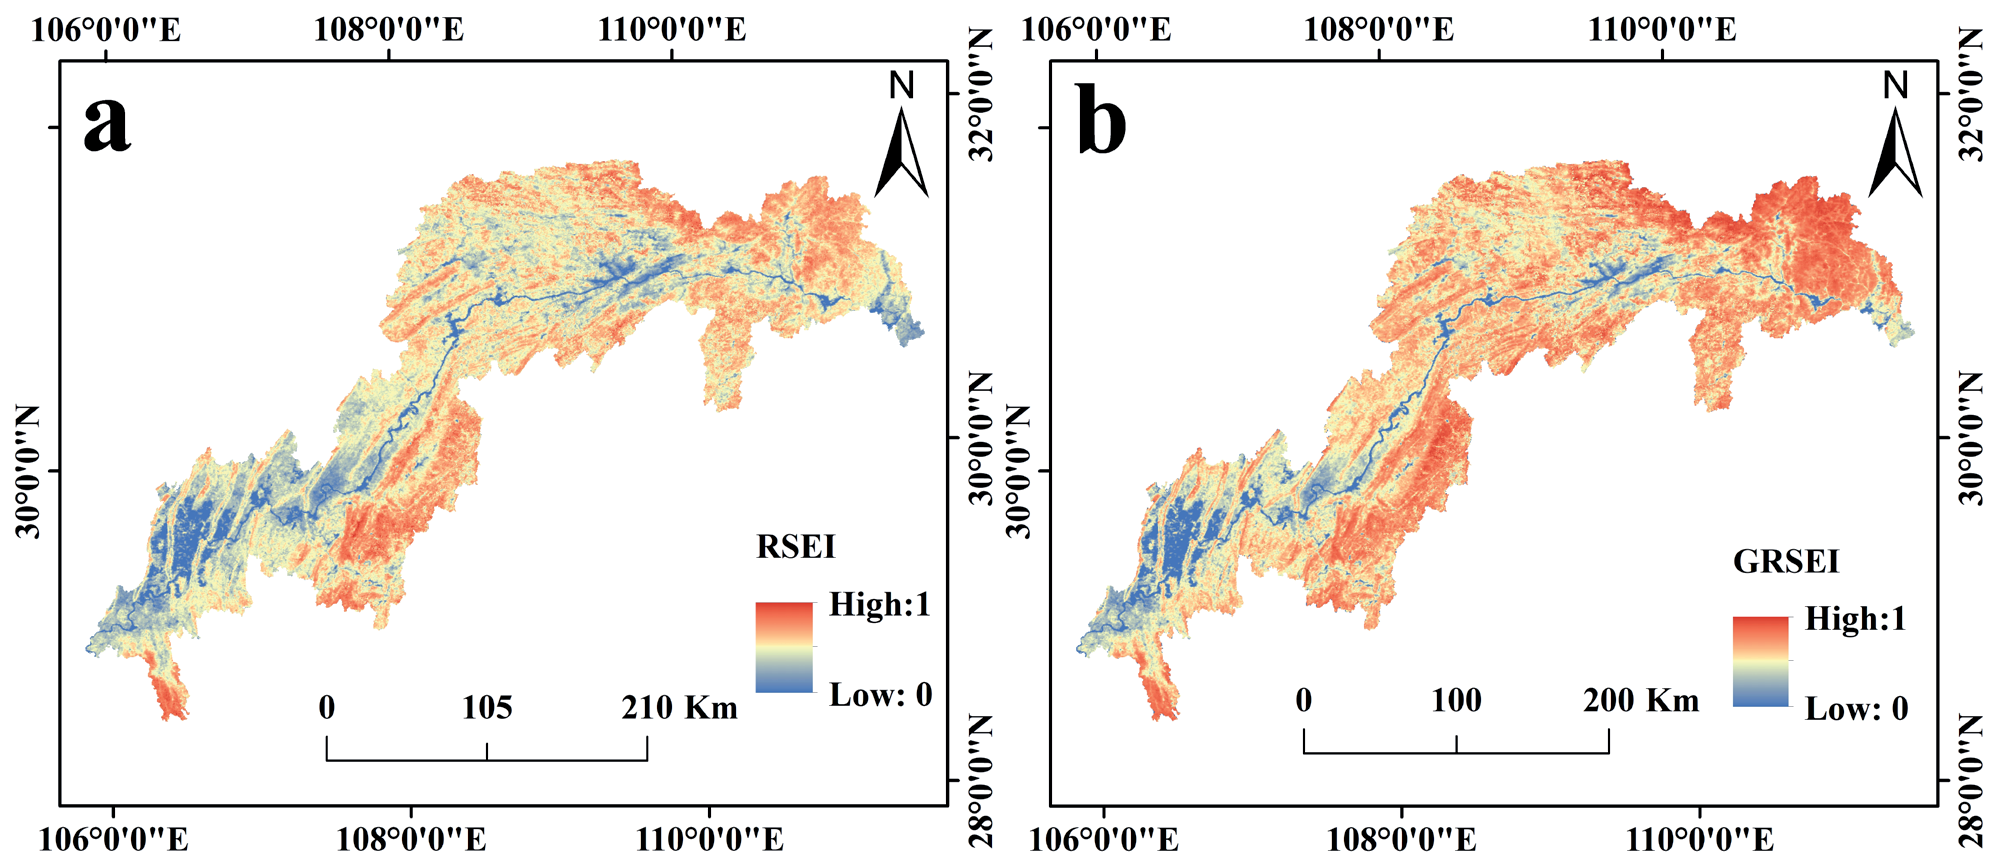
The study discovered that, in terms of spatial pattern, the application of the GRSEI model increased the EGE gap between the 26 regions of TGRA. The results of the RSEI and GRSEI in 2022 are displayed in Fig. 4a and Fig. 4b. When these two figures are compared, the GRSEI distribution area and the RSEI distribution area are roughly the same. However, the GRSEI distribution is more decentralized, making it easier to see the trends in changes in each TGRA area's natural environment and to monitor the more specific EGE of each district and county to make tailored modifications. It also demonstrates the need to consider the geologic environment when assessing the quality of the EGE because it has an impact on the TGRA's natural environment.
Currently, there is minimal analysis of the TGRA from the EGE perspective. The only research is to monitor the spatiotemporal evolution of EEQ in TGRA [46]. Considering this research, four factors reflecting the geological environment were added to measure the EGE quality in the TGRA. The comparison revealed that the results of the two natural environment monitoring in the TGRA are generally consistent. The ecological environment's serious deterioration is mainly concentrated inside Chongqing's central cities. There is a phenomenon of radiation spreading from Yuzhong District as the source to the surrounding areas in space, and there is a continuous deterioration over time. The government should prioritize and regulate the natural environment in Chongqing's central metropolitan areas to prevent the degradation of the EGE, which might impede the TGRA's high-quality economic development.
However, there are some differences between the two studies. [46] demonstrates that the overall EEQ of the TGRA was in an optimized condition during the two periods of 2000-2010 and 2010-2020. Whereas in this paper, the EGE is in an optimized state during the similar period 2002-2012, but the EGE shows deterioration in 2012-2022. From the economic development measurement of the TGRA in this study, during the period 2012-2022, the TGRA has experienced rapid economic development, a surge in human activities, and a series of natural environment resource development activities. [47] found that geohazards arise from the consequences of human activity and the natural environment when combined, and ecosphere disruption from human activity can cause partially regional geohazards, which in turn cause the EGE of the TGRA to deteriorate. The superior capability of the GRSEI model to capture spatiotemporal fluctuations in the natural environment of the TGRA and to assess the extent to which human social activities impact the condition of the natural environment in the TGRA is apparent.
Coupled Coordination in the TGRA
As time goes on, the CCD value in the TGRA has risen. By 2022, the integration of economic development and EGE in the area will have achieved a high level, with all districts and counties having reached a moderate degree of coordination. Previous research has indicated that the coupling and cooperation between ecology and socio-economics have improved in most regions of China from 2002 to 2015 [48, 49], aligning with the findings of this research. This is a result of the regional coordinated development strategy being put into effect after 2012, the new development concept being proposed, and a series of plans for ecological and environmental governance promoted the continuous synergy between economic development and EGE in the TGRA. Therefore, effective analysis of the synergistic relationships between multiple systems is possible with the CCD model. However, with the deepening of the integrated construction of the TGRA, the connection between the EGE and economic development has become more complex [50]. The paper reveals that the economic development gap in the TGRA is widening. Therefore, future growth in the TGRA should focus on achieving balanced development, especially when the coupling coordination degree reaches a high level.
An examination of the correlation between EGE and economic development in the TGRA reveals a noticeable spatial disparity among its districts and counties. The level of coupling in economically advanced regions significantly surpasses that in less developed areas, aligning with [16]. The central metropolitan area of Chongqing, focused on Yuzhong District, exhibits a greater economic scale and economic vitality. Since Chongqing's direct jurisdiction, various regions in the Chongqing section have been tilted by national policies and resources, enticing a substantial influx of individuals to relocate. The population growth has accumulated sufficient labor resources for the economic development of Chongqing's core urban area, thus providing vitality for the further development of the TGRA. On the other hand, because the core area of Chongqing belongs to a highly urbanized major economic zone [51], it is located in the plain, and the slope, as well as the degree of topographic undulation, are at a low level, which is suitable for human habitation and related economic development activities. Nevertheless, the phenomenon of growing urbanization and industrialization has resulted in the unregulated proliferation of construction land [52], strong ecological disruption from human activities, and neglect of environmental protection measures. This has resulted in increased interference with the EGE in the reservoir area, further deteriorating the environment and hindering the growth of the region to some extent. The CCD value of the core urban area of Chongqing is leading in the TGRA, suggesting that rapid social and economic development does not necessarily have a purely negative impact on the EGE, aligning with findings from [53]. As the economy advances, it will contribute to enhancing the quality of the EGE, hence boosting the CCD value.
Suggestions
To further improve the CCD of EGE and economic development in the TGRA, based on the above results, the objective of this study is to suggest a series of policy proposals for the synergistic development of the TGRA.
First, for the 9 areas with high coordination level, namely the core urban regions of Chongqing: Yuzhong District, Yubei District, Jiangbei District, Shapingba District, Dadukou District, Jiulongpo District, Nanan District, Banan District, and Beibei District. These regions experience rapid economic growth yet have lower EGE quality. Regarding EGE, it is essential to create a sustainable system for managing the ecological environment. Local government should follow the national strategy of implementing the ecological barrier in the TGRA, advocate for the execution of ecological reconstruction initiatives, such as "returning farmland to forest", promote the enhancement of ecological management practices throughout the upper Yangtze River Basin, and enhance the initiative of environmental management while improving the economic efficiency of the region. In terms of economic development, the government should take the lead in strengthening the regional economy and fostering coordination within the TGRA. It should also enhance communication and collaboration with adjacent regions in building public infrastructure and facilitating the enhancement of the industrial framework.
Second, the 8 areas with low levels of coordination are: Wuxi County, Xingshan County, Shizhu County, Wushan County, Badong County, Wulong District, Fengjie County, and Zigui County. These areas are all mountainous, with the terrain dominated by mountains and high altitudes, lagging in economic development and complex terrain. Merely focusing on farm development is not practical; an economic revolution is necessary. In terms of EGE, ecological barriers should be established to improve resilience against geological hazards. In terms of economic development, it is imperative for the government to assist the counties in achieving economic transformation, converting ecological benefits into economic benefits, and at the same time practice the green development concept of "comprehensive protection, prohibiting large-scale development".
Third, the 9 districts exhibiting a moderate level of cooperation are: Changshou District, Jiangjin District, Fuling District, Fengdu County, Zhong County, Wanzhou District, Kaizhou District, Yunyang County, and Yiling District. Among them are three districts, namely, Jiangjin District, Changshou District, and Fuling District, are located around the core area of the Chongqing section. In terms of EGE, it is advised that the government boosts its financial commitment to environmental management to create a good ecological barrier in the core urban area and prevent further deterioration of the environment. In terms of economic development, the government should rationalize the allocation of resources, provide more economic assistance, and intensify efforts to attract high-quality firms. Six of these districts and counties, Fengdu County, Wanzhou District, Kaizhou District, Zhong County, Yunyang County, and Yiling District, are located in the hinterland, except for Yiling District, which is located at the end of the TGRA. The terrain of these areas is relatively flat, the EGE is stable and good, but the economic development is relatively backward. These areas should be fully utilized for the growth of ecological industries to stimulate the economy and establish a new framework for regional development. When implementing the EGE, it is also necessary to delimit the development boundaries of districts and counties and the ecological red line in order to mitigate the degradation of the natural environment. In terms of economic development, an integrated urban-rural development model should be adopted to promote urban construction and sustainable agricultural development.
Conclusions
This research establishes a theoretical framework for assessing the quality of EGE and applies it to the TGRA, a typical mountainous area. Firstly, the GRSEI model was constructed using MODIS and DEM data to explore the spatial-temporal evolution characteristics and change trends of EGE in the TGRA from 2002 to 2022. The economic development evaluation index system was then established based on the entropy weight method. On this basis, the synergistic relationship between EGE and economic development was investigated using a CCD measurement model. This paper draws the following conclusions:
(1) Compared with the RSEI, GRSEI comprehensively considers both geological factors and ecological factors, which aggravates differences in the EGE of the TGRA.
(2) At the provincial level, the Hubei section had better EGE than the Chongqing section during the past two decades; at the county level, most core urban areas of Chongqing have poor EGE that tends to deteriorate over time. Thus, emphasizing the need for attention on EGE governance in the Chongqing region.
(3) This study utilizes the CCD model to theoretically enrich the governance system for EGE sustainability in TGRA while providing a theoretical basis for sustainable economic development across other mountainous regions.
This study exhibits certain limitations. Firstly, the indicators for calculating socio-economic development are not comprehensive enough. With the rapid development of science and technology, the progress of technology plays an increasingly important role in the development of regional economics. At present, the economic foundation of mountainous areas is relatively weak, and the role of technological progress in the economic development of mountainous areas is limited, but in the future, the index of "technological progress" should be considered in the economic development indicator system. Secondly, the CCD model is subject to external uncertainties, which can lead to inaccurate and biased results. Therefore, the quantitative simulation and verification of the coupling evolution of EGE and economic development are also the future research directions. Finally, this paper only examines the synergistic interplay between the EGE and economic development without delving into the driving forces behind this interaction, such as the influence of natural climate change on the EGE, which subsequently impacts their mutual development. The above shortcomings will be improved in future research projects.

