

Introduction
To address the challenges of global environmental capacity, ecological imbalance, and climate change, countries worldwide must collaborate in global ecological governance. This is crucial for promoting the establishment of a global community of shared future and achieving sustainable green development on a global scale. As the Belt and Road Initiative (Abbreviated as BRI in the following text) progresses, the overall scale of China’s direct investment in BRI countries to expand. The vast majority of BRI countries are in the transition phase of industrialisation and will inevitably face the problem of reconciling economic growth with green development, while the influx of foreign capital will bring a huge impetus to economic growth [1]. Most BRI countries have a weak ecological base and a large environmental debt, and are regions of the world where ecological deficits are more concentrated and cause more damage [2]. How to effectively use Chinese direct investment to achieve economic growth in BRI countries while providing new ideas for the green transformation of their growth models is not only an important practice of the Belt and Road as a global green development and ecological civilisation, but also an urgent issue for global ecological governance and the pursuit of sustainable development.
The relationship between FDI and GTFP in host countries has not yet reached a consistent conclusion and can be grouped into three categories. The first type of view is that FDI can effectively contribute to an increase in the GTFP of the host country. Host countries can use foreign investment to innovate energy-efficient and emission-reducing technologies to improve the utilisation of equipment and capacity, thereby generating energy-saving spillovers and reducing the host country’s carbon emissions and improving environmental quality [3-5]. The second view is that FDI can inhibit GTFP in host countries, that confirms the Pollution Paradise Hypothesis [6]. Host countries are negatively affected when a relatively large proportion of foreign investment is high polluting and high emitting industries [7]. The introduction of low-quality foreign investment can exacerbate factor market distortions, thereby increasing pollutant emissions and inhibiting productivity growth in the host countries [8]. The third type of view is that the relationship is not simply linear. Song et al. used a two-layer stochastic frontier model to demonstrate that the effect of foreign investment introduction on carbon emissions in the host country is both promoting and inhibiting [9]. Qiu et al. argued that the inhibiting effect of foreign investment introduction on GTFP in the host country can be mitigated by environmental regulations [10]. Wang et al. used data from 30 provinces from China as a sample to empirically obtain that the relationship between FDI and carbon emissions shows an inverted “U” shape, with the accumulation of FDI to a certain threshold value suppressing the carbon emissions of the host country [11].
Currently, the discussion of green development in BRI countries under the Belt and Road Initiative focuses more on assessing the level of green development [12, 13], while the role played by China’s outward foreign direct investment (OFDI) has received less attention. Although a few studies have explored the green effect of China’s Belt and Road Initiative from the perspective of policy evaluation [14], the literature has mostly provided empirical evidence to explore the green effects of the Belt and Road Initiative in China from the home country perspective, including the macro-regional aspect [15], the industry development [16], and the micro-firm level [17]. Some of the literature discusses the green development of BRI countries from the perspective of host countries, but only focuses on the greenness of the Belt and Road Initiative in the energy sector [18], or discusses the promotion of green construction in the Belt and Road Initiative based on the influence of institutional distance [19] and national cooperation modes [20]. However, there is a lack of attention to the underlying mechanisms of the green development effects of China’s direct investment in BRI countries. Therefore, this paper aims to address this gap by integrating China’s outbound direct investment with green development in BRI countries within the same research framework, revealing the intrinsic impact mechanisms of China’s direct investment on the green total factor productivity in BRI countries, and exploring the variations in effects through different pathways. This will contribute to a deeper understanding of the overall effects.
In general, in order to sustain the Green Belt and Road Initiative and foster greater international green cooperation, it is essential to address the following key questions: Does the implementation of the Belt and Road Initiative contribute to the growth of Green Total Factor Productivity (GTFP) in BRI countries, and if so, what specific mechanisms drive this growth? Additionally, do different transmission paths have varying impacts on GTFP? The answers to these questions will offer fresh insights into the green development of BRI countries and provide valuable guidance for the Chinese government in formulating more targeted policies pertaining to direct investment in BRI countries.
Theoretical Mechanisms and Research Hypothesis
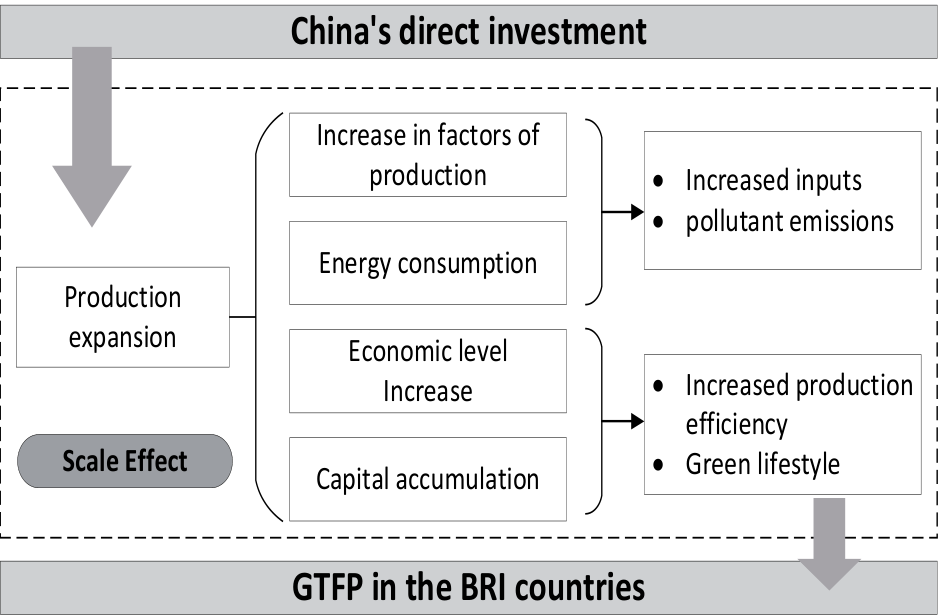
Scale Effect
China’s direct investment in BRI countries will directly expand the capital stock and scale of output in BRI countries, thus stimulating overall market dynamics and promoting economic expansion [21], which will increase pollution emissions within BRI countries and thus affect GTFP to some extent. However, the incremental returns to scale effect of direct investment in China will also reduce energy consumption per unit of output [22]. When the economy reaches a certain level of expansion, energy-efficient industries will be favoured by capital, further promoting the development of resource-efficient industries and reducing social energy consumption. In addition, the scale expansion effect will also encourage domestic capital to actively go abroad and set up subsidiaries around the world to expand production and reap economic benefits [23], which in turn will affect the GTFP of BRI countries. Based on the above analysis, we propose research hypothesis 1:
H1: China’s direct investment boosts GTFP of BRI countries through scale effects.
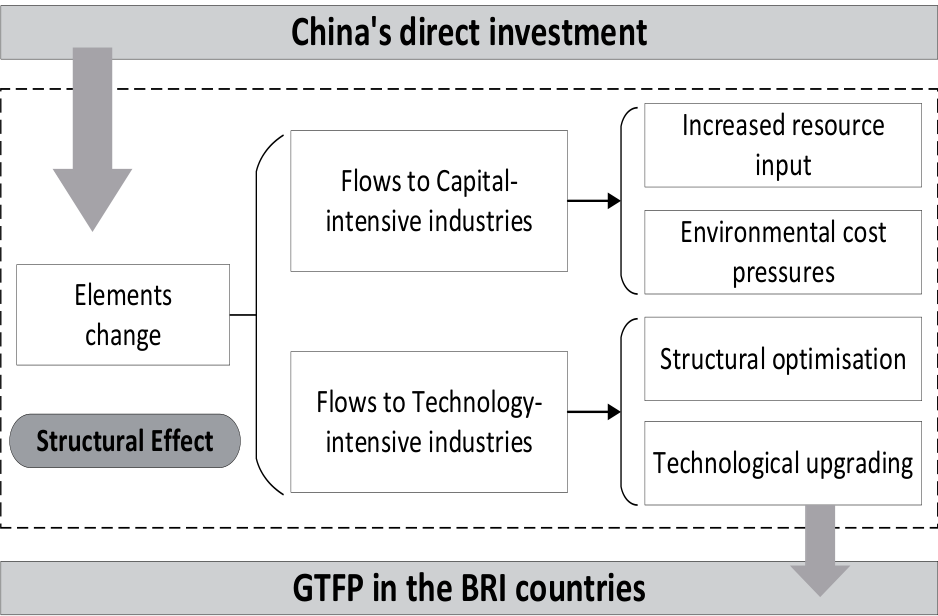
Structural Effect
China’s direct investment in BRI countries will directly contribute to an increase in their capital-intensive products, which will inevitably lead to a decrease in products that are intensive in the use of other factors, thus affecting the industrial structure. However, as the marginal benefits of capital-intensive products decrease, foreign investment will gradually shift to technology-intensive industries, and the change in industrial structure will reduce the negative impact on the environment [21]. In addition, the change in industrial structure will exert pressure on the backward industries in the host country, creating a push-back effect and promoting local enterprises to innovate technology or learn advanced management experience in order to maintain market competitiveness [24, 25]. The continuous change of old and new industries will eventually promote the emergence of green industries in the country, thus optimising the allocation of resources in society, reducing energy consumption and increasing GTFP. Based on the above analysis, we propose research hypothesis 2:
H2: China’s direct investment boosts GTFP of BRI countries through structural effects.
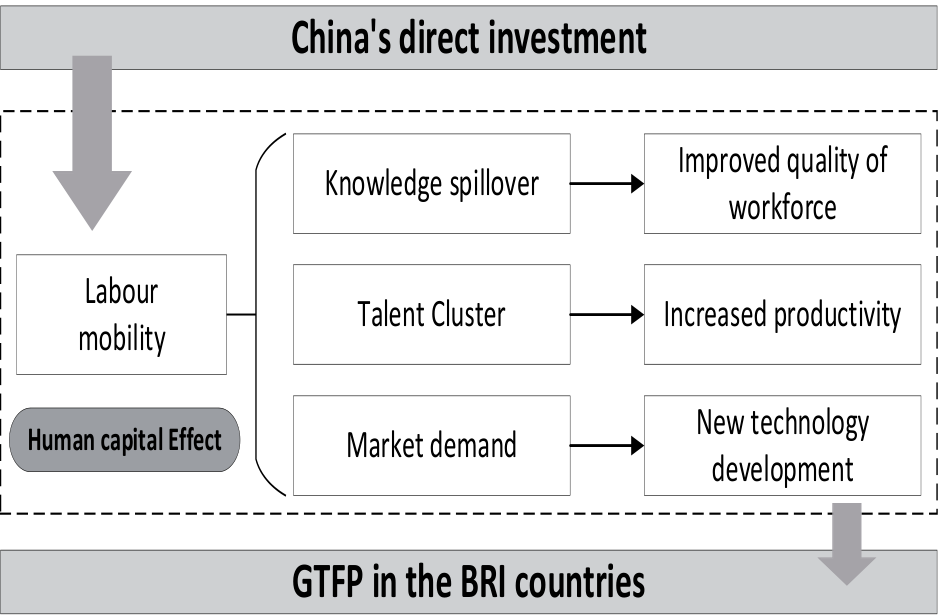
Human Capital Effect
The establishment of Chinese subsidiaries in BRI countries will be accompanied by cross-border movement of personnel, resulting in passive knowledge spillover [26]. Inter- and intra-firm access to advanced technology and management experience through learning and training and project cooperation will lead to an improvement in the quality of the local workforce and higher levels of human capital. The improvement of human capital can greatly contribute to the development and application of technology, thus promoting the development of productivity and labour productivity, which is manifested in the increase of natural resources utilisation and production value [27]. In summary, we propose research hypothesis 3:
H3: China’s direct investment may boost GTFP by boosting human capital.
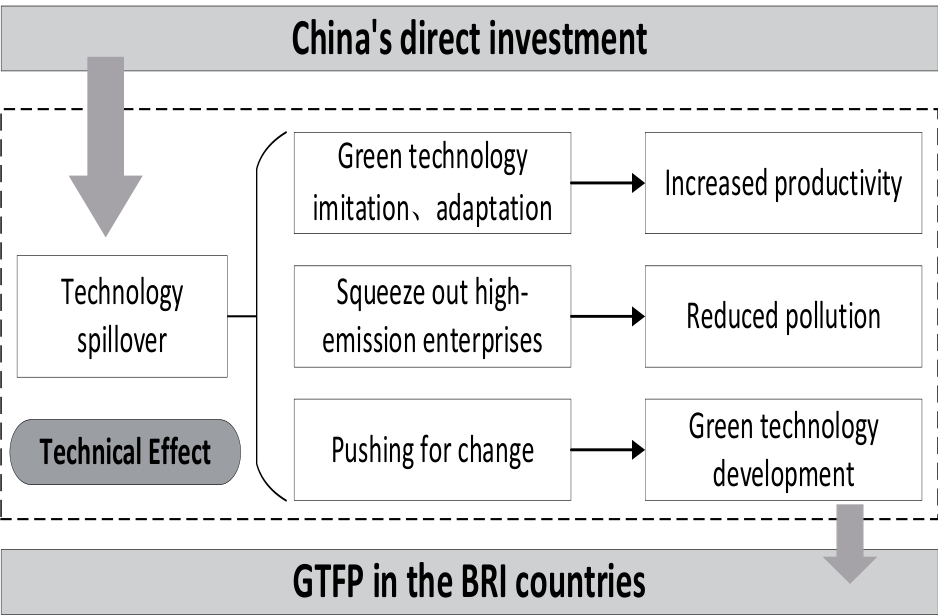
Technical Effect
Foreign direct investment is one of the sources of technological progress in the host country [28]. The host country can digest, absorb, imitate and reinvent the imported green processes and clean technologies, and this innovation cost saving effect can reduce the trial and error costs that may arise in the R&D process [29]. Foreign-invested enterprises will provide technical support to upstream and downstream enterprises in carrying out technical training due to their production needs, which will in turn generate a technology spillover effect and raise the technological level of BRI countries. In addition, the introduction of new technologies will intensify market competition and force local enterprises to conduct their own R&D. As the application of green technologies and green processes gradually spreads, the energy use structure will be improved [30], thus enhancing the GTFP of BRI countries. We therefore formulate hypothesis 4:
H4: China’s direct investment boosts GTFP of BRI countries through technical effects.
Material and Methods
Model Setting
The Direct Effect
The dynamic panel model not only reveals the dynamics of GTFP, but also overcomes the bias caused by endogeneity. Given the cumulative nature of green development, the current period of green total factor productivity is affected by the previous period, and the resulting endogeneity problem may lead to inaccurate estimated coefficients from ordinary least squares or fixed effects models. Therefore, this paper adopts the systematic generalised method of moments estimation (System-GMM) to estimate the dynamic panel model, and the specific model settings are as follows:
In this model, i is the State, t is the year, GTFPit denotes the green total factor productivity of country i in year t, OFDIit denotes the stock of China’s outward investment in country i in year t, URBit, GOVit, FDIit, OPENit are urbanization, government intervention, foreign direct investment, trade openness, β1 is a constant term, β1-β6 are estimated coefficients, μi is Unobserved regional effects; ε1it is a random perturbation.
Intermediary Effect
In this paper, in order to further analyze whether the scale effect, structural effect, human capital effect and technology effect play a role in the transmission mechanism of China’s direct investment affecting GTFP in BRI countries, based on the dynamic panel model, this paper sets up a mediating effect model as follows:
Mit and Mit–1 represents the mechanism of action and its lagging term, a0 and b0 are the constant term, a1-a6, b1-b6 are estimated coefficients, ε2it and ε3it are random perturbation.
Variable Selection and Description
Explained Variable
Data Envelopment Analysis (DEA) is a non-parametric technical efficiency analysis method based on the relative comparison between the evaluated objects [31]. However, the traditional DEA model has shortcomings. When there are multiple effective decision-making units (DMU), the efficiency values of the ordinary DEA model output are 1, which cannot be further compared. Compared with the traditional DEA model, the Super-Efficiency DEA model can further distinguish and compare the efficiency of multiple DMUs, and the efficiency value can exceed 1. Assuming that there are n independent DMUs, each DMU has k inputs and m outputs, as follows:
θ represents GTFP of DMU, x and y represent input and output variables respectively. λ represents the weight variable of DMU. si– and sr+ are slack variables, representing input excess and output deficiency. When θ = 1 and the slack variable is 0, which means DMU is valid. When θ = 1 but the slack variable is not 0, which means DMU is weakly effective. θ<1 and at least one slack variable is not 0, which means DMU is invalid.
Malmquist-Luenberger’s (ML) index can be used to measure the dynamic increment of total factor productivity. However, due to the shortcomings of the ML index, such as non-transferability and unsolvable linear programming, the GML index [32] based on global production technology is constructed. GML index has the characteristics of transitivity and cyclic multiplication, which can avoid the infeasible solution of linear programming and the inward shift of the production front. Using the global directional distance function, the GML index from t to t+1 is defined as follows:
(6)
Dg(x, y, b) represents the full-distance directional function, which depends on the global production possibility set---Pg(x). GMLt,t+1>1 represents the growth of green development efficiency. GMLt,t+1<1 represents the decline of green development efficiency. GMLt,t+1GML index can be further decomposed into efficiency change index (ECt,t+1) and technology change index (TCt,t+1). Efficiency change index and technology change index greater than 1 respectively represent efficiency improvement and technological progress.
In summary, the super-efficient DEA model combined with the GML index analysis was adopted to measure the GTFP of BRI countries. The selection of indicators has been collated in Table 1. Labour, capital and energy consumption are used as input indicators, real gross regional product is used as desired output and CO2 emissions are used as undesired output.
Core Explanatory Variable
The core explanatory variable is China’s direct investment in BRI countries. Considering the large fluctuation of OFDI flow data, and the OFDI stock data can better reflect the long-term impact of OFDI on GTFP compared with the flow data, OFDI stock data are used as an independent variable in empirical research.
Mediator Variable
The scale effect (ES) is determined by the size of the economy, which is quantified using the deflated GDP per capita of the BRI countries. The structural effect (IS) is characterized by the advanced industrial structure, measured by the contribution of services to the GDP of the BRI countries. The human capital effect (HUM) is assessed through the human capital index, calculated based on the years of education and the return on education. Finally, the technology effect (TI) is represented by technological innovation, measured by the total number of patent applications, including both resident and non-resident, from the BRI countries.
Control Variable
The control variables in this study encompass the level of urbanization (URB), government intervention (GOV), foreign direct investment (FDI), and trade openness (OPEN). Urbanization level is calculated as the percentage of urban population in the total population. Government intervention is quantified by the proportion of government general consumption in GDP. Foreign direct investment is measured by the proportion of non-Chinese direct investment attracted by BRI countries in relation to GDP. Trade openness is assessed by the proportion of the sum of imports and exports in relation to GDP.
Data Sources
The data in this paper were selected from 48 BRI countries from 2008-2019, with some missing data filled in using interpolation. All data above are obtained from the World Bank Development Indicators Database (WDI), BP World Energy Statistics Yearbook, CEIC database, Penn World Table 10.0 and foreign official statistics websites in the National Bureau of Statistics of China. Table 2 shows the descriptive statistics for each variable.
Results and Discussion
Analysis of GTFP Characteristics
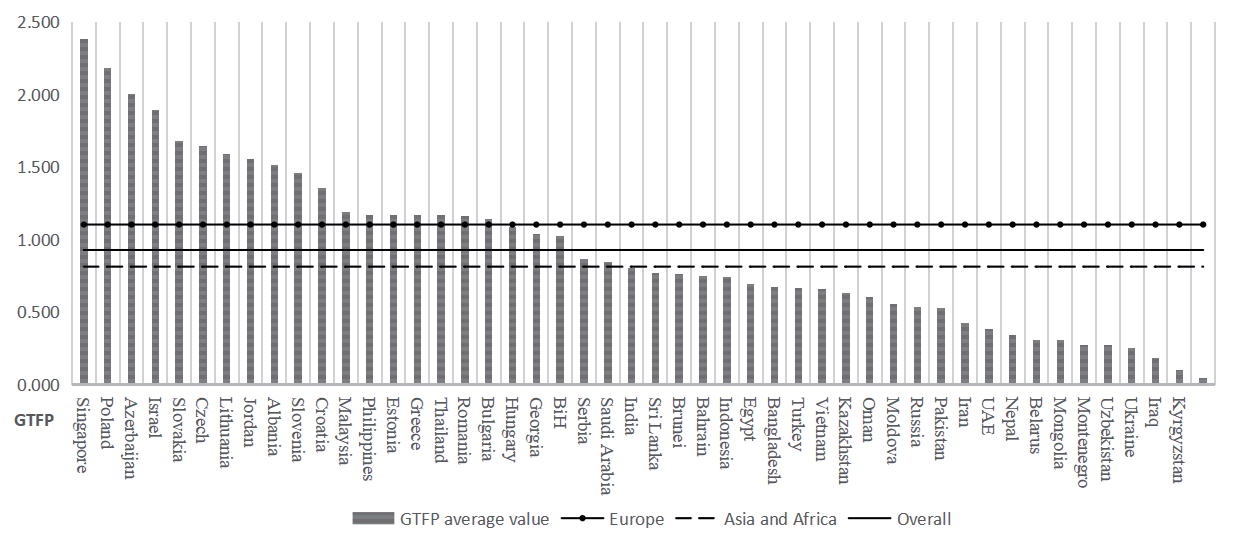
The GTFP of the 48 BRI countries for 2008-2019 was measured accordingly and Fig. 5 shows the average value of the GTFP for 2008-2019. Overall, there is a 50/50 mix of countries above and below the overall average, with a wide range of GTFP averages between countries. The average value of GTFP for European countries is above 1 and is in an effective state overall, and the average GTFP for Asian and African countries is below 1 and is ineffective overall. The top countries in GTFP are mainly in developed countries in Central Europe and Asia, with Singapore, Azerbaijan and Israel being the main drivers of GTFP in Asia, and Countries such as Poland, Slovakia and the Czech Republic are at the front end of the BRI countries in Europe. The countries at the bottom are mainly concentrated in developing countries in Central Asia. Most developing countries in Asia are currently in a mismatch between inputs and outputs, with low resource utilisation, resulting in a low GTFP.
Table 1.
System of indicators for measuring GTFP in BRI countries.
Table 2.
Variables’ Descriptive Statistics.
Dynamic Panel Regression Results
We select the system GMM method to estimate the parameters of the constructed dynamic panel model, and the results are shown in Table 3. From the estimation results of model 1-5, firstly, all the coefficients of one-period lagGTFP and GTFP are positively significant, indicating that GTFP is a process of continuous accumulation, and also providing necessary support for the construction of dynamic panel model in this paper. Secondly, the Sargan test results are not significant, indicating that there is no over-identification of instrumental variables in system GMM estimation, and the lag term of GTFP is effective as an instrumental variable. In addition, the effectiveness of system GMM estimation needs to be verified. On the one hand, all p values in the second-order serial correlation test results – AR (2) are not significantly indigenous, so the null hypothesis that the disturbance term has no auto-correlation is accepted, indicating that the endogeneity of the dynamic panel is overcome, which proves the effectiveness of the system GMM estimation. On the other hand, we use the least square method and the fixed effect model to estimate [33], the estimated results are shown in Models 7-8. The coefficients of the lag terms of GTFP estimated by system GMM are between FE estimation (0.6655) and OLS estimation (0.9497), which further shows that the estimation results of system GMM are effective.
From the perspective of model 1-7, the coefficients of OFDI are significantly positive, indicating that China’s direct investment in BRI countries contributes to the green development of BRI countries. According to the estimation results of the model 5, China’s direct investment in BRI countries increases by 1%, and the GTFP of BRI countries increases by about 0.1 %. This result shows that China’s direct investment in countries along the Belt and Road is not concentrated on projects with high pollution and high emissions. In the construction of the Belt and Road, it also pays great attention to green cooperation with countries along the Belt and Road, helping to improve the utilization rate of resources in BRI countries, so as to promote the green economic development of countries along the Belt and Road.
Robustness Test
In order to ensure the robustness of the dynamic panel regression results, this paper uses China’s direct investment flows to BRI countries to re-estimate the original stock data instead. The estimation results in Table 4 show no change in the sign and significance of the OFDI coefficients, indicating that Chinese FDI in BRI countries can significantly boost their GTFP.
Mediating Effect Test
Non-Parametric Percentile Bootstrap Method Based on Deviation Correction
To investigate the transmission mechanism of China’s direct investment in BRI countries affecting their GTFP, the Non-parametric percentile Bootstrap method based on deviation correction is used to test for mediating effects. The Bootstrap method is a non-parametric repeated sampling that does not require the mediating effects to be normally distributed, and bias correction on this basis corrects for asymmetries in the distribution of effect values, making the estimates more accurate.
Table 3.
The impact of OFDI on green development.
Table 4.
Robustness Test.
From the perspective of the mediating mechanism of the scale effect (ES), China’s direct investment can significantly promote the economic scale expansion of BRI countries, with each 1% increase in OFDI increasing the economic scale of BRI countries by nearly 0.5%, and as their economic scale expands, the GTFP of BRI countries can also be enhanced, so the product of the two regression coefficients is significantly positive. This result confirmed hypothesis 1. At the same time, the confidence interval of the indirect effect does not contain zero, which proves the existence of the mediating role of the scale effect. The coefficient of the total effect is significantly positive, and the coefficient of the direct effect is positive but not significant, which also indicates that China’s direct investment mainly promotes the expansion of economic scale of BRI countries to increase their GTFP.
In terms of the mediating mechanism of the structural effect (IS), the 95% confidence interval of the indirect effect does not contain zero, indicating that the structural effect plays a significant mediating role in the green impact of China’s direct investment in BRI countries. This is reflected in the fact that China’s direct investment in BRI countries can significantly promote the upgrading of their industrial structure, which in turn can increase the GTFP of BRI countries. This result confirmed hypothesis 2. In addition, the direct effect coefficient of the structural effect is positive but insignificant, while the total effect coefficient is positively significant, which suggests that structural effects play a major mediating role in the impact of China’s direct investment in BRI countries on their GTFP.
In terms of the mediating mechanism of the human capital effect (HUM), China’s direct investment has the potential to enhance the human capital level of BRI countries. Specifically, for each 1% increase in outward foreign direct investment (OFDI), the human capital level of BRI countries is raised by 0.35%. Similarly, an increase in the human capital level is associated with an increase in GTFP. The product of these coefficients also demonstrates a significantly positive relationship. The 95% confidence interval for the indirect effect does not include zero, indicating the significant mediating effect of human capital. Moreover, the coefficient of the total effect is positive and significant, whereas the coefficient of the direct effect is positive but not statistically significant. This finding further supports the notion that China’s direct investment contributes to the growth of GTFP in BRI countries through the human capital effect. These findings provide confirmation of hypothesis 3.
In terms of the mediating mechanism of the technology effect (TI), China’s direct investment can promote technological innovation in BRI countries, but the effect of technological innovation in BRI countries on their GTFP is negative and insignificant. In addition, the confidence interval of the indirect mediating effect contains zero, indicating that the mediating effect of technology effect is not significant. This result is inconsistent with hypothesis 4. This may be due to the fact that most of China’s direct investment in BRI countries is currently focused on infrastructure construction and the proportion of technology-intensive industries is low, coupled with the fact that most BRI countries are developing countries and there is still a large gap between their technological level and that of developed countries [34], so the technology effect alone cannot drive the increase in GTFP.
Table 5.
Bootstrap Test Results of Mediating Effect.
Stepwise Regression Test
In this paper, we will use stepwise regression to further test and analyse the mediating effect. As the regression results of the dynamic panel model indicate that the effect of OFDI on GTFP is positively significant, the preconditions of the stepwise regression test are valid, and the subsequent regressions are mainly conducted on the indirect effects.
In Table 6, the coefficients of OFDI in models 13, 15 and 17 are positive at the 1% significance level, indicating that China’s direct investment significantly contributes to economic expansion, industrial structure upgrading and human capital enhancement in BRI countries. The coefficients of the mediating variables in models 14, 16 and 18 are all significantly positive, indicating that the scale effect, structural effect and human capital effect all play a mediating role in the promotion of GTFP in BRI countries by China’s direct investment. However, the positive but insignificant coefficient on OFDI in model 19 suggests that China’s direct investment has no statistical impact on technological innovation in BRI countries and that the technology effect does not play a mediating role. The above results are in general agreement with Bootstrap test.
Sobel-Goodman Method
To specifically analyse the difference between the different transmission paths, the Sobel-Goodman method was applied for further analysis. In Table 6, the Sobel test, Aroian test and Goodman test all show that the scale effect, structural effect and human capital effect have significant mediating effects, further verifying hypotheses 1-3. In the technology effect, the results of all three tests show that China’s direct investment cannot enhance the BRI countries through the technology effect at present. Comparing the transmission paths, the scale effect plays the largest mediating role, followed by the structural effect and the human capital effect, suggesting that China’s direct investment mainly enhances the GTFP of BRI countries by increasing the scale of their economies. At present, China’s direct investment in BRI countries is more focused on economic expansion and more opportunities need to be sought in technology cooperation in the future.
Moderating Effect Test
In this paper, the original mediating variables are used as moderating variables to further test the moderating effect under the premise of the mediating effect. In Table 8, the coefficients of the interaction terms of models 21-23 are all significantly positive, indicating that the scale effect, structural effect and human capital effect all positively moderate the impact of OFDI on GTFP. In comparison, the structural effect has the largest moderating effect, followed by the scale effect and the human capital effect. It shows that the GTFP boost is more significant in BRI countries with a more advanced industrial structure for the same investment intensity. From model 24, the interaction term between technological innovation and OFDI is negative at the 10% significance level, indicating that the technology effect negatively moderates the impact of OFDI on GTFP. This may be due to the fact that when a country’s technology level is low, the introduction of foreign investment can quickly improve production and management efficiency and enhance the scale effect, thus increasing GTFP to a greater extent; however, when the technology level gradually increases, the introduction of foreign investment is unlikely to bring about technological change, and it is more likely to rely on independent research and development of domestic technology to increase GTFP at this time.
Table 6.
Stepwise Regression Test Results.
Table 7.
Indigenous test of mediating effect.
Table 8.
Moderating Effect Test.
Conclusions and Policy Implications
Conclusions
Based on panel data from 48 BRI countries from 2008-2019, the impact of China’s direct investment on GTFP in BRI countries is empirically tested. The main findings of this paper are as follows: (1) China’s direct investment in BRI countries can effectively contribute to their GTFP increase. (2) China’s direct investment raises the GTFP of BRI countries through three main channels: the scale effect, the structural effect and the human capital effect, where the scale effect is the main transmission pathway. (3) Scale, structural and human capital effects can all reinforce the green effect of China’s direct investment in BRI countries. And structural effects have the strongest moderating effect of these. (4) The impact of China’s direct investment on the GTFP of BRI countries is not statistically transmitted through the technology effect route. And the technology effect negatively moderates the green effect of China’s direct investment in BRI countries.
Policy Implications
Based on the above conclusions, some feasible policy recommendations to further deepen Belt and Road cooperation and improve the green development of BRI are proposed.
(1) Continue to promote the construction of the Green Belt and Road, and accelerate the construction of the Green Belt and Road international cooperation mechanism. China’s direct investment in BRI countries can significantly increase their GTFP, so it is necessary to continue to further promote the Belt and Road Initiative. China and the BRI governments should actively cooperate to build a green Belt and Road data platform to share information and exchange situation on green development among BRI countries by publishing their environmental policies, technologies, industries, regulations and standards. Countries need to jointly explore the establishment of a transnational joint meeting system for green economy cooperation to strengthen institutional safeguards and international cooperation on ecological and environmental protection, thereby helping BRI countries maximise economic, environmental and social benefits in green development practices.
(2) Focus on the BRI countries’ own economy, talent building and optimising the industrial structure so as to effectively leverage the green-driven benefits of China’s direct investment. The empirical results suggest that BRI countries with more advanced industrial structures, higher levels of economic development and human capital are better able to take advantage of China’s direct investment to achieve high-quality green development. Therefore BRI countries should focus on economic construction and promote the flow of talent, capital and other factors in the construction process. At the same time, they should be guided by sustainable development, accelerate industrial restructuring, drive the transition to a rationalised and green industrial structure, and make better use of China’s direct investment to achieve coordinated development of the economy and the environment.
(3) Building a technology pathway for OFDI to promote green technology development in BRI countries. From the empirical results, the green driving effect of Chinese FDI in BRI countries mainly relies on economic scale expansion, while the technology effect is currently underplayed, and technological innovation itself can increase domestic GTFP, so it is necessary to construct a technology path for OFDI. The Chinese government should optimise the industrial structure of OFDI and actively encourage enterprises to engage in international green technology cooperation, such as setting up low-carbon technology institutes and establishing green development investment funds. In addition, the government should continue to strengthen the green supervision of domestic enterprises in the process of “going global” and rectify those enterprises whose production and operation do not meet the carbon emission requirements.

